Gold Charts and Trading signals
Gold, Oil, Natural Gas, & SP500 Futures Trading Alerts Coming Soon…
Futures and CFD trading alerts for virtually 24 hour trading. Alerts are based weekly, daily, hourly and 5 minute trading charts. Using hard stops and trailing stops allows us to trade around the clock as positions mature during times we are not available to watch our screens.
Trades vary in holding times from a few minutes to several days depending on market volatility and current trends.
Gold Futures Trading - Coming Soon...
Get My Free Economic Indicator Guide & Free Weekly Gold Charts
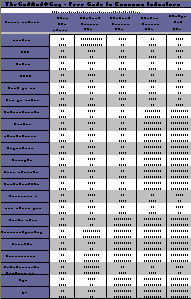
Free Trading Table Shows It All
Over 20 economic indicators are provided in a simple 1 page chart it shows you how each of the top indicators effect the Stock Market, Bond Prices, US Dollar, and the Spot Gold Price. You will also recieve my weekly special report on gold.
Become A Better Trader
Some of the main economic indicators for navigating the financial stock markets are Interest Rates, GDP, Unemployment Rate, Retail Sales, Industrial Production, Housing Starts, Personal Income, New Home Sales, and Business Inventories. These are just some of the main leading indicators to look at. |
 |
Complete Form Below for the Guide and Weekly Gold Charts
The Basics of Gold & Gold Charts
Gold and gold charts have been around for hundreds of years. Gold is considered a safe haven for investors irrespective of what happens to the dollar, the stock and bond markets. It is perceived as a hedge against economic uncertainty and a vehicle to protect wealth. This being the case, it is worthwhile to closely examine gold charts and try to find out the where the price is headed in the future.
Gold protagonists say that there is no ‘right’ time to invest in the yellow metal. One can buy gold whenever one can afford and feels like. But a look at historical gold price chart shows the price of gold has indeed fluctuated just like the stock indices. It rose steadily from around $45 an ounce in January 1971 to touch an intermediate high of $850 in 1980. It fell to below $300 levels in 1985 and to $250 levels in mid 1999 and again in beginning of 2001. It touched all time high of about $1040 an ounce in the third quarter of 2007 and has fallen to around $750 levels this year. Since 2001, gold has tripled in value. Long term gold charts are a useful aid to understand gold price movement.
An investor interested in the bullion market can also benefit from rising gold prices by investing in gold ETFs like GLD, GDX, DGP etc and in gold mining & gold refining companies. Gold can be held in the form of coins, bars or gold stocks. The choice is entirely up to an individual’s perception and liking. But buying and selling gold stocks is much more convenient and quick. It is the right choice for speculators who want to take advantage of price movements. Buying physical gold would suit savers and long term investors better. What percentage of assets should be held in the form of gold and gold related investment varies with an individual’s analysis of economic situation and the various alternate forms of investment available. Generally it is suggested that 10 to 30% of assets can be held in the form of gold.
Choosing the right medium to invest in like directly in gold or ETFs etc and also the timing requires expert knowledge of the bullion market. A novice or those who do not have the time to analyze market movements can take help from many experts in the field. Many websites like www.thegoldandoilguy.com analyze gold charts for you and provide valuable tips regarding investing in gold and gold ETFs. The site provides access to live charts during trading days and a trading strategy guide to subscribers to decide on future course of action. All the popular gold ETFs are tracked closely through charts in the site. Downside risks are minimized by providing 10 to 20 trading signals only per year. An e-book on long term gold chart is available free to subscribers at the website.
Everyone is a novice trader at one point in their life, I hope you find this handy!
To Your Financial Success,
Chris Vermeulen
The Gold and Oil Guy
Studying these charts will help you determine the appropriate time to get cash for gold and there are tips on how to sell gold online too.
GET MY FREE WEEKLY TRADING REPORTS & ANALYSIS
|