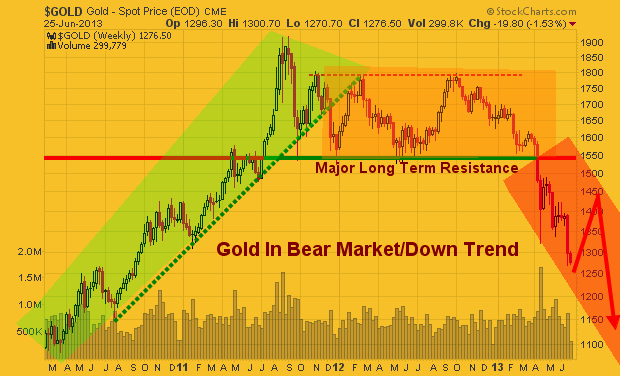
Since the start of the COVID-19 virus event, Gold has rallied more than +26% to reach highs near $2090 on August 7, 2020. Yet, over the past 15 months, Gold has been trailing downward in a sideways price pattern. This price rotation has set up a very broad Pennant/Flag formation in Gold that has recently reached the APEX of the Flag setup.

This is very important for two reasons. First, as the global central banks begin to plan and prepare for more normalized monetary policy, and address credit excesses and inflationary price concerns, the advantages of Gold as a hedging instrument become more valuable. Secondarily, after a massive rise in asset prices and an even bigger global attempt to stimulate the economy after the COVID-19 virus event, the world has never been in this scenario. Near-zero interest rates, excessive amounts of money and credit throughout the world, asset prices showing near hyper-inflation trends, and the global central banks taking very little action to address any future economic concerns.

The Luster Of Gold May Be Growing For Global Investors

The luster of Gold over the past 15 months has slightly diminished. Global central banks, corporations, and consumers jumped into the easy money rally and ignored ongoing risks. Now, China’s economic concerns and corporate debt issues continue to plague the global markets. Investors are suddenly waking up to the potential of rising global risks over the past 12+ months – not subsiding.

Recently, China’s economic and credit/debt issues have spilled over into more broad market concerns. What used to be more of a junk-rated debt issue has now transitioned into more of a global concern as China’s demand for cheap credit over the past 8+ years may have created the components of a perfect storm in the making (source: Yahoo! Finance).

I published research articles about this many months ago – which are still relevant.

After reviewing some of my earlier research posts, I urge you to consider a unique situation that may be taking place in the global markets right now. I believe the US markets have transitioned into a new Depreciation Cycle Phase (started near the end of 2019). As the US Dollar continues to try and hold above the $90~$91 level, we may be entering a foreign market economic crisis prompted by US easy money policies over the past 12+ years. If this is the case, then the US stock market and the US Dollar may continue to show strength well into a foreign market collapse – also while Gold and Silver start to move higher.

What Could Happen Next

This type of event will eventually spread into the US markets as concerns mount related to the depth and cross-border economic issues if any economic contagion event continues. Yet my thinking is that initially US assets, and the US Dollar, may rise as global traders/investors move away from global/Asian market risks and pour capital into safer US stocks and the US Dollar. This may prompt a rally phase in the US stock market and push the US Dollar above $95~96 briefly before traders realize the full scale and scope of this potential global crisis in the making.

This Daily Gold chart highlights the extended Pennant/Flag price formation and how Gold has started to see increased trading volume in what appears to be an upward price breakout. Still, Gold must break above two key levels before considering this potential rally phase confirmed: $1845 and $1920.

Gold Reaches 15-Month Flag Apex

Fibonacci Price Extensions Show $2600 As A Potential Price Target For Gold

This Weekly Gold chart highlights a longer-term Fibonacci Price Extension pattern. It suggests that $2240 and $2600 are likely to be price targets for Gold if this rally continues. Many traders believe the last 15+ months of sideways trading in Gold has formed a “handle” for a bigger “cup-n-handle” price pattern. Ideally, I would like to see a Gold rally above $1925~1940 before attempting to confirm the “cup-n-handle” pattern.

My interpretation of the global markets and Gold is just as I stated above. Gold is starting to become more interesting for global investors as the China debt/economic crisis continues. Risks are mounting if the economic contraction in China/Asia continues. Global risks are already excessive after 24+ months of extended global central bank functions, easy credit, and increasing inflation. As a result of inflation, pricing pressures will eat away at profits for many firms. Slowing consumer demand could blow a big hole in demand for many assets.

Traders should prepare for a bout of price volatility headed into the end of 2021 as these issues continue to work themselves out. My technical analysis suggests this rally may continue into early January 2022. My cycle analysis indicates a change in price trend may initiate after January 18th or so. Yet, I also believe this potential rally in Gold may be just starting, and global concerns may be festering while the US stock market rallies. This is because global traders are piling into US assets/stocks while attempting to avoid economic/debt concerns in other world areas.

Gold will continue to react to this new concern and fear as it populates in traders’ minds. The luster of Gold will likely continue to grow – which may push Gold above $1950 before the end of 2021. Time will tell.

Want To Learn More?

Follow my research and learn how I use specific tools to help me understand price cycles, set-ups, and price target levels. Over the next 12 to 24+ months, I expect large price swings in the US stock market and other asset classes across the globe. I believe the markets are starting to transition away from the continued central bank support rally phase and may form a revaluation phase as global traders attempt to identify the next significant trends. Precious Metals will likely start to act as a proper hedge as caution and concern drive traders/investors into Metals.

Please take a minute to visit www.TheTechnicalTraders.com to learn about our Total ETF Portfolio (TEP) technology, and it can help you identify and trade better sector setups. We’ve built this technology to help us identify the strongest and best trade setups in any market sector. Every day, we deliver these setups to our subscribers along with the TEP system trades. You owe it to yourself to see how simple it is to trade 30% to 40% of the time to generate incredible results.

Chris Vermeulen

 www.TheTechnicalTraders.com

Traders and investors all around the world is having trouble climbing over the wall of worry/fear with the US stock market, and rightly so. There is a lot of things taking place and unfolding that carry a high level of uncertainty. Let’s face it, who wants to invest money into the market when it’s hard to come by (high unemployment, banks are still extremely tight with their money, companies are nowhere near wanting to hiring new staff).

The hard pill to swallow is the fact that the stock market loves to rise when uncertainty is high. It’s almost doing it just to drive investor’s nuts who sold out near market bottom or recent correction. You must overcome the urge to short the market when the economy looks so bearish in the years ahead, and continue to trade with the trend.

Short Term Investing – Weekly Volatility Index Chart

Below you can see the fear index. The chart is self-explanatory showing where it should move next. But if you are not familiar with the VIX then here is definition by investopedia:

“The first VIX, introduced by the CBOE in 1993, was a weighted measure of the implied volatility of eight S&P 100 at-the-money put and call options. Ten years later, it expanded to use options based on a broader index, the S&P 500, which allows for a more accurate view of investors’ expectations on future market volatility. VIX values greater than 30 are generally associated with a large amount of volatility as a result of investor fear or uncertainty, while values below 20 generally correspond to less stressful, even complacent, times in the markets.”

VixBottom


Weekly Investing Chart of the SP500 Index

After reviewing the VIX chart above which points to stocks nearing a level of selling pressure, then review the chart below we come to a conclusion that a minor pullback of 2-5% is likely to take place in the next week ortwo.

The divergence in the Relative Strength Index is a bearish sign for the broad market. While I feel a pullback is do and needed for the market to regroup, it is important to review the seasonality chart and know that we are entering one the strongest times of the year for stocks.

SP500Divergence


SP500 Seasonality Chart

Again, using the data from the previous two charts along with this graph clearly shows that a pullback in the stocks is likely going to be bought back up by the brave investors willing to override their fear and go with the trend. For more interesting charts check out my stock chartlists: https://stockcharts.com/public/1992897

 SP-Seasonality


The Wall Of Worry Conclusion:

In short, expect the stock market to correct in the next week or two. But once we get a correction of two percent or more, be prepared for buyers to step back in and buy things up into year end.

This WALL OF WORRY is about to GET HIGHER!

Get These Reports Delivered To
You Inbox Each Week Free:
www.GoldAndOilGuy.com

Chris Vermeulen

Get My Daily Video, Intraday Updates & Trades Today!
www.TheGoldAndOilGuy.com

Chris Vermeulen

The life cycle of most things not matter what it is (living, product, service, ideas etc…) go through four stages and the stock market is no different. Those who recently gave in and bought gold, silver, mining stocks, coins will be enter this stage of the market in complete denial. They still think this is a pullback and a recover should be just around the corner.

Well the good news is a recovery bounce should be nearing, but if technical analysis, market sentiment and the stages theory are correct then a bounce is all it will be followed by years of lower prices and dormancy.

I really do hate to be a mega bear or mega bull on anything long term but the charts have painted a clear picture this year for precious metals and I want to share what I see. Take a look at the chart below which shows a typical investment life cycle using the four stage theory.

The Four Stages Theory

Classic economic theory dissects the economic cycle into four distinct stages: Accumulation, Markup, Distribution, and Decline.  Stock, index or commodities are no different, and proceeds through the following cycle:

  • Stage 1 – Accumulation: After a period of decline a stock consolidates at a contracted price range as buyers step into the market and fight for control over the exhausted sellers.  Price action is neutral as sellers exit their positions and buyers begin to accumulate.
  • Stage 2 – Markup: Upon gaining control of price movement buyers overwhelm sellers and a stock enters a period of higher highs and higher lows.  A bull market begins and the path of least resistance is higher.  Traders should aggressively trade the long side, taking advantage of any pullback or dips in stock price.
  • Stage 3 – Distribution: After a prolonged increase in share price the buyers now become exhausted and the sellers again move in.  This period of consolidation and distribution produces neutral price action and precedes a decline in stock price.
  • Stage 4 – Decline: When the lows of Stage 3 are breached a stock enters a decline as sellers overwhelm buyers.  A pattern of lower highs and lower lows emerges as a stock enters a bear market.  A well-positioned trader would be aggressively trading the short side, taking advantage of the often quick decline in share price.

Stages1


Gold Price Weekly Chart – Stages Overlaid

gold11


Silver Price Weekly Chart – Stages Overlaid

silver11


Gold Mining Stocks – Monthly Chart

This chart is a longer term picture using the monthly chart. I wanted to show you the 2008 panic selling washout bottom in miners which I think is about to happen again. While physical gold and silver are in a bear market and should be some a long time, gold mining stocks will likely find support and possibly have a strong rally in the coming months.

Many gold stocks pay high dividends and are wanted by large institutions and funds. The lower prices go the higher the yield is making them more attractive. So I figure gold miners will bottom before physical metals do. A bounce is nearing but at this point selling pressure and momentum continue to plague the entire PM sector.

gdx11


Precious Metals Investing Conclusion:

In short, I feel with Quantitative Easing (QE) likely to be trimmed back later this year, and with economic numbers slowly improving along with solid corporate earnings the need or panic to buy gold or silver is diminishing around the globe.

While there are still major issues and concerns internationally they do not seem to have any affect on precious metals this year. Long terms trends like the weekly and monthly charts shown in this report tends to lead news/growth/lack of growth by several months. So lower precious metals prices may be telling us something very positive.

The precious metals sector is likely to put in a strong bounce this summer but after sellers will likely regain control to pull prices much lower yet.

Get My Daily Analysis and Trade Alerts: www.TheGoldAndOilGuy.com

Chris Vermeulen

I have previously written Fed/POMO and I have to do mention it again.  Yesterday morning I mentioned that if this trend is to remain up big money needs to be stepping into the market to lift stocks and save the trend. Luckily for the market and Ben Bernanke, there was a huge POMO day scheduled for yesterday where the Fed could buy up to $3,500,000,000 of securities.

POMO

That massive QE buying pressure (POMO – Permanent Open Market Operations) I’m sure helped lift the market. Look at my simple yet effective technical traders analysis chart of SP500 Futures below.

Friday

The Fed’s massive securities purchases likely helped to trigger a strong short-covering push into the closing bell.  Remember, the prior day the indices had been hammered as short sellers drove the markets lower. When the shorts are forced to cover their positions, they do so by buying.  When strong enough, this produces strong waves of buying.

Remember not to be bias in your outlook on the market, but follow the trend, money and momentum and you should be on the correct side of the market more times than not.

Chris Vermeulen
www.TheGoldAndOilGuy.com

Over the past couple week’s investors and traders have been growing increasingly bearish for the US stock market. While I too also feel this rally is getting long in the teeth there is no reason to exit long positions and start shorting.

My followers know I do not pick tops and I do not pick bottoms. This I explained in great detail in my previous report. There are more cons to that tactic and on several different levels (timing, volatility, emotions, lack of experience, addiction) than there are pro’s.

Keeping things simple, short and to the point here is my thinking for today and this week on the broad market. Remember my analysis is 100% technical based using price, volume, cycles, volatility, momentum and sentiment. I try not to let any emotions, gut feel, or bias flow into my projections. I say “TRY” because I am only human and at times when the market and emotions are flying high they still take control of me but that is few and far between.

So let’s get to the charts shall we!

SP500 Index Trading Daily Chart – SPY Exchange Traded Fund

The SP500 index continues to hold up within its rising trend channel and the recent pullback is bullish. Remember the trend is your friend and it can continue for very long periods of times ranging from days, weeks, and even months…

SP500Uptrend


The US Stock Market MUSCLE Indexes

The charts below show and explain my thinking… But in short we need these two indexes to be strong if we want to see another major leg higher in the SPY, or to at least test the recent highs.

Today the market opened slightly higher and push up in the first 30 minutes with strong volume. Overall the market looks as though it needs a day pause/pullback before taking another run higher.

Small cap stocks are the ULTIMATE Risk On play and generate ridiculous gains in very short periods of time. I focus on these with my trading partner exclusively at ActiveTradingPartners.com where we have been making a killing on trades like: NUGT up 21% in 1 day and IOC up 11% in 2 days
USLeaders


Bullish Index Price, Volume & Candles

The SP500 has been very predictable the past couple weeks for both intraday trading during key reversal times in the market when price has pullback to a support zone, and also for swing trading. Last week we myself and followers bought SSO ETF when the market pulled back and we exited the next day for a 3.5% profit.

Yesterday was a perfect intraday example with the SP500 bottoming out at my 11:30am morning reversal time zone with price trading at support. Price then rallied into the close posting a 12 point gain on the SP500 futures for a simple momentum play pocketing $600.

1130


US Stock Market Mid-Week Conclusion:

In short, I still like stocks as the place to be and will not get bearish until proven wrong. Once price reverses and the technical clearly paint a bearish picture with price, volume, momentum, cycles and sentiment will I start shorting the bounces.

This week is a pivotal one for the stock market so expect increased volatility and possibly lower lows still until the counter-trend flushes the weak position out before moving higher.

If you like my simple, clean and profitable market analysis join my NEWSLETTER: www.thegoldandoilguy.com/signup.php

Chris Vermeulen

Timing stock market tops and bottoms is risky business and we all know the more the more risk we take the more potential gain would could also made. Correctly timing a top or bottom for any investment is flat out exciting not to mention financially rewarding. But this high risk trading tactic does come with some major issues which you must FULLY understand so that you can protect your capital and self-confidence.

On May 13th I wrote a special report on how to spot market tops just before they happen and how to do it with a very high probability of success. I also explain the major pit falls to be aware of so you stay on the right side of the market.

I recommend you read this special report now: http://www.thegoldandoilguy.com/how-to-spot-time-stock-market-tops/

That special report truly showed you what was going to happen a few weeks before it did. Much like how this report shows you what is likely to happen in June.

Looking at the market with my YOU ARE HERE type of using cycles, volume, price patterns and momentum to forecast what is likely to unfold in the coming weeks. Depending on the time frame used for my analysis I can figure out with a high probability where price will be in a few minutes, hours or days also.

Mall Market Directory – You Are Here

Stock market tops are tough to trade and time. That is because there are so many things happening in the media and emotions running wild that it’s tough to get a grasp on what you should really be focusing on to keep a level head trade around it.

Market tops are typically not an event but rather a progression that takes much longer than most individuals expect. I still find myself jumping the gun at times and I know this and have been through this process hundreds of times in various investments. The human brain is a powerful tool but emotions can force you to override your rules/strategy still.

U-R-Hear

Stop Fighting! – Bulls & Bears are BOTH Correct at this Stage

It does not matter where you go to get your stock market news and reports… Everyone is arguing their bullish or bearish case more than EVERY. There is a reason for this and it’s because the SP500, DJIA, RUT and NASDAQ appear to be entering a cycle top. What does this mean? It means the uptrend is almost over from a technical analyst point of view, and those who are have been bearish for a long time feel the market topping out more now than ever in their gut that this is the top.

Keeping it simple removing news, economic data, emotions and biases we are left with one thing which is technical analysis. This is based on price alone and that is important to remember because the only thing that pays you money for an investment is when price moves in your favor. Believe it or not price only has blips on the charts here and there which is based off news, economic data etc… In the big picture stock prices tend to lead economic data by several months and in some cases years.

So the big question is this… If price action is the only thing that pays you when trading why bother worrying about all the other opinions, news out there. That stuff only adds to the confusion and in most cases gets you on the wrong side of the market.

Timing the Market Top Conclusion:

In short, from a technical point of view the SP500 remains in an uptrend. But according to technical analysis the upside momentum is starting to slow. If we get a few more down days then the trend will flip and be down but it has not yet happened.

When the trend does reverse down you must remember that 80% of the time price will bounce back up to test near the recent highs before truly rolling over and collapsing. Think of it like a zombie movie. Just when you think you killed one it comes back to life for one last scare before its dead.

Just to touch on stock market bottoms so you do not get confused. Stock market bottoms are little different than tops so they are traded differently. I will cover them when the time comes.

Trading the market is not easy during this type of condition, which is why members and myself got long SSO on the 23rd and two days later sold out for a 3.5% gain. I am now looking to reload this week for another bounce/rally play but only time will tell if we get another setup.

Download my FREE eBook on Controlling Your Trades, Money & Emotions: http://www.thegoldandoilguy.com/trade-money-emotions.php

Chris Vermeulen

Many investors and traders make the same mistakes assuming that one needs a complex trading system to consistently profit from the stock market. On the contrary, some of the top performing strategies are the ones with the least amount of moving parts and are simple. Because their simplicity they can be easily and consistently followed.

The methodologies we use for timing the market, picking stocks and option trades are very simple because we focus mainly on price, volume and momentum. These three indicators are the key to success. When these are used together you are able time your entries and exits during key turning points, clearly define risk and reward levels while maintaining a clear unbiased state of mind which allows one to trade almost emotionless.

As my Trading System Mastery coach (Brian McAboy) taught me, if you do not have a detailed trading plan which a five year old could trade, then you do not have a solid strategy and will have unnecessary losses and emotional stress.

So here are a couple tips to keep things simple and emotionless:

slide1


sLide2


Our recent trade in Infoblox Inc. (BLOX) with our ActiveTradingPartners Newsletter:
This stock was flashing several signals (price, volume and momentum) that a bounce or rally was likely going to happen within a few weeks. This is a good example of a swing trade based purely on our main indicators.

BLOX


Our Broad Market Outlook:

Current stock market prices are starting to warn us that a market correction is near. You can read more about this in detail in our last report “Stocks Preparing for a Pullback, Buy Bas News, Sell the Good”.

We all know the market works with the saying:
“If the market doesn’t shake you out, it will wait you out”.

How does this work? Simple really, during down trends and just before a market bottom we tend to see capitulation spikes in selling. These scare the last of the long positions out of the market and suck in the greedy shorts after the move has already been made.

During an uptrend which is what we are in now the market makes spike highs designed to scare out the shorts and get greedy long traders to buy more. Once again after the move has already been made and likely near the market top.

If you are the type of trader who always tries to pick tops and bottoms against the current trend then you may like to know this little tip… The largest percent moves typically happen during the last 75% of the trend. What does this mean? It means when you take your position against the trend trying to pick the dead top or bottom you are most likely going to get be caught on the wrong side of the market in a big way.

Most traders I know based on recent emails have been short the market for 1-3 weeks and many keep emailing me that they are adding more shorts each day because they feel the market is going to top. So me being a contrarian by nature in terms of what the masses are doing, if everyone is still holding on to their shorts we likely have not seen the top just yet. Another 1-2% jump from here should be enough to shake them out though…

If you like this article join my free newsletter to receive more timely trading insight at: www.TheGoldAndOilGuy.com

Chris Vermeulen

The SP500 remains in a strong uptrend, but the index has posted a sizable gains for 2013 thus far so it’s only logical that a pullback within this bull market takes place sooner than later.

With May now upon us and historically prices fall more times than not I feel a 3-4 weeks correction is on the verge of starting. This Friday we just had very strong economic numbers confirming the economy is recovering. This news has sent stocks sharply higher as shorts cover their positions and investors who are not yet long get into position to profit from higher prices. But the herd psychology and their trades are typically incorrect as they invest based on fear and greed. The old saying is buy on negative news and sell on positive news will typically get you on the correct side of the market more times than not if used with price, volume and cycles.

The Technical Traders – SP500 Index Weekly Chart

If we look at the price of the SP500 we need it to breakdown below the recent pivot low before I become bearish.

Volume which is not shown on this chart is below average as price moves higher and this is a bearish sign also.

Looking at a basic cycle using the stochastics indicator we can see that the current cycle is starting to turn down. Cycles tend to lead price during an uptrend so we could still have stocks move higher for another week or so but be aware that when price starts to drop its likely a market top. But until then you must respect the uptrend. Stocks can remain overbought and toppy looking for months… so done be gambling and trying to pick a top until we see breakdown start.

spy2


SP500 Stocks Trading Above 200 Moving Average – The Technical Traders View

Stocks trading above the 200 day moving average is a great indicator for helping spot broad market underlying strength/weakness. It does lag the market but is still very powerful. The chart below shows this info and my thinking of what is likely to unfold sooner than later though price may still rise for several days yet.

I also use a similar chart for timing swing trades and market tops which are based on stocks trading above the 20 day moving average. This chart is not shown here but is now trading at a level which generally triggers selling/market top.

spy1


Stock Market and SP500 Trading and Investing Conclusion:

In short, I am still bullish on the market as I focus on trading with the trend. I do not pick market tops and I do not pick market bottoms. Knowing that stocks make their biggest moves at the end of their uptrend and at the end of a down trend it’s only common sense that risk is extremely high if you are betting against the current trend.

The best thing to do is wait for a technical breakdown and reversal which puts the odds more in your favor with much less risk and typically a clear line in the sand to exit the position if you are incorrect.

The last major stock market top which formed in September of last year had a series of strong news and strong price action persuading the herd to buy stocks. Instead it was the last impulse wave up just before a strong correction took place. That is much like what we see now with the economic news.

Join my free newsletter and stay on right side of the market while reducing your trading/investing stress. My simple yet effective analysis walks you through the market each week without bias. Remember Price and Volume is what makes you money trading NOT news or forecasts.

Join My Newsletter Free Today: http://www.thegoldandoilguy.com/trade-money-emotions.php

Chris Vermeulen

Trading with the trend should be your main focus for long term success no matter what type of trader you are (Options Trader, Stock Trader, or ETF Trader) although it’s not as easy as it sounds.

The good news is that there is a simple trading model that removes 95% of trading analysis and greatly reduces trading related emotions because the key technical analysis rules based on one of the world’s best chart technicians (John Murphy) technical analysis methods have been applied to the chart automatically. The key is to identify the trend of the market. Once that is known you can focus on trading strategies that take advantage of the current trend.

Over the past few years I have been creating this indicator/chart layout tool which converts my chart reading experience, tips and tricks into a simple system removing analysis paralysis which cause most individuals to second guess what they see and don’t pull the trigger. Using too many indicators or read/listening several other traders commentaries with different views than you causes this paralysis.

My simple red light, green light model clearly shows a viewer the current trend and expected price range (high and low) looking forward a couple days. I uses a series of data points like volatility, volume, cycles, momentum, chart patterns and logic rules. It even shows extreme pivot points helping you find low risk entry prices for both bull and bear market conditions.

Recent trends and signals for the SP500 Index Daily Chart:

SPY1

Trading With the Trend – The Sweet Spots

Knowing the direction of the market is simple using the chart system above but trading with the trend is not that simple because of natural human behavior. Instead traders fall victim to trying to pick a top or bottom because they think the price is overbought or oversold and they want to catch the next big trend change.

We all know the saying “the market climbs a wall of worry”. Well, the biggest worry most traders have is buying long in a bull market because stocks and price always look overbought and ready to top each week… This leads to people trying to get fancy picking a top only to get their head handed to them a few days or weeks later depending on how stubborn they are to exit a losing position.

The key to long term success is to buy during broad market (SP500) corrections once sentiment, cycles and momentum are starting to flash extreme oversold conditions. These show up as green arrows on the trend chart. At that point most sectors and high beta stocks like IBM, GOOG etc… should be at a key entry points with most of the downside risk removed already. Remember ¾ stocks follow the broad market so it only makes sense to follow it also.

What about a runaway stock market? This is when the stock market does not pullback but just keep grinding its way higher and higher… The only thing you can do is sit in cash, or look for a stock or sector that is having a small pause or pullback and get long with a small position until you get that broad market pullback and major by signal to add more.

Below are a few sectors showing a minor pause/pullback within this bull market.

XLP

XLI XLU XLF


Mid-Week Trend Conclusion:

Overall, the broad market remains in an uptrend. While I would like to see the SP500 pullback and give us another major buy signal like it did in December and February I do mind that much if prices keep running higher as it just give us more cushion and potential profits for when the trend does eventually roll over and flip signals. I hope you found this report interesting. It’s just scratching the surface of this topic but it’s a start.

Know the stock market trends by joining my free newsletter: www.GoldAndOilGuy.com

Chris Vermeulen