In their latest announcement, the FED attempted to prop up the stock market. They attempted to sound hawkish, however, the market paid not any heed to it.  The FED annulment was reflected in a manner that lead the way to the dollar tanking and precious metals rising. Silver has industrial uses as well as monetary ones, which will come to the forefront as the gold bull market progresses.

“The Fed has had numerous opportunities to normalize rates over the past two years and have squandered them all,” said Peter Hug, global trading director at Kitco Metals Inc. in an emailed note after the FED statement, reports Market Watch.

Although a few analysts believe that the FED has kept hopes alive for a September 2016 rate hike, the market does NOT believe so. The FED funds futures points to a status quota the next meeting, as a majority (88%) of traders believe that the FED will NOT move in the next meeting of September 2016.

In my opinion, the judgment of FED members notwithstanding, what choice do they have but to leave the possibility of a rate hike on the table?  They would look like total buffoons, if they reversed course now. This sudden spike in the price of silver has definitely caught a lot of analysts off guard.  I am suggesting that the fact that the FED is now less likely to raise rates after the Brexit and the fact that the dollar has been slipping a bit lately are the primary reasons for silver’s rise

The dollar bulls, who were optimistic on the FED had pushed prices above the 97 levels, however, after the FED’s decision, prices tanked and rightly so.

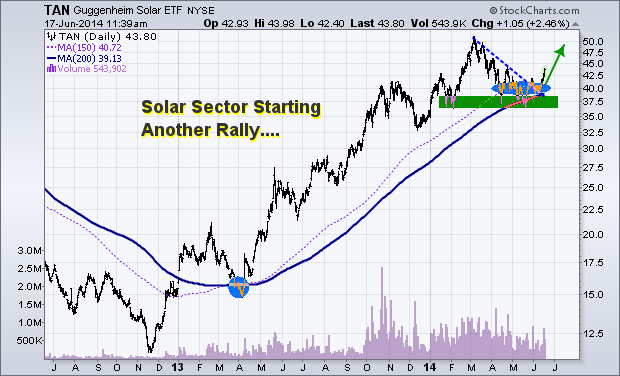
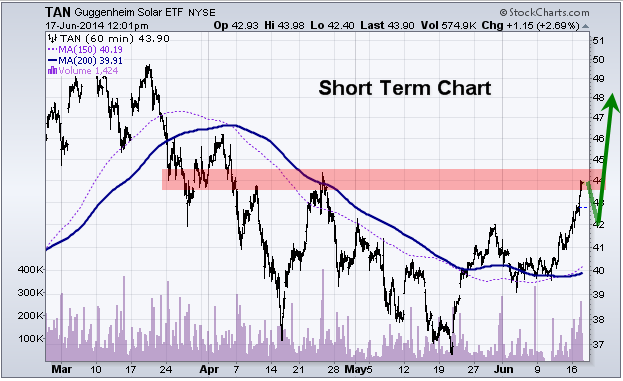
Another reason for an increase in silver prices is the surge in demand due its “industrial” application. “Silver has (more room to run) because silver is increasingly used in solar panels now. Something like 10 percent of demand comes from solar panels. Solar panels are a growing source of demand for silver, so you have got an additional attraction for silver as well, as a commodity investment and also industrial usage,” Jeremy Wrathall, mining team leader at Investec, told  CNBC on Monday, July 4th.,2016

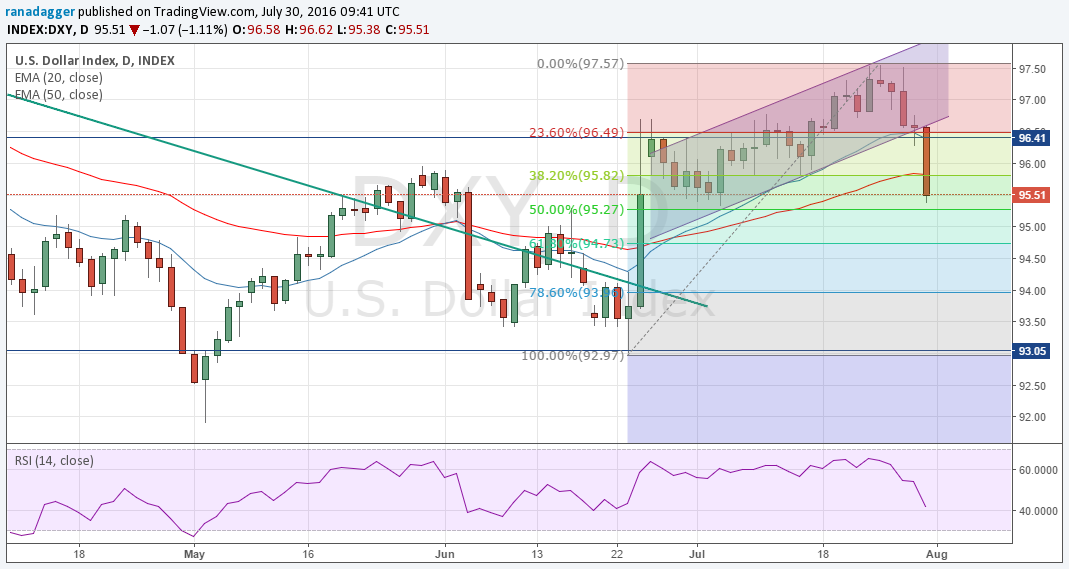
The chart of the dollar index shows that for more than a month, it has remained in an uptrending channel. However, recently the dollar broke down the channel, signifying that the traders do not buy the hawkish derrick.

The break of the channel has a target of close to 95.2, which also coincides with the 50% retracement of the total rise from the lows of 93. However, if the dollar continues to tumble, it has a small support at 94.7 levels, post which, it will retrace the complete move.

si1

The fall in the dollar will reflect in the rise of silver. I believe that silver is on the cusp of a rally and hence, we shall concentrate on the silver charts.

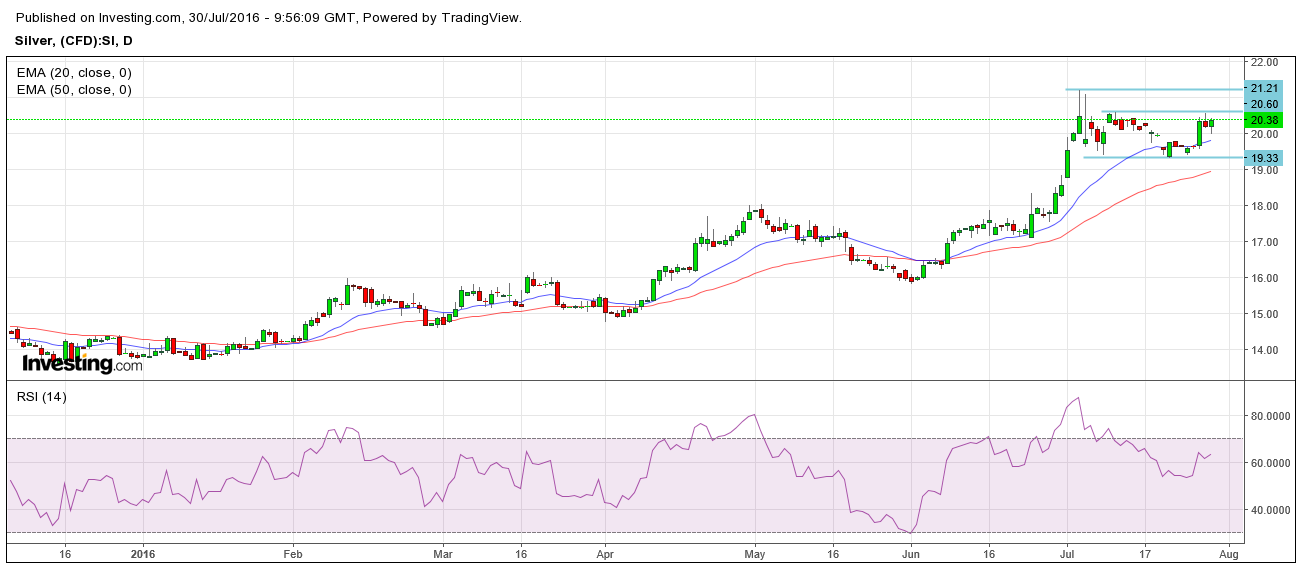
The silver bulls have seen a stupendous run from the lows of around $13.73 during the start of the year to the highs of $21.2 in early July 2016. However, I believe that the bull run in silver will continue after a small consolidation.

The chart of silver shows that it is consolidating in a range of 19.3 on the lower side and 21.2 on the higher side. If silver manages to break above the range, its pattern target is 23. However, I believe that silver will scale the level of 23 and thereafter, reach the levels of 26 by the end of this year.

si2

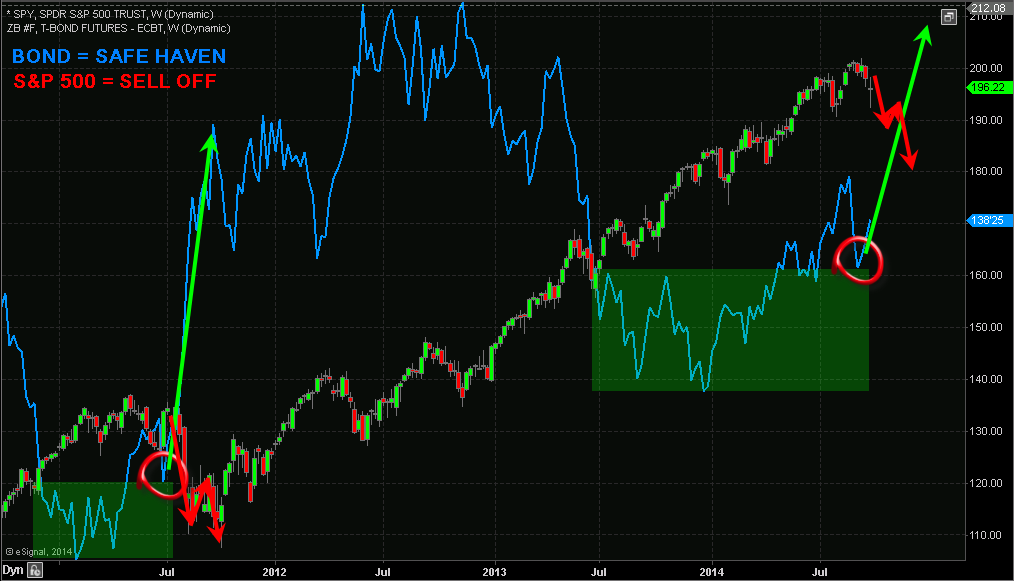
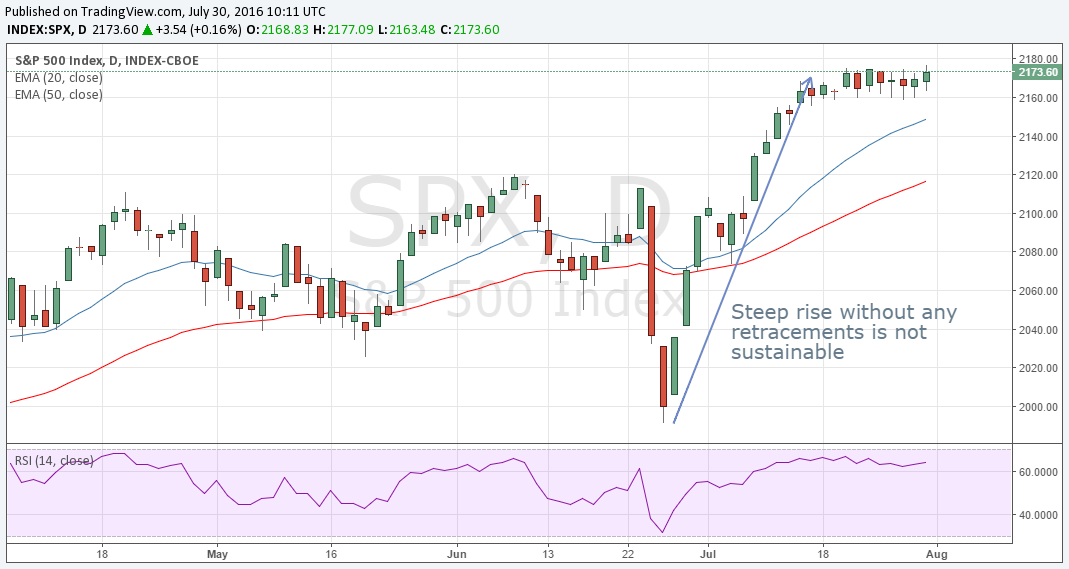
Historically, August has been a rough month for stock investors. In the last 20 years, the stock market’s performance has been down -1.3% in August, according too Bespoke.

I would expect August to be mediocre or weak,” said Don Townswick, director of equities at Conning.

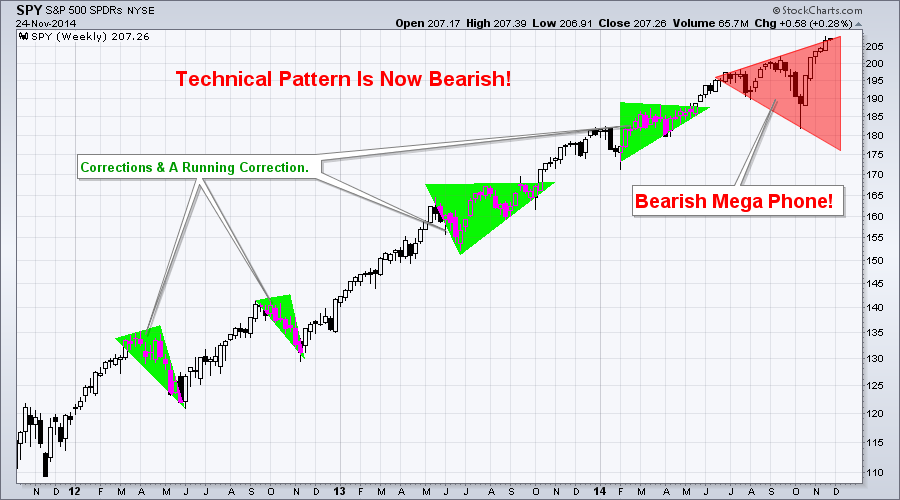
Similarly, David Kostin, Chief equity strategist at Goldman Sachs is bearish on the markets. The current price-to-earnings (P/E) ratio expansion cycle has reached the third largest, ever, in history.

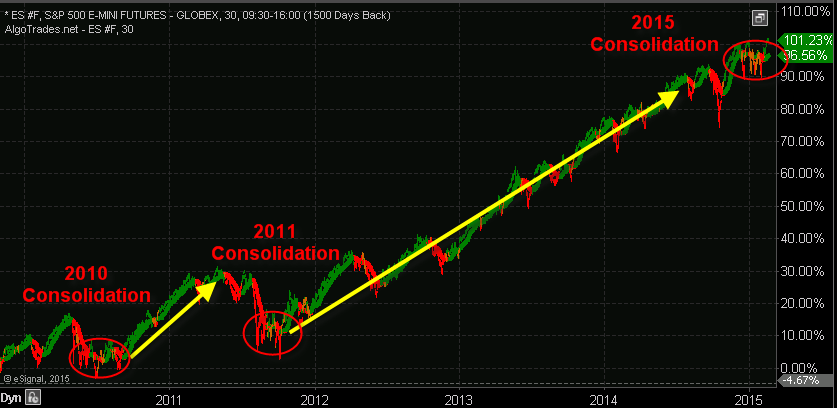
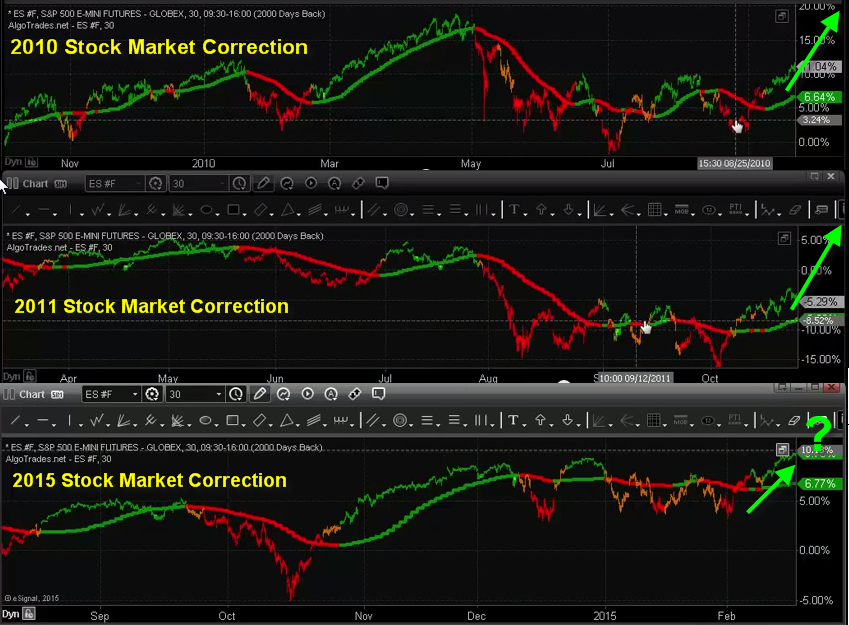
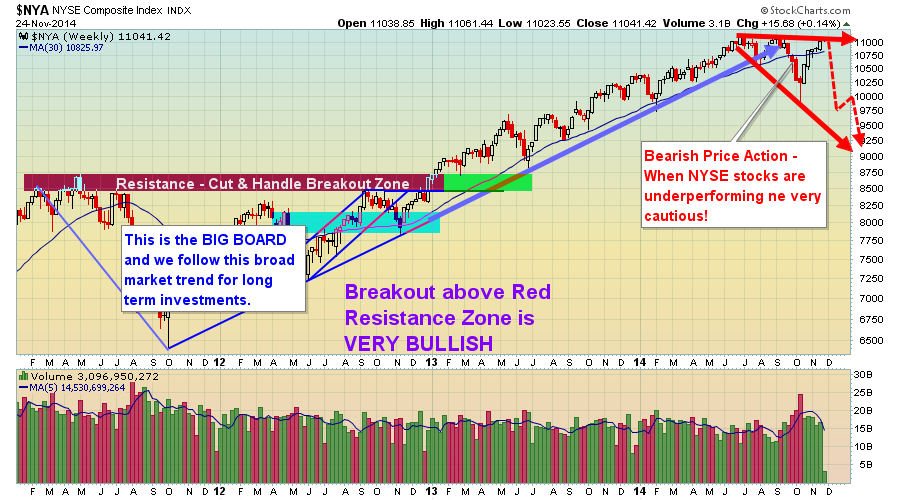
Consider that the current rise in stocks has come on the back of poor earnings, dismal growth and huge financial risks on the horizon. The crash is imminent, and I believe that the fall this August 2016 and September 2016 will sow the seeds for the larger decline, that I have been talking about.

I expect the equity markets to follow their negative record of August and September and I believe that the decline, which will be moderate in the beginning will end with a sharp slide.

si3


Conclusion

I believe that as “The Global Financial Reset” of the ‘monetary system’ begins, there will be an increase in the demand for silver relative to the increase in the demand for gold. Gold is an ‘Establishment’ metal relative to silver. There are no Central Bank that are ‘hoarders’ of silver, anywhere or anymore. There is no one in the ‘Establishment’ who considers silver, as money, as of yet!

History is going to repeat itself in August and we will see a sharp fall in the months of August 2016 and September 2016. The traders are accepting that the FED will not raise rates anymore this year and they are placing their bets accordingly.

Our short call on the dollar was timed to perfection, and I believe that the short call we give on the stock market will also produce similar results. Get ready for more such profitable trades in the following months.

Get my analysis and trades at: www.TheGoldAndOilGuy.com

Chris Vermeulen

Protecting Yourself with GOLD, Oil and Index ETF’s

Chris-VIn 2009 I shared my big picture analysis, investment forecast and strategy in a book called “NEW WORLD ORDER ECONOMICS – What you can do to protect yourself”.  In January 2009 I forecasted that the Dow Jones Industrial Average was going to make a bottom within a couple months which it did. I also predicted the price of gold to start another major rally, and for crude oil to bottom and rally for years, which were also correct.

You can call it luck, skill or a mix of both… but the truth is that the markets cannot be predicted with 100% certainty. With that said, the US stock market, gold and oil look to be setting up for their NEXT BIG multiyear moves.


GOLD BEAR MARKET IS ABOUT TO END

Gold and silver have a little trickier of a situation to navigate and invest for maximum returns over the next 2+ years.

The most important thing to realize is that when a full blown bear market starts virtually all stocks and commodities drop including gold, silver and oil. Knowing that, investors must be aware that when the stock market starts its bear market the fear will rise and investors will inevitably sell their holdings and this means we could see gold and oil continue to fall much further from these levels before a true bottom is in place.

Is this time different than the 2008/09 bear market? Yes, this time we have possible wars starting, oil pipelines overseas being cut off, counties and currencies failing and even negative bond yields in some parts of the world – it’s a mess to say the least. There are a lot of things unfolding, most seem to be negative for the economy.

The currency problems and possible war breakout will be bullish for gold and oil. So if a bear market starts in equities, and a war or currency fails gold and oil should rally while stocks fall.

But if we don’t have those sever crisis’ then if gold and oil break below their critical support level which is the red line on the charts and a bear market in stocks start you do not want to be long stocks or commodities.

I have drawn a line in the sand for gold at $1050. If this level is broken then $815 per/ounce is not out of the question. It seems everyone is bullish on precious metals and have been buying like crazy. But as I wrote in 2009 this bullish sentiment actually pointing to much lower prices if support is broken.

gold etf newsletter

LISTEN TO LIVE FORECAST OF GOLD & OIL

howegold
Click Here


Below are some ETFs that can be used to take advantage of rising gold prices. While there are other funds that cover gold miners I feel they may not perform well during the equities bear market. Investing in physical gold is the best play at this stage of the game but when the equities bear market looks to be nearing an end, gold mining stocks will be the best place to be.

gold etf fund alerts


PART 2 CONCLUSION:

In this article we talked about gold and gold stocks which are showing signs of a major bottom being put in place this year. And in the next article PART 3 I will who you what to expect long term for crude oil, how we are up 28% in our short oil trade, and how you can play this multi-year cycle bottom when the time is right.

In the meantime, be sure to join my Free Newsletter so that you receive PART 3 along with more trade ideas: www.GoldAndOilGuy.com

Chris Vermeulen

Seasoned investors understand that investments which are rocketing to new highs and all over the news will eventually fall out of favor and become a the poor performer, unwanted by market participants.

So it only makes sense that the underperforming investments will some day come back to life and provide opportunity once again. I covered this unique stage analysis in great detail in another report linked below.

If you want to see my forecast and charts I did on June 26th, 2013 pointing to the key investment levels for precious metals and miners which by the way have been dead READ HERE.

Current Stock Market & Commodity Investment Analysis

Two of the weakest investments have been commodities and precious metals since 2011. The Canadian stock market is heavily weighted with these resource stocks and is the reason for its under performance when compared to the SP500.

The time will come when commodities bottom and this will send the Canadian stock market back to the 2014 highs or better.

Take a look at the chart below. You will see the SP500, gold miner index, Canadian market, and the commodity index. What you notice see is that the US stock market has been the hot investment of choice, while commodities and precious metals have been falling for years.

No one is excited about investing in commodities or precious metals, and it makes sense. Anyone holding these investments has had a terrible couple of years and lost most of their capital. The last thing they want to do is buy more.

The good news is that this mind set eventually creates huge opportunities for the savvy, patient, investor like you and I. The hardest part is waiting for the psychology of investors to be completely out of favor, and only then can an investment bottom. This often takes years, and it has been for resources.

Gold Trading Newsletter

The 2007-2008 Resource Double Top and Drop & Gold Forecast

Bull market tops take months 6-12 months to form before price truly rolls over and starts a bear market. Most traders and investor try to pick tops but because this process is so painfully long, most get shaken out or give up well before the top has completed it’s topping phase.

What I am interested in is the Canadian index and resource type plays. The US stock market looks and feels as though it’s trying to form a topping phase but it is at best 6-12 months away from being a confirmed bear market.

Until then, I feel the US stock market will struggle and the focus should be put on investments that come to life during this stage of the stock market and economic life cycle.

Precious Metals Trading Newsletter

The Dead Always Come Back To Life for One More Rally

In short, I feel resources and the Canadian stock market will become strong areas of the market going forward several months. There are a few ways to play this, and timing will be crucial. My gold forecast I gave to subscribers today for short term trading looks like it could be a 25% mover.

You can follow my coattails as I trade at www.TheGoldAndOilGuy.com

Chris Vermeulen

US Stock Market On The Verge Of Exciting Times

The S&P 500 stock market has been under strong rotation since mid-2014. Rotation in the stock market is when the trend changes direction from an uptrend to a downtrend or vice versa. But the really exciting part is that after strong rotations in the market similar to what we are experiencing now, the stock market always makes massive moves to profit from shortly after.

algorithmic trading system

Depending how the price moves during market rotations individual traders, CTAs, hendgefunds and even algorithmic trading systems can generate large profits. But price action must be favorable to meet every ones risk/reward rules.

Unfortunately during the second half of 2014 the stock market rotation moved in a way that did not generate many trades. But no trades are better than losing trades so it’s not the end of the world, and the good news is there will always be more trades.

But what I want to show you here is how the current price action of the stock market we are experiencing is identical to what we saw in 2010 and again in 2011. Also keep in mind that if equities are going to have a another big move it will generate other opportunities in precious metals, energy sector, and commodities. ETF’s are what I use to take advantage of these large moves with my ETF trading newsletter.

Algorithmic Trading System

2015 is going to be a BIG year for traders
and algorithmic trading systems!

These consolidations (pauses) in the stock market have led to substantial rallies in the stock market of 30+% gains over a six-month period and its looks like it will happen again.

My algorithmic trading system has struggled during the strong rotation of recent but so have most CTA’s and other money managers. There is not doubt that it has been hard to profit with these swings in the market because of how they formed.

When this phase of the market completes and a new trend emerges traders and algorithmic trading systems will excel and be highly active again just like they were in the first half of 2014.

Watch the video to learn more…

Visit Chris Vermeulen’s Websites to Learn more:
www.AlgoTrades.net
www.GoldAndOilGuy.com 

Since July of 2014 the big cap stocks have continued to make new highs as investors dump more and more money into the stock market. Overall bullishness on the stock market is now at extremely high levels which typically happen before a major stock market correction and sometimes start a full blown bear market.

While the average investor continues to become more and more bullish, the market breadth/health has been rapidly deteriorating. Unless you are market savvy you would not know how weak the market actually is and this always leads to strong losses and drawdowns for the uninformed investor.

What we know and most do not about this rising market, is that the big cap stocks in the SP500 index appear to be holding the overall market up and masking the weakness. So as investors become more bullish at these lofty levels putting more money into generic funds that push the SP500 higher, we see strong selling and unwinding of the more leveraged position like small cap stocks.

Over the past couple years the SP500 has formed a series of bullish corrections and running corrections. But the current formation is that of a bearish mega phone pattern and these typically point to lower prices.

SP500 BIG CAP STOCKS:

spy1


THE BOLD STOCKS:

I have always liked to follow the NYSE index because its a basket of 1900 stocks with 1500 of them being U.S companies. Its breadth/strength makes it a much better indicator of the market performance than the more narrow indexes with less stocks.

While this index remains in a bull market, it only looks as though it’s a few months away from a possible reversal and confirmation of a new bear market.

nyse


THE UGLY:

If you have ever read Stan Weinstein’s book then you know he followed GM share price closely. He believed that what GM did, the stock market would follow, to some extent. GM was/is an early leader of the US economy and stock prices in general.

The chart below paints a clear picture of the Stage 1 Accumulation in 2011- 2012, and also of the Stage 3 Distribution phase in 2013 – 2014. GM shares have traded down literally from the first week of the year and have now broken below critical support. Things could get interesting…

GM1


MY TRADING CONCLUSION:

In short, I remain bullish on the stock market with both my short term and investing outlook but I am very cautious and have closed out several large positions recently. Cash is king and I plan to protect, rather than invest my nest egg when risk is higher than normal.

Short term trading where trades only last 3-10 days is the way to go at this stage of the game. Some recent winning ETF trades with my ETF newsletter www.TheGoldAndOilGuy.com have been in SCO, a quick bounce trade in UCO, REM, and our current trade as of last week EEM.

The majority of my investment capital is traded with my automated trading system. It trades the S&P500 index directly in my brokerage account catching these 3-10 day swings in the market saving me time while reducing my emotional attachment to the market.

blackfriday1

Chris Vermeulen

If you have been paying close attention to the stock market, market internals/breadth, and bonds for the past three months, you’ve likely come to the same conclusion that I have.

The US stock market is showing signs of severe weakness with the market breadth and leading indicators pointing to a sharp correction for stock prices.

With fewer stocks trading above their 50 and 200 day moving averages each week, while the broad market S&P 500 index continues to rising, this bearish divergence is a red flag for long term investors.

When a handful of large-cap stocks are the only things propelling the stock market higher while the majority of small-cap stocks are falling you should keep new position sizes smaller than normal and start moving your protective stops up to lock in gains/reduce losses in case the market rolls over sooner than later.

Small cap stocks are typically a leading indicator of the broad market. The Russell 2000 index is what investors should keep a close eye on because it’s the index of small-cap stocks. Since March of this year, the Russell 2000 been trading sideways and actually making new lows. This tells us that big-money speculative traders are rotating out of the stock market and into other investments like high dividend paying stocks, blue chips, and likely bonds.

Looking at the chart below I have overlaid the S&P 500 index and the price of bonds. History has a way of repeating itself; although it may never feel the same and the economy may be different, price action of investments have the tendency to repeat.

In 2011 we saw the stock market and bonds form specific patterns. These patterns clearly show that money was rotating out of the stock market and into bonds. During times of uncertainty in the stocks market money has the tendency to move into bonds, as they are known as a safe haven. Bonds tend to reverse before the stock market does, so if you have never tracked the price chart of bonds before, then you should start.

SPXvsBONDS

From late 2013 until now bonds and the stock market have repeated the same price patterns from 2011. If history is going to repeat itself, which the technical and statistical analysis is also favoring, we should see the stock market correct 18% to 30% in the near future. If this happens bonds will rally to new highs.

It’s important to realize the chart above is weekly. Each candle represents five trading days, and four candles represents one month. So while this chart points to an imminent selloff from a visual standpoint, keep in mind this could take 2 to 3 months to unfold or longer. The market always has a way of dragging things out. If the market can’t shake you out, it will wait you out.

So if you are short the market or planning to short the market be very cautious as it could be choppy for the next several weeks and possibly months before price truly breaks down and we see price freefall.

To get my pre-market video analysis each day, and trade alerts visit: www.TheGoldAndOilGuy.com

Chris Vermeulen

The energy sector has surged during the last two months which can be seen by looking at the XLE Energy Select Sector Fund. If crude oil continues to climb to the $112 level, XLE will likely continue to rally for another few days or possibly week as energy stocks are considered a leveraged way to play energy price movements.

Another way to look at this info is through the USO United States Oil Fund. This tracks much closer to the price of oil. The only issue is that many ETFs that “try to track” an underlying commodity is in how the funds are built. They own multiple contracts further into the future which does not exactly provide us with the short term news/event driven price movements in the current front month contract as they should.

What does this mumbo jumbo mean? Well, it means funds like USO and the highly respected UNG, and VIX ETFs… (just joking about the highly respected part), fail to track the underlying commodity or index very well when it comes to short term price movements. This means, you can nail the timing of a trade, and the commodity or index will move in your favor, yet your fund loses money, or goes nowhere…

Let’s Focus on the Technicals Now…

WTI crude oil has formed a bullish ascending triangle pattern from March to May of this year. The breakout to the upside is bullish and should be traded that way until the chart says otherwise. This breakout and first pullback must hold, or I will consider it a failed breakout. So if price dips and closes 2 days below the breakout level, it will be a major negative for oil in my opinion.

The range of the ascending triangle provides us with a measured move to the upside which is $112. Typically the first pullback after a breakout can be bought. The first short term target to scalp some gains would be $109, and at that point moving your stop to breakeven is a wise decision. Trading is all about managing capital and risk, if you don’t, then the market will take advantage of your lack in discipline.

Looking further back on the chart, you can see the double bottom formation also known as a “W” formation. Once the high of the “W” formation is broken the trend should be considered neural or up.

Also note that the RSI (relative strength) has been trending higher for some time now. This means money is rotating into this commodity. This is in line with my interview this week with Kerry Lutz and my recent article talking about the next bull market in commodities and the TSX (Toronto Stock Exchange).

clfutures

WTI Crude Oil Trading Conclusion:

In short, oil has some extra risk around it. The recent move has been partly fueled by news overseas. So at any time oil could get a lift or take a hit by news that hits the wires. I tent to trade news related events with much less capital than I normally do because of this risk.

Happy Trading!

WANT MORE TRADE IDEAS?
GET THEM HERE: WWW.THEGOLDANDOILGUY.COM


Chris Vermeulen
CEO & Founder
AlgoTrades.net
TheGoldAndOilGuy.com


Commodities in general have been under pressure for the last couple years. This can be seen by looking at the GCC Greenhaven Continuous Commodity ETF which holds a basket of resources.

The weekly chart has formed a bullish bottom pattern, and as of last January it looks as though it’s now building a basing pattern. Overall commodities are in the very early stages of a stage 1 basing pattern and it looks as though it will be a few more months before any significant breakout will occur. But there could be some early entry points if you know what to look for…

A few days ago I talked about how commodities tend to perform well near the end of a bull market in the United States stock market. I also pointed out which hot index was going to benefit from this.

Read Commodity Index Report: http://www.gold-eagle.com/article/gold-and-oil-fuel-canadian-stock-market-rally

In this article I want to bring your attention to the steel market. Using the SLX Steel ETF you can clearly see the bottoming pattern and basing pattern for this commodity.

Currently steel is underperforming the stock market and is vulnerable to lower prices. But if we see a few things come together in the coming days or weeks, this could be a screaming buy.

My technical take on steel is this:

SLX has formed a bottoming pattern from January – mid March. It has since put in a strong impulse rally to make a higher high, and is now consolidating above key support. The RSI (Relative Strength) remains in a down trend, but if this starts to rise and SLX breaks above its recent highs around the $47.75 level I feel steel will start to rally with $50 being the next major whole number and previous high for steel to find some resistance.

Also price has been riding along the 200 day moving average which is acting as support. If price closes a couple of days below the 200 moving average I would consider this to be a bearish sign.

SLX

Steel Trading Conclusion:

In short, we are looking for the relative strength to start making new highs. Also we want to see a reversal bar on the SLX chart to the upside which we got on Tuesday. Or you can wait for a breakout and close above $47-48 area. Stop would be somewhere around the $45.75 area to start, then raise it as price rallies using intraday pivot lows on the 30 minute chart.

GET THESE REPORTS DELIVERED TO YOUR INBOX FREE: www.GoldAndOilGuy.com

Chris Vermeulen
Disclaimer: I do not own shares of TAN as this point, but may buy some in the near future.


During the past couple months several indexes, sectors and commodities have sold off more than 10 – 20%. But now some are looking like new buying opportunities. Over the next week I will bring a few of these trades to your attention as they start to unfold.

Today we are looking at the TAN solar ETF. This sector recently had a 23% hair cut in price. A 20-25% correction in price is a typical intermediate correction for a fast moving sector. The price correction has pulled the sector down to its 150 and 200 simple day moving averages. These levels tend to act as long term support for investors, a buying point.

Many of the individual stocks within this sector are starting to pop and breakout of bullish price patterns. These individual stock prices point to higher prices for TAN going forward.

Be aware of crude oil…. I do think that as long as the price of crude oil stays up solar stocks will continue to rise overall. But if oil starts to roll over and break down, TAN will struggle.

My Technical Take on The Chart:

Big picture analysis shows a powerful uptrend with bullish consolidation.

Intermediate analysis shows a falling bullish wedge, test of moving averages, and a reversal breakout pattern.

tan

Short term analysis shows we are at a resistance level and we will likely see a pause of pullback over the next few days before it goes higher.

TANshortterm

TAN Trading Conclusion:

If price closed back below the $39.00 I would consider this bounce/rally failed.

Get My Trade Ideas Delivered To Your Inbox FREE: www.GoldAndOilGuy.com

Chris Vermeulen

Disclaimer: I do not own shares of TAN as this point, but may buy some in the near future.

Here is my market forecast for precious metals and this weeks trade setups.

Like this video? Join my premium service and get them EVERY DAY!

Subscribe Here: http://www.thegoldandoilguy.com/etf-trading-newsletter/