
Weekly SPX & Gold Price Cycle Report
Today I want to talk to you about the SP500 because it’s on the verge of making a very significant move. We could experience a 15% rally or a 15% decline and it could be just around the corner.
Let me recap on both the short-term top this month, and then a look at the bigger picture of what happened last October through December and if we are going to see that happen again. There is the possibility we get a massive rally if the market breaks to new highs. The market is loaded and ready for action. Whichever way it breaks will have a strong impact on precious metals and bonds. Make sure to opt-in to our free market trend signals newsletter.
21 DAYS THEN A BREAKDOWN?
Let’s look at the SP500 for the last 6 months in the chart below. If we were to just draw support trendlines across the lows and a resistance trend line across the highs, you can see we still have some room for the SP500 to work itself higher and still be within the pattern.
Do you see the blue line that is on the chart? You will notice it follows price very closely and you’ll notice the purple line on the hard-right edge as well. This purple line is the forecasted projected cycle price that we are anticipating for the SP500 over the next 45 days.
I should note that as the market evolves and moves this price cycle forecast will change, but it gives us a good idea of current cycles in the market and where the price should go next.
Overall, we’re all you’re looking for SP500 to struggle to move higher because it acts as resistance. If resistance holds then it is likely the market breaks down and tests the August or September Low.

S&P 500 OCTOBER – DECEMBER MARKET CRASH TO REPEAT?
Let’s step back and look at last year’s price action. You can see that the cycle analysis is pointing to potentially another market crash down to those December low. If that is the case then it could be the start of something very significant like a new bear market.
So that’s where we’re at in terms of the SP500 and at this point, we’ve got another 21 days or so before the SP500 should start breaking below our white trendline support level.
While cycle analysis helps us paint a clear picture of what to expect looking forward up to 45 days I still rely on my market trend charts to know when I should be buying or selling positions.

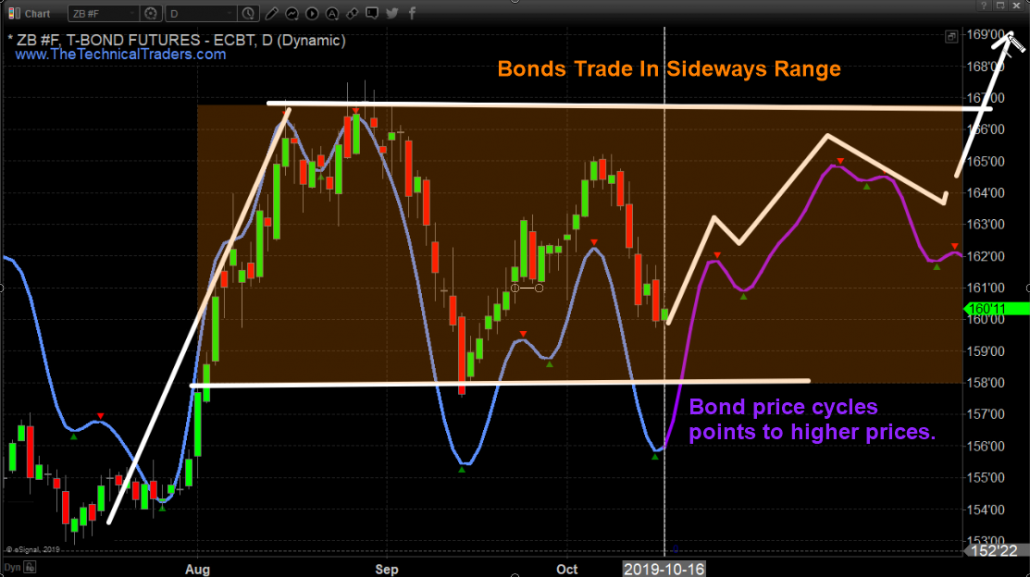
BONDS – THE NATURAL INVESTOR SAFE HAVEN
The first safe haven investors flock to when they become scared are bonds. By looking at the chart we can see they should start to find a bottom based on our cycles. Bond prices are stuck within a large sideways channel and should hold their ground until the SP500 starts collapse. If the SP500 breaks down then we’re going to see bonds move higher and should eventually break out and make new highs.

GOLD – THE SAFEST OF SAFE HAVENS
The true safe Haven is gold when it comes to a global store of value for all countries and individuals.
Take a look at the price of gold, as you can see it rallied in June and again in August when the cycles bottomed and started an uptrend. Right now the price is in a much larger consolidation (bull flag pattern) which is a positive sign. In fact, this multi-month pause makes gold even more bullish in my opinion. The longer a commodity trades sideway the more powerful the next move will be.
You can see based on our cycles analysis and forecasted price gold still has some potential weakness for a couple of weeks.
Understanding cycles and how to trade with them is much harder than most people think. If you do not understand cycle skew then you will struggle to turn a profit. I have been trading with cycles since 2001 and still, I find them very deceiving at times.
In laymen terms, cycle skew is when a cycle moves against the direction of the underlying asset’s trend. The chart below shows this clearly with the white lines. In short, gold is in an uptrend, and when the cycle moves down against the assets trend price will in most cases trade sideways. Do not try to short cycle tops when the trend is up, no matter how tempting it may be.
The key is to wait for cycles to bottom, then get back into position for the next upward move in the cycle and price.
I had a fantastic chat with Adam Johnson from BullsEyeBrief today and if you are interested in more juicy details on the SP500, Gold, and how I trades be sure to listen to the most recent podcast we did together at the top of his website https://bullseyebrief.com/podcast/

THE TECHNICAL TRADERS THOUGHTS:
In short, the stock market continues to keep the bull market alive, but investors have started to move into gold as a safe haven. The fear of a market downturn is growing which is why gold has rallied and started a new bull market. The money flow into gold is very strong and is warning us that US equities could enter a bear market in the next few months and that possibly something much larger globally could be at play as well.
Gold continues to just hold up well even with the current cycle forecast trending lower. Overall, we’re looking at about 20 days or so and we could see metals and equity prices make some incredible moves.
Keep reading our research because our proprietary tools have been nailing all of these price targets and move many months in advance. The next bottom in metals should set up when our cycle bottoms – then the next upside leg will begin. This time Gold should target $1800 and Silver should target $21 to $24. This will be an incredible move higher if it plays out as we suspect.
I urge you visit my ETF Wealth Building Newsletter and if you like what I offer, join me with the 1-year subscription to lock in the lowest rate possible and ride my coattails as I navigate these financial market and build wealth while others lose nearly everything they own during the next financial crisis. Join Now and Get a Free 1oz Silver Bar!
As a technical analysis and trader since 1997, I have been through a few bull/bear market cycles. I believe I have a good pulse on the market and timing key turning points for both short-term swing trading and long-term investment capital. The opportunities are massive/life-changing if handled properly.
Chris Vermeulen
www.TheTechnicalTraders.com


