
US Stock Market Foreshadows Another Rally – True Story!
Over the past couple week’s investors and traders have been growing increasingly bearish for the US stock market. While I too also feel this rally is getting long in the teeth there is no reason to exit long positions and start shorting.
My followers know I do not pick tops and I do not pick bottoms. This I explained in great detail in my previous report. There are more cons to that tactic and on several different levels (timing, volatility, emotions, lack of experience, addiction) than there are pro’s.
Keeping things simple, short and to the point here is my thinking for today and this week on the broad market. Remember my analysis is 100% technical based using price, volume, cycles, volatility, momentum and sentiment. I try not to let any emotions, gut feel, or bias flow into my projections. I say “TRY” because I am only human and at times when the market and emotions are flying high they still take control of me but that is few and far between.
So let’s get to the charts shall we!
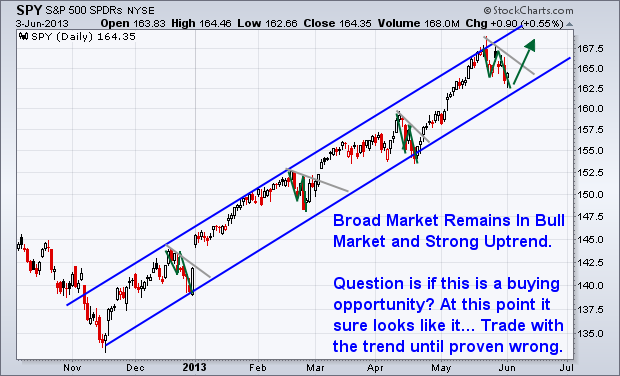
SP500 Index Trading Daily Chart – SPY Exchange Traded Fund
The SP500 index continues to hold up within its rising trend channel and the recent pullback is bullish. Remember the trend is your friend and it can continue for very long periods of times ranging from days, weeks, and even months…
The US Stock Market MUSCLE Indexes
The charts below show and explain my thinking… But in short we need these two indexes to be strong if we want to see another major leg higher in the SPY, or to at least test the recent highs.
Today the market opened slightly higher and push up in the first 30 minutes with strong volume. Overall the market looks as though it needs a day pause/pullback before taking another run higher.
Small cap stocks are the ULTIMATE Risk On play and generate ridiculous gains in very short periods of time. I focus on these with my trading partner exclusively at ActiveTradingPartners.com where we have been making a killing on trades like: NUGT up 21% in 1 day and IOC up 11% in 2 days

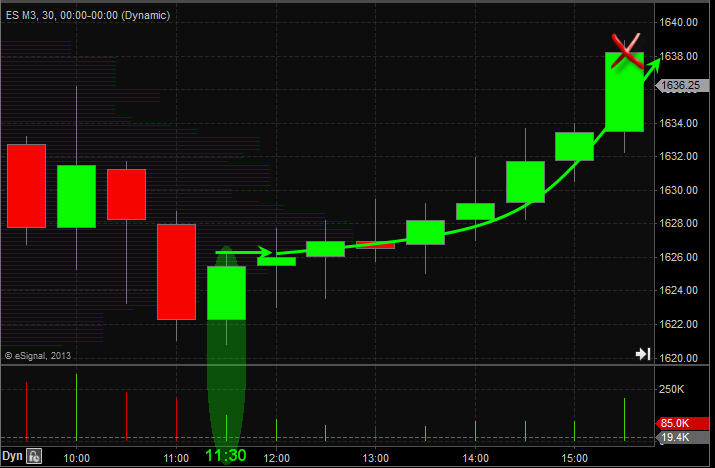
Bullish Index Price, Volume & Candles
The SP500 has been very predictable the past couple weeks for both intraday trading during key reversal times in the market when price has pullback to a support zone, and also for swing trading. Last week we myself and followers bought SSO ETF when the market pulled back and we exited the next day for a 3.5% profit.
Yesterday was a perfect intraday example with the SP500 bottoming out at my 11:30am morning reversal time zone with price trading at support. Price then rallied into the close posting a 12 point gain on the SP500 futures for a simple momentum play pocketing $600.
US Stock Market Mid-Week Conclusion:
In short, I still like stocks as the place to be and will not get bearish until proven wrong. Once price reverses and the technical clearly paint a bearish picture with price, volume, momentum, cycles and sentiment will I start shorting the bounces.
This week is a pivotal one for the stock market so expect increased volatility and possibly lower lows still until the counter-trend flushes the weak position out before moving higher.
If you like my simple, clean and profitable market analysis join my NEWSLETTER: www.thegoldandoilguy.com/signup.php
Chris Vermeulen