
US Stock Market Enters Twilight Zone
The US stock market has rallied substantially since the bottom on March 23, 2020. Our Adaptive Fibonacci Price Modeling system is showing us just how fragile the US stock market and certain sectors of the markets really are right now. What’s going to happen next and how should you prepare for the next big move? Let us try to explain our beliefs.
First, the US stock market bottom just as the US Senate and Fed announced major stimulus packages designed to support the collapsing markets. Everything done prior to the March 23 date was “fodder” as the risk to the global markets was far greater than anything the US Fed or global central banks could muster. On March 23, the US Fed initiated an unlimited asset purchase program to support the failing markets. This changed the perspective of traders/investors immediately – but it also created a massive risk factor that few even considered. For a complete timeline on the US Fed actions, review this link.
Our own research team was calling for a breakdown in the US and global markets many months in advance of this move – even before the world knew about the Chinese/Wuhan virus event. Take a look at some of our research posts from the past
January 26, 2020: The Black Swan Event Begins
January 29, 2020: Are We Setting Up For A Waterfall Selloff?
February 18, 2020: Is The Technology Sector Setting Up For A Crash? Part II
Less than 3 days prior to the massive selloff event, we posted this:
February 24, 2020: Has The Equities Waterfall Event Started Or A Buying Opportunity?
Today, we are posting this research article to highlight the unique setup in many of the major US stock indexes and sectors. Using our Adaptive Fibonacci Price Modeling system, two things become clearly evident in the charts…
A. Price must hold above support levels (the upper TRIGGER ZONE level and/or the GREEN Fibonacci Trigger level on the right side of the chart) in order for the uptrend to continue.
B. Price has already reached (in most cases) the CYAN Fibonacci projected target level and this level may turn into major resistance pushing the price back into a downtrend.
BEFORE WE CONTINUE, BE SURE TO
OPT-IN TO MY FREE MARKET TREND SIGNALS
SO YOU DON’T MISS OUR NEXT SPECIAL REPORT!
DAILY SPY CHART
This first Daily SPY chart clearly highlights the setup we are describing. First, take a look at the CYAN line on the chart near the 282.97 level. This Fibonacci target level becomes support when price moves above it and becomes resistant when price moves below it. Currently, the SPY is trading very near to the 283 level and we believe this level may turn into massive resistance over the next 5 to 10+ days.
Secondly, take a look at the TRIGGER ZONE on this chart (a price zone drawn between the Bullish and Bearish Fibonacci price trigger levels). This zone represents a very dangerous price area where the overall price trend may change directions and where volatility could explode. As long as the price stays above this zone, then moderate bullish price activity should be expected.
If the price falls below this zone, then moderate to strong bearish price activity should be expected. The reason why the downside risk is much greater than the upside potential is because of the recent downtrend in the market that sets up a “recent higher high” near 295.50.

MONTHLY SPY CHART
This Monthly SPY chart highlights the longer-term Fibonacci price analysis. The extreme breakdown in price has already broken below the RED Fibonacci Bearish price trigger level near $300 and broken through the BLUE initial target level near $279.00. The next downside price target levels are GREY, near $173.40, and RED, near $128.00. Currently, the SPY price has rallied back above the BLUE target level and is stalling near $282~285. This price level is already below the $300 Bearish Trigger level – which suggests further downside price activity in our future.
Additionally, pay attention to the “arcs” that are on this Monthly chart. These are our proprietary Fibonacci Price Amplitude Arcs that show us where price may target based on a theory that each price trend creates “price amplitude waves” into the past and future. Currently, the “4D” area on this chart is our most likely bottom area. There is also a “1.618” GREEN price arc that is just above the current price level (near $292). We believe this Green 1.618 level is acting as major resistance and that price will reverse back to the downside within a 5 to 10-day window.

WEEKLY TRANSPORTATION INDEX CHART
This Weekly TRAN, Transportation Index, chart highlights a similar pattern but also shows how much downside pricing pressure is still evident across different sectors of the markets. Even though the ES, NQ, and YM have rallied to near 50% to 61% of the initial downside price move, the Transportation Index has only recovered to the 38.2% Fibonacci Retracement level. This suggests that the US Fed and global central banks have poured capital into the blue chips and technology sectors while leaving much of the broader market bloodied and on the sidelines.
A similar type of setup is appearing in this TRAN chart. The CYAN target level has been reached and the price has stalled just above this level. The TRIGGER ZONE is clearly evident on the chart and the price is slightly above that level right now. Very clear downside price targets are evident (RED, Blue and GREY) and any price move below $7565 will likely prompt a much bigger downside price move. What we are seeing in the markets is that any substantial downside price rotation will potentially set up a much bigger downside price collapse in the US and global markets.

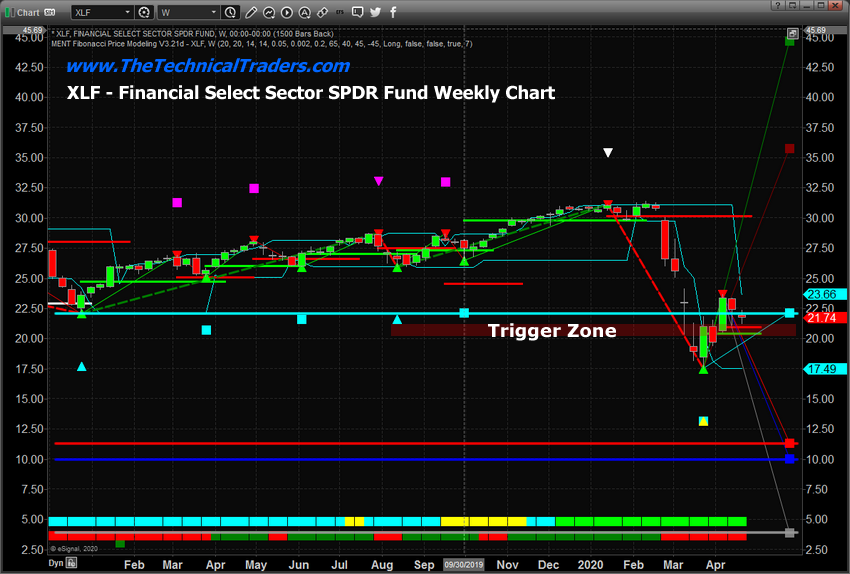
WEEKLY XLF CHART
This Weekly XLF chart, the Financial Sector SPDR ETF, sets up almost identical to the TRAN chart. Deeper price targets, the price has already reached the CYAN target level and stalled recent downside price rotation, and a very real possibility that any downside price move could breach the Fibonacci Bearish Price Trigger Level near $21.
What happens if, suddenly, the US and global markets roll lower by 5% to 10% and a new wave of selling panics the markets?

CONCLUDING THOUGHTS:
The answer is that the US and global markets will attempt to reach the most recent low price levels, or one of the deeper Fibonacci bearish target levels on these charts, and attempt to find support (or true market value) before attempting any move higher. One must understand that until price shows us that it is capable of rallying above all-time highs, there is still a very real risk that another downside price move could take place.
These TRIGGER ZONES are key to understanding where the fragile balance in price is located on these symbols. As long as price stays above this zone, then continued bullish price action should be expected. If the price falls below this zone, then more downside price activity should be expected.
If you pay very close attention to almost all of these charts, you’ll notice that the next Fibonacci upside price targets (above the CYAN level) are well above the most recent all-time high levels. This suggests that price will have to rally well above these all-time high levels to qualify the next bullish price target. It could happen if the global markets recover much quicker than we expect and the earnings/GDP damage is minimal. But given what we believe is really happening throughout the world right now, the downside targets seem more realistic outcomes (unless the US Fed and global banks absorb $40 to $50 Trillion in global risk assets over the next 60 days.
Watch how the markets react to these price levels and how the longer-term price pivots setup on these Weekly/Monthly charts. The price will tell us where it wants to go. We just have to be on the right side of the move so we don’t get slaughtered by a sudden price move.
As a technical analyst and trader since 1997, I have been through a few bull/bear market cycles in stocks and commodities. I believe I have a good pulse on the market and timing key turning points for investing and short-term swing traders. 2020 is an incredible year for traders and investors. Don’t miss all the incredible trends and trade setups.
Subscribers of my ETF Swing Trading Newsletter had our trading accounts close at a new high watermark. We not only exited the equities market as it started to roll over in February, but we profited from the sell-off in a very controlled way with TLT bonds for a 20% gain. This week we closed out SPY ETF trade taking advantage of this bounce and entered a new trade with our account is at another all-time high value.
Ride my coattails as I navigate these financial markets and build wealth while others watch most of their retirement funds drop 35-65% during the next financial crisis.
Just think of this for a minute. While most of us have active trading accounts, what is even more important are our long-term investment and retirement accounts. Why? Because they are, in most cases, our largest store of wealth other than our homes, and if they are not protected during the next bear market, you could lose 25-50% or more of your net worth. The good news is we can preserve and even grow our long term capital when things get ugly like they are now and ill show you how and one of the best trades is one your financial advisor will never let you do because they do not make money from the trade/position.
If you have any type of retirement account and are looking for signals when to own equities, bonds, or cash, be sure to become a member of my Long-Term Investing Signals which we issued a new signal for subscribers.
Chris Vermeulen
Chief Market Strategies
Founder of Technical Traders Ltd.


