Transportation Sector Is Testing Resistance
The DOW Transportation Index continues to test resistance near $10,050 as earnings drive the NQ well past historical all-time highs. Our interest in the Transportation Index is because it acts as a fundamental indicator for the US and global economies in terms of future transportation/shipping expectations. When the Transportation Index rises, it is a good sign that business and consumers have faith in the future economy and the continued demand for goods to be supplied to retailers and distribution centers.
The fact that the TRAN is back to near December 2018 highs means we have reached an expected economic expansion level that equals that level just before Christmas 2018. A continued rally would push expectations even higher going into the Summer months. With earnings hitting the market hard today driving a strong rally in almost all the major US stock indexes, we are surprised that the TRAN did not move a bit higher on the news.
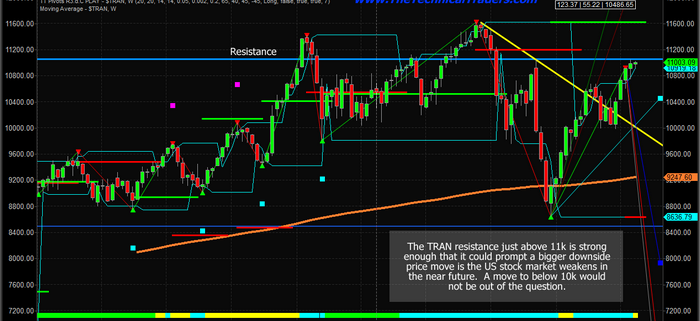
Should the resistance level near $11,050 continue to operate as a ceiling for the TRAN, we’ll know soon enough as price should begin to move back below $11,000 and possibly attempt to retest $10,800. A key Fibonacci trigger level currently rests near $10,800 that would indicate a potential for a new bearish trend if this level is broken.
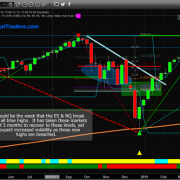
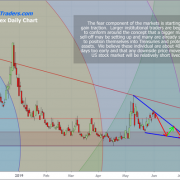
This Weekly TRAN chart, below, highlights just how important the current resistance level really is. This $11,050 level actually plays a key role in the 2018 price rotation and is the key resistance level for the December 2018 rotation peak.
As we’ve continually suggested, Fibonacci price theory suggests that price must always attempt to establish new price highs or new price lows. If this new price high, above the $11,050 fails, then price should attempt to rotate lower and attempt to break the $10,000 low level created in early April 2019.
We suggest traders take a very cautious long-biased stance in the markets right now. Weakness could come out of the shadows fairly quickly as earnings hit. The Iran Oil news hit the markets quickly on Monday. We could wake up to some dire earnings news this week that could send the markets lower and push some of these resistance levels into a topping formation.
Additionally, as you look at this Weekly chart, pay attention to the fact that we could be setting up a Right Shoulder of a Head-n-Shoulders pattern if new all-time highs are not reached. There are many ways to attempt to read this chart and the TRAN should lead the markets if a price move does breakout.
Our research says we should continue to see an upward price bias for at least another 10~35+ days before any real sign of weakness shows up. We are still urging traders to take a very cautious approach to their trading until we see the TRAN break to new highs. We feel it is wise to trade this area very cautiously over the next 30+ days.
Get My Swing Trade Signals Today! Click Here
Chris Vermeulen

