
How to Trade Indexes with Fibonacci
One very important component of the continued research we, www.TheTechnicalTraders.com, conduct into price, price patterns and price rotation is the study and application of Fibonacci price modeling. As you have seen with some of our other charting and modeling tools, we have invested a great deal of time and energy to create useful price modeling tools to assist us in our daily research and analysis.
Our Fibonacci price modeling tool is another adaptive learning model that is capable of adapting to price rotation by learning from past and current price variances as well as repeated price pattern formations. This tool is a one of a kind type of project that we covet with a great deal of respect.
Today, we are going to illustrate how this modeling system assists us and how we attempt to use it to identify trading opportunities and longer-term potentials for success. As of April 24, the markets closed dramatically lower – by almost -2% on average. This move lower pushed many of the current prices into a unique price pattern that may be very temporary. We will start by attempting to illustrate the NQ chart with our Fibonacci price modeling system and we want to make one thing very clear….
Today’s downside price rotation, excluding the ES chart, setup a new potential for future bearish trending if the current price is unable to recovery back above the key Fibonacci Bullish Price Level.
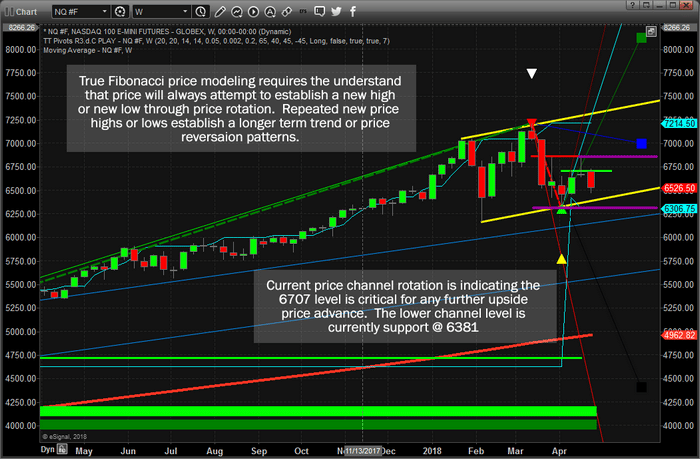
Let’s get started with the NQ chart. The first things we want you to concentrate onto are the YELLOW price channel and the PURPLE price high/low ranges established by price rotation. It is critical that you understand how price rotation, pure price, sets up all of the analysis that this modeling system completes. Nothing else is used other than price and time. The most recent price high and low levels (in most cases) establish the Fibonacci price range. This is what we use to make trending decisions.
This current NQ chart has rotated lower and is currently telling us that we should expect further downside price activity as long as price stays below the Fibonacci Bullish Price Level. Although, our ADL price modeling system is warning that the markets will enter a strong upside rally within days. Thus, it is our opinion that this recent move is a “wash-out” low price rotation that is attempting to fade the longs. The NQ Fibonacci price high is at 6867 and the Fibonacci price low is at 6307 – watch for these levels to be breached before trend accelerates.
The ES chart is set in a similar price formation to the NQ chart. Highlighted on this chart are three primary components of our Fibonacci price modeling system; the projected price levels, the Bullish & Bearish Fibonacci key price levels and the key market price rotation markers (tops and bottoms/price rotation points). Understanding our modeling system is key to your better understanding the research that we provide to you. On the right side of this chart, we’ve highlighted two key projected price levels with lines drawn in CYAN (light blue). We want you to pay special attention to those projected price levels because they became key support and resistance just a few weeks ago. If you understand the significance of this example, you’ll begin to see how past price rotations attempt to predict future price turning points using advanced Fibonacci concepts and theory.
IMPORTANT NOTE: If all of this is a little to advanced to understand, that’s ok too. Maybe you don’t want to understand or learn, and just want nothing but our best trade setups and alerts? Well, members can have our SMS trade alerts so they get only our Buy, Stop, and Profit Taking alerts. Meaning you have trade like a pro and only spend 10-30 minutes a weak to adjust a position or enter a new one as you receive an alert!
This ES chart is showing a similar analysis to that of the NQ – expect continued bearish price action unless the current Bullish Fibonacci price level is breached @ 2718.50. Again, we believe this current downside price move is a “wash-out” low price rotation within a bullish trend. One of the reasons we believe this to be the case is clear if you understand price rotation. Look at the entirety of the move recent price rotation. After establishing the key low price bottom, price has failed to attempt to take out that low.
Remember, price must always attempt to establish new highs or new lows through price rotation within Fibonacci theory. Therefore, until that low is breached, and as long as new higher low has been created, price is failing to commit to new lower lows. Thus, it must be attempting to commit to higher highs. The ES Fibonacci price high is at 2718.50 and the Fibonacci price low is at 2552.00.

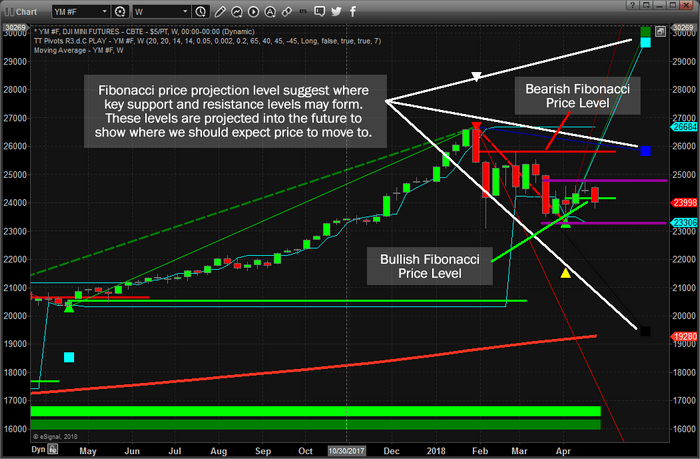
The YM chart below provides the clearest picture, in our opinion, of the detailed Fibonacci price rotation process. Very similar setups in price are still in place between all three charts. Yet, the price rotation on the YM chart provided clear confirmation that price was attempting to advance rather than collapse recently. The Bullish Fibonacci Price Level on the right side of the chart was breached and confirmed three weeks ago with a close above 24135. The NQ and ES did not achieve this key price element in Fibonacci theory.
Additionally, the BLUE downside price projection point was very shallow compared to the recent peak high. This is typically a sign that any price rotation may be shallow as well and short lived. As of the recent closing, the current close is below the Bullish Fibonacci Price Level, thus we are expecting some potential weakness in price until it advanced back above this level. Yet, our believe that this “wash-out low” is a process of targeting near priced longs is still valid. If, at the end of this week, price is back above the Bullish Fibonacci Price Level, we will have further confirmation that this downside move was just a “wash-out low”. The YM Fibonacci price high is at 24827 and the Fibonacci price low is at 23306.
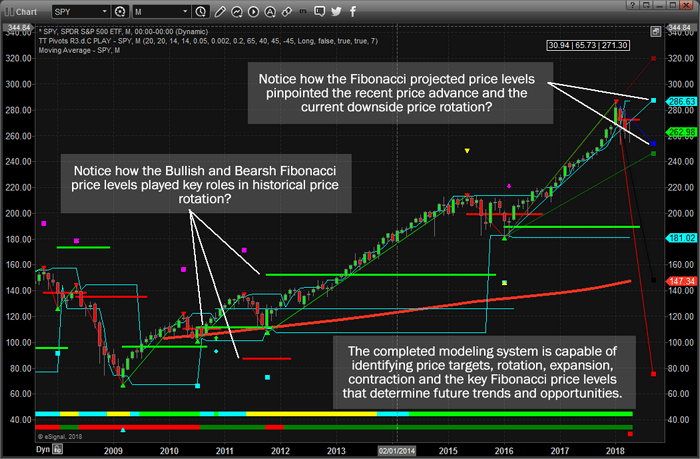
Lastly, we are going to show you a much longer term Monthly SPY chart running our Fibonacci price modeling system for comparison.
When you look at this chart below and compare the price action you see to the previous chart, remember this Monthly chart is really the key to the longer term price potential. As of right now, the current price is below the Bearish Fibonacci Price Level, which indicates a reason to be concerned with potentially further downside price activity. Yet, the projected Fibonacci price levels have clearly defined support and resistance at, or very near to, the current price rotational high and low. This would indicate that the current price rotation is within expected ranges and until a new closing price low is established below the 253.70 level. Any downward price move will find support near 246.30 (the GREEN projected price level).
Price MUST advance +4% from current levels to abate any downside pressure resulting from this recent move. In other words, we need to see a solid price advance over the next 5+ trading days, before the end of April, to technically qualify any further advance higher based on this Monthly Fibonacci modeling system. Of course, the Daily and Weekly models will tell us a much faster and more detailed shorter-term Fibonacci price model for this same price rotation.
We’ve received hundreds of comments regarding our Adaptive Predictive Learning (ADL) price modeling system and we love to hear how all of your are enjoying our research. This Fibonacci price modeling system, once you understand it as well as we do, is a very powerful price modeling tool that helps us identify unique opportunities in the markets for our clients. Each of these tools provide unique benefits and understanding as to what to expect in the future. We try to condense all of this into easy to understand daily updates for all of our valued members so you don’t have to spend decades trying to learn and understand all of this.
Currently, our ADL price modeling system is telling us the markets will attempt to rocket higher within 3~5+ weeks. You’ve probably seen that research or can view it on our web site or from our free email newsletter. Our Fibonacci price modeling system, is warning us that price could fall below support if it does not rally back above the Bullish Fibonacci Price Levels as our ADL model is predicting. Thus, we are suggesting this current downside price rotation is likely a “wash-out” price low that may become somewhat meaningless in the near future.
Follow our Daily video forecasts and our future research to learn more about how we help our clients find profits in these moves. We are already positions for what we believe will be the best opportunities for success with our members. Join us and learn how we can help you find greater success – visit www.TheTechnicalTraders.com today.

