How to trade technology stocks or the technology sector moving forward may not be that complicated. This report shows you where the big technology stocks are likely to go in the coming week or two. This is based strictly on technical analysis not fundamentals as fundamentals typically lag the market drastically.
If you have been following my analysis for some time you will recall the detailed report on AAPL and RIMM shares last year when I called the top in Apple shares and the bottom for RIMM (BBRY). In that report I walked you through the stages which stocks go through and where each of these stocks were trading at then. Be sure to review the charts quickly here: http://www.thegoldandoilguy.com/collapse-of-apple-rise-of-the-blackberries-stock-market-cycle/
In this week’s report I talk about the technology sector in more detail using the tech giants like Apple, Google, Yahoo, BBRY, and the XLK tech sector exchange traded fund. A picture says a thousand words so here are a few thousand words in picture format with my analysis and thinking as of this week.
Keep in mind that the market changes each day so forecasts and outlooks can flip within a couple days so nothing is set in stone and subject to change.
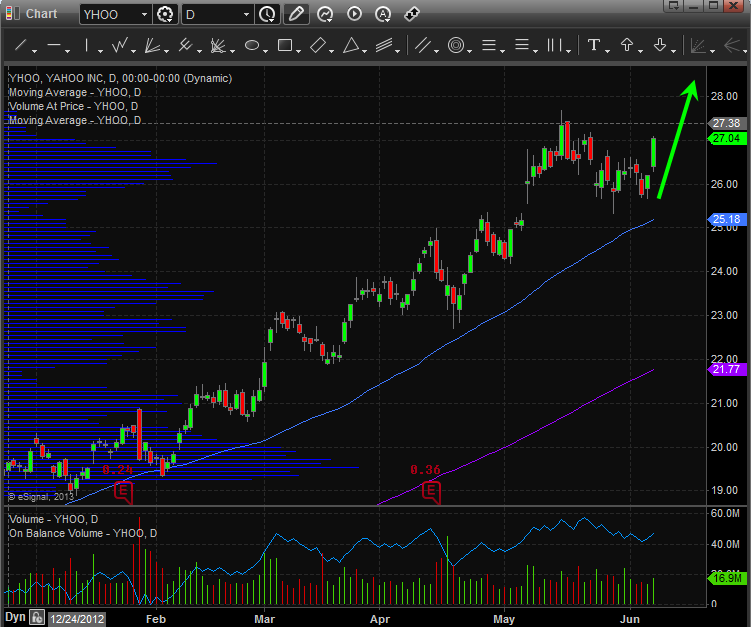
YAHOO – Daily Chart
Yahoo is in an uptrend with strong share accumulation. It continues to form bullish price patterns and points to higher prices in the coming week.
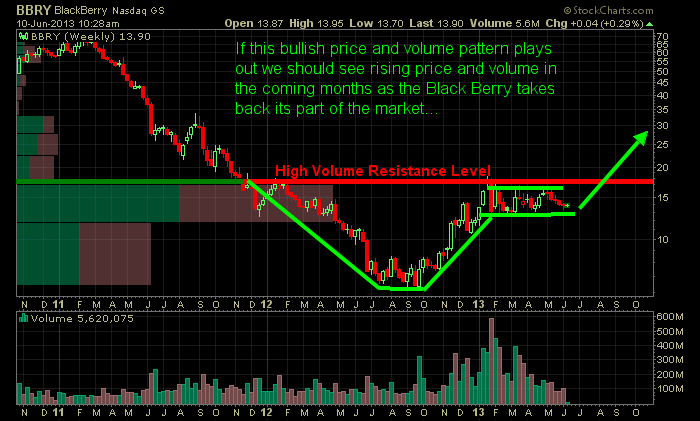
Research In-Motion/Back Berry WEEKLY Chart:
This is a weekly chart so things move much slower. But overall the pattern on BBRY is very bullish and if the broad market does not start a correction this stock price should test $30 per share this summer.
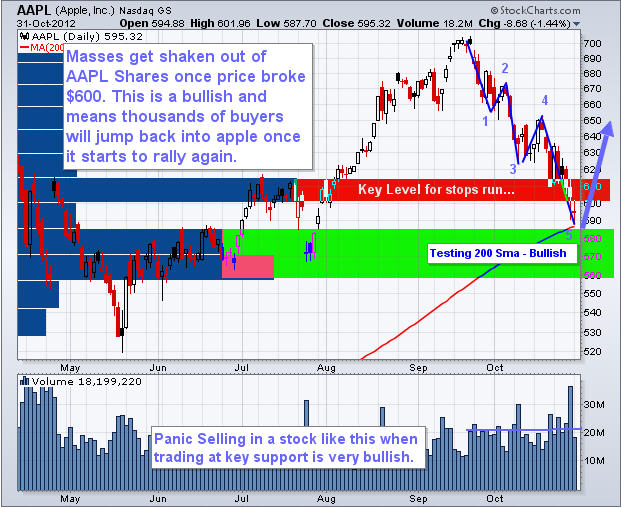
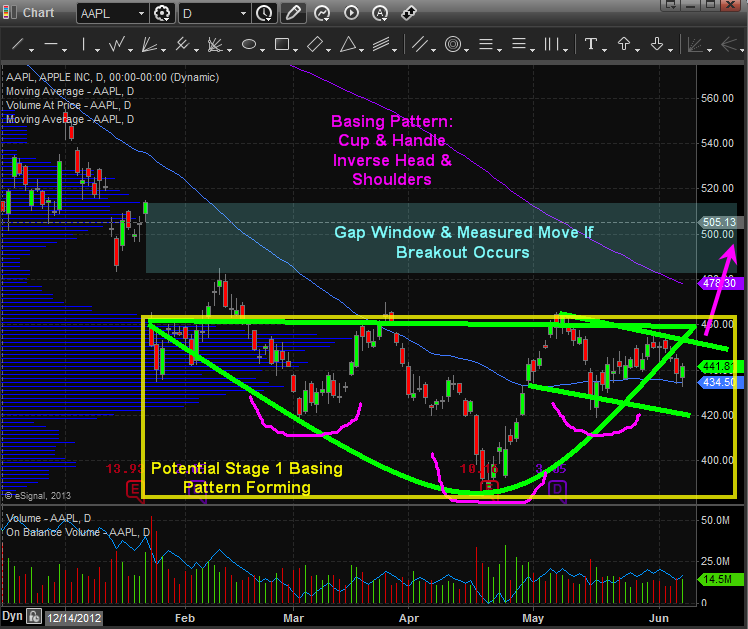
Apple Daily Chart:
Apple topped out months ago but is now starting to look ready for a bounce. It is forming a possible stage 1 base, and an inverse head & Shoulders pattern. Both point to higher prices and a gap window fill which is the next higher volume resistance zone.
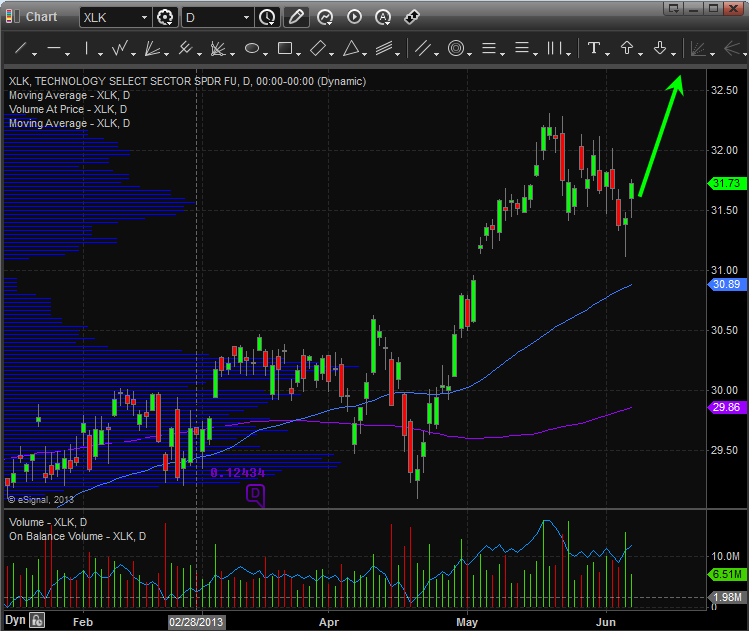
XLK – Technology Sector Exchange Traded Fund
While I like the potential of individual stocks you are subject to individual news etc… which is a little to risky for my blood but my trading partner specializes in this type of trading and has been making a killing this year with his subscribers at www.ActiveTradingPartners.com. The more conservative trader can focus on a basket of technology stocks using the XLK ETF which shows higher prices in the next week or two also.
Another way to play this is through options which is technically the least risky trading strategy there is when done correctly. You can see from these results options are VERY powerful – Options Trading
Technology Trading Conclusion:
In short, I like how the technology sector is looking for a continued move higher. Keep in mind the report I did a week ago talking about the intermediate cycle topping out for the SP500 soon. Stocks may just reach their recent highs then roll over in a big way. So any gains should be protected with partial profit taking and a protective stop.
Get My Thoughts & Ideas Every Day Delivered to Your Inbox: www.thegoldandoilguy.com/signup.php
Chris Vermeulen