Posts

Everything in the world goes through cycles including investors level of fear, and stock prices. In this report, I want to show you how you can identify short-term and longer-term market tops and bottoms using technical analysis that focuses on the most active time cycles in the stock market today.

Before we get into the details here I would like to touch on two myths that you as a trader need to know in terms of average profit per trade and the number of trades needed to be highly profitable. It’s not what you may think.

Myth #1: You Must Always Be In A Trade and Trading
You don’t need to trade every week, or need to always be in a position. This is a huge misconception and something that most traders struggle with grasping. The reality is, the fewer the trades you make less likely you are to lose money. For example, over the past 17 months, I have placed 53 trades which works out to only 3 trades a month, not many. With those 53 trades, our entire portfolio is up 74.9%. Ya, a whopping 75% with only a few simple trades a month and if you calculate what the average percent return is then you get a taste of trading reality, which brings us to the topic 2.

Myth #2: You Need 8%-25%+ Profit Per Trade to Make Big Profits
Average percent return per trade is another thing most traders have completely backward. If you take 74.9% divided by 53 trades you get 1.41% average return per trade. WOW, that’s low, right? Ya, it seems low, but that’s the reality of trading. The markets wiggle up and down 1-5% regularly and you cant perfectly nail every top or bottom, and sometimes a nice trend trade is completely wiped out in 1-3 days from a flash crash type of sell-off and we have seen a few of those in the past year. What you are left with is the safe middle 1%-3% each trade,  and these trades are the norm. But with that said we still have some 5-10% losing trades, and some 20-45% winners pickled in there which is always exciting.

My point on these two topics is for everyone to stop thinking you always need to be trading and think every trade should make 10-20% profit or it’s not worth your time and money.

I get emails all the time from traders who demand 5+ trades a week, expect big gains on every trade, and they usually have a story to share about how they recently lost a boatload money trading some 3X ETF with nearly their entire portfolio in one position and they need my help for some big trades to make it all back.

Yes, I can help, Yes it’s possible we get a couple of big trades that could do this, it happens, but we don’t know exactly when or which trade it will be. You must put in our time, trade cautiously and the big wins will happen over time.

Traders like this most definitely need some help because if they don’t start trading properly soon enough they will take a big loss, give back months/years of hard work, or blow up their account altogether. Trust me I have been there done that three times when starting out. Losing everything three times is a very sobering experience but sometimes it is the only way to learn if you don’t find the right mentor or trading newsletter to follow. Focus on building your account and wealth over time, not in a few fast-moving stocks/ETF trades.

SP500 DAILY CHART & CYCLE ANALYSIS

This chart is a little cluttered but if you look at the bottom of the chart where my cycle tool is located you will see how different cycles have different strengths and form short term tops and bottoms.

They key focus should be on the three larger RED shaded areas, and the one large GREEN shaded area. Those are what I call Cycle Clusters. When all three cycles are in the overbought or oversold zone we should expect weakness for 3-6 days.

The light blue cycle when trading in the overbought or oversold zone can be used for re-entry or adding to positions in favor of the overall trend (up or down).

By having this technical trading tool we are able to scale in and out of the market for increased profits while reducing our portfolio risk.
This cycle tool is something subscribers to my Wealth Building Newsletter will have access to in the very near future including my complete entry, targets, and stop alerts. By following all the key markets we will have a steady stream of trades each month for increased profits.

DAILY VIX CHART AT SUPPORT & CYCLE CLUSTER

I decided to pull some VIX analysis into this research simply because the VIX recently tagged a critical support level as shown on the chart below, along with a cycle low cluster. Both of these things occurring could mean stocks are set up for a deeper than normal correction in the very near future.

The VIX at times can act as a crystal ball during times of extreme fear or complacency. Currently, complacency is the signal with traders and investors having no fear of falling prices.

The VIX is a contrarian indicator with the old saying “When the VIX is high its time to buy, with the VIX is low its time to go”.

Based on the options market for VIX puts and calls traders are expecting the VIX rise over than a couple of days and even a month from now.

30 MINUTE CHART & CYCLE PREDICTION

If we take the analysis one step further, we can zero in on the 30-minute regular trading hours only chart (9:30 am ET – 4 pm ET) with our blended cycles price bias for a better feeling of where the price is wanting to go over the next 3-6 days.

Based on the SP500 index cycles, coupled with the VIX cycles and test of support the intraday analysis looking forward 3 days looks to be in line with the other trading tools.

FUN FACTS
FIFTEEN 5% WINNERS COMPOUNDED = 107% ROI
$500 PROFIT PER/MONTH = 30% ROI WITH $20K ANNUALLY
POSITION SIZING = TRADING SUCCESS

While there are hundreds technical indicators and thousands of ways to try and read, time, and trade the stock indexes I have developed my own way to spot stock index tops and bottoms using this special cycle tool. I should note that this works exceptionally well with gold, gold miners, silver, and oil.

IN CONCLUSION:

In short, expect stocks to trade sideways or lower this week and for the VIX to work is way higher.

We’ll keep you informed as this plays out with Wealth Building & Global Financial Reset Newsletter if you like what I offer, join me with the 1 or 2-year subscription to lock in the lowest rate possible and ride my coattails as I navigate these financial market and build wealth while others lose nearly everything they own during the next financial crisis. Join Now and Get a Free 1oz Silver Round or Gold Bar Shipped To You!

I can tell you that huge moves are about to start unfolding not only in metals, or stocks but globally and some of these super cycles are going to last years. A gentleman by the name of Brad Matheny goes into great detail with his simple to understand charts and guide about this. His financial market research is one of a kind and a real eye-opener. 2020 Cycles – The Greatest Opportunity Of Your Lifetime

As a technical analysis and trader since 1997, I have been through a few bull/bear market cycles. I believe I have a good pulse on the market and timing key turning points for both short-term swing trading and long-term investment capital. The opportunities are massive/life-changing if handled properly.

IM GIVING THEM AWAY WITH 2-YEAR MEMBERSHIPS

So kill two birds with one stone and subscribe for two years to get your FREE GOLD BAR and enough trades to profit through the next metals bull market and financial crisis!

SUBSCRIBE -> STACK GOLD BAR -> GET WINNING TRADES

Chris Vermeulen – Technical Traders Ltd

The Technical Traders Ltd has identified a unique price to volatility relationship between the SP500 and VIX index.  The calculations required to compute the VIX index are composed of a number of factors. That final value of the VIX index is reported on an annualized basis. This means that VIX index as already internalized the past 12 months price volatility into the current VIX levels. We believe this increased VIX volatility expectation could be muting future VIX spikes and trading systems focus on the VIX Index.  The fact that the VIX as likely to internalized that large October to December 2018 price rotation and will not move beyond this price range until well after April or May of 2020 creates a unique problem for VIX systems and analysts. In short, the VIX has normalized a 20% price volatility expectation, or more, and will not reduce this expectation until well after April or May of 2020. Taking a look at this weekly VIX chart clearly highlights the large 472% increase in January and February 2018.  The reason why the VIX increased by this incredible amount is that the prior 12 months price volatility was extremely muted.  The price rotation in the SPX was -343, for a total of -12%. The second VIX Spike between October and December of 2018 resulted in a 227% increase while price rotated more than 600 points, -20.61%, in the SPX. Obviously, the larger price movement in October through December 2018 would have likely resulted in a large VIX move if prior volatility expectations had remained the same. It is our belief that the January to February 2018 price volatility rotation increase the VIX volatility expectations by at least 30 to 40%. The second, much larger, price rotation during October to December 2018 pushed the VIX volatility expectations higher by at least 10 to 15%. Our researchers believe the normalized VIX levels representing current price volatility are likely to stay above 12 or 13 until well after November or December 2019 if price volatility and expectations stay rather muted. Any additional large price rotations, to the downside, will likely continue to normalize or internalize increased VIX level volatility expectations.
This SPX chart helps to compare the relative VIX price increases in relation to the true SPX price volatility. We’ve also drawn a 12-month price window, as a red box on this chart, to highlight how the VIX attempts to normalize the past 12 months volatility going forward. It is our belief that a move above 500 to 600 points in the SPX may only prompt a rally in the VIX to near 28 to 30. Whereas, the same price swing from October to December 2018 prompted a VIX move to about 36. We would need to see the SPX move at least 900 points before the VIX will spike above 25 again.  Remember after January or February of 2020 the VIX may begin to contract again as price volatility stays muted for the rest of this year.
We currently believe a large price rotation may be set up for near the end of 2019. Our proprietary cycle modeling systems and extended research are suggesting this downside move may begin sometime near August or September of 2019. Remember, this new VIX research suggests that any large price downswing may result in a very moderate VIX price increase at first. In other words, things could get very interesting towards the end of 2019 for traders. Please take a minute to visit www.TheTechnicalTraders.com and see how we have been navigating, trading and profiting from the market over the past 17 months, I think you will be pleasantly surprised. Our research team believes the US stock market will likely form an extended pennant formation over the next 60+ days.  Now is the time for us to plan and prepare for what may become a very volatile second half of 2019 and early 2020.

Become A Technical Trader Today Using Our Trade and Investing Signals CLICK HERE

Chris Vermeulen

UNIQUE OPPORTUNITY: First, we typically see stocks sell-off and as the old saying goes, “Sell in May and Go Away!” which is what has been happening.

So what does this mean? It means we should start to see money flow into the safe-haven assets like the Utility sector, bonds, and most importantly precious metals. I anticipated this and our XLU utilities ETF taken with members has already hit our first profit target, and our VIX ETF trade also hit out 15% profit target and we the balance of it is still up 25% as of yesterday.

Second, my birthday was this month, and I think its time I open the doors for a once a year opportunity for everyone to get a gift that could have some considerable value in the future.

For May I am going to give away and ship out silver rounds to anyone who buys a 1-year, or 2-year subscription to my Wealth Trading Newsletter. You can upgrade to this longer-term subscription or if you are new, join one of these two plans listed below, and you will receive:

1-Year Subscription Gets One 1oz Silver Round FREE
(Could be worth hundreds of dollars)

2-Year Subscription Gets TWO 1oz Silver Rounds FREE
(Could be worth a lot in the future)

I only have few silver rounds I’m giving away
so upgrade or join now before its too late!

SUBSCRIBE TO MY TRADE ALERTS AND GET YOUR FREE SILVER ROUNDS!

Chris Vermeulen

Unless you were following our research, see below, and were already aware of the many warning signs we’ve been posting in our continued efforts to help traders and to help educate skilled investors, you were probably caught completely off guard by the news of near trade tariffs last Sunday, May 5th.  Let’s face it, the short position in the VIX was an indication that institutional and retail investors had gone “all in” on this rally and had failed to even consider anything disrupting the narrow range price rally that had been in place over the past 45+ days.  Well, all of that changed on Sunday night and many traders woke up Monday morning to the INDU down nearly -500 points.

The most incredible facet of this rotation was that the markets had already discounted the trade tariff news and began to rally almost immediately after the opening bell on Monday.  Sure, we are not out of the woods at this time with the potential for continued price volatility and price rotation, but the fact that the US stock market was capable of rallying back from a very deep opening price shows just how resilient the US stock market and the economy really are.  The issue this time, we feel, will be felt in the global market and in foreign currency rates. We’ll get into that more as we continue.

In case you missed our most recent research posts, we suggest you take a few minutes to review the following posts to bring you up to speed with our analysis/research.  Reviewing these posts may help you to better understand the rest of this article and our expectations for the next 60 to 90 days.


March 31, 2019: Proprietary Cycles Predict July Turning Point for Stock Market
https://www.thetechnicaltraders.com/proprietary-cycles-predict-july-turning-point-for-stock-market/


April 10, 2019: Intra-Day Fibonacci Modeling Shows Volatility Is About To Spike
https://www.thetechnicaltraders.com/intra-day-fibonacci-modeling-shows-volatility-is-about-to-spike/


April 17, 2019: US Stock Markets Setting Up For Increased Volatility
https://www.thetechnicaltraders.com/us-stock-markets-setting-up-for-increased-volatility/


April 22, 2019: Prepare For Unknown Price Action As New Highs Are Reached
https://www.thetechnicaltraders.com/prepare-for-unknown-price-action-as-new-highs-are-reached/


April 28, 2019: Markets Are Setting Up a SHAKE-OUT – Be Prepared
https://www.thetechnicaltraders.com/markets-are-setting-up-a-shake-out-be-prepared/


Now that we’ve covered a bit of our past research, allow me to attempt to summarize things a bit.

_ First, we continue to expect new high prices to be established over the next 30+ days.  Yes, volatility will be larger than it was 30 days ago, but we believe the “Shake-out” is just starting and we believe the US stock market will continue to push higher – at least for the next 3+ weeks.

_ Second, we are very cautious of the July/August 2019 Cycle Predictions, see above.  We believe these cycles could be a warning of a major price trend change that prompts some type of “dynamic shift” in the global markets.  Right now, it appears a “Shake-out” in China/Asia may be in play.  But we believe a bigger “Shake-out” may be brewing somewhere else in the world.

_ Lastly, we believe any top formation in the US Stock market will result in a Pennant/Flag formation, rotational top formation, that will give traders ample time to reposition their trades and reduce risks.

Just a few days ago, we posted this research to help traders understand just how close the markets are to topping and what to expect – see below.  We continue to believe this “Shake-out” is more about disrupting low volatility expectations and less about a major market top in the US stock market


April 30: How Close Are The Markets From Topping?
https://www.thetechnicaltraders.com/how-close-are-the-markets-from-topping/


The Chinese stock markets will likely continue to drop as new expectations are suddenly realized and trade issues, especially IP and future IP partnerships, become a major contention moving forward.  Every step China takes, right now, is very fragile in terms of US expectations and the ability to show the world China is willing to become a responsible player in the technology field.  If China fails to realize this, the world will clearly see that China’s intention is to take as much as they can from global technology leaders while stuffing their pockets full of foreign cash – it will not end well.

The Shockwave that has just started to unfold across the global stock market/financial world is that trade, economic expectations, and currency valuations will continue to “revalue” to address these ongoing concerns until some formal resolution works itself into place.  In the meantime, any new issues that become present could further complicate these “revaluation” efforts.  The concert just started, folks.  We have a long way to go before this is all over with.

This Weekly YM chart showing our proprietary Fibonacci price modeling system is suggesting we have a “long way to go” before we could consider any downside price rotation a major risk.  The recent price highs in this YM chart have prompted a Bearish Fibonacci Trigger Price near the December 2018 lows (see the RED line near the $21,450 level).  You might be asking, “why so low?”.  This “learning modeling system” attempts to learn from price and attempts to identify where key price levels are that MUST be reached for a confirmed trend change.  As price has continued to rotate within a very wide range over the past 7+ months, the Fibonacci modeling system is suggesting that price could fall all the way back to near the December lows WITHOUT triggering a new “long term” bearish price trend.

In other words, the current price range that would constitute “normal price volatility” is anywhere between $21,450 and $26,950.  When we said to expect increased volatility, we really meant it.  This is a $5,500 range in the YM that could become a “normal volatility zone”.


The NQ Weekly chart, on the other hand, is providing us a much clearer Bearish Fibonacci Trigger level, near $7,393.  Once the price is able to close below this level, then we would consider the NQ entering a new Bearish trend as long as price stays below the $7,393 level.  If it was to rally back above this level, then the trigger is negated as long as it stays above the trigger level.

Pay very close attention to the YELLOW price channels that originate back in early 2018.  Those levels are likely to play a very important role in going forward as price attempts to establish new price ranges/channels throughout this expected price rotation and volatility.


Lastly, we’ve been warning that the Financial Sector could come under some intense pressures over the next 5 to 16+ months as all of this “Shockwave” plays out.  The reason we believe the Financial sector is vulnerable to this crazy volatility is that the exposure to multiple levels of capital risk could complicate the long-term earnings capabilities of this sector.  Almost all of these firms are involved in Personal, Corporate/Business, Real Estate, Trade, Global financing, Currency, and Bond related business ventures.  These firms are not remotely immune to any “Shockwave” – they are located right in the Bullseye/Target zone.

We believe the XLF may come under increased pressure over the next 3~6+ weeks as the Shockwave event continues to unfold.  We believe issues with Personal/Consumer credit will be the first sign of a Shockwave event and further pressures from Corporate/Business/Global/Currencies would likely be the second shoe to drop over the next 8+ months.  We believe a rotation in the XLF to near $25 is very likely over the next 3~6 months and that this move could be the result of extended risk factors originating from the “Shockwave event” we’ve been suggesting is currently unfolding.

Skilled traders should be watching technology stocks, the NASDAQ, the INDU, the Financial Sector and commodity prices over the next 4+ months for any signs that the Shockwave event is increasing in amplitude.  Additionally, pay very close attention to how currencies are moving and where the US Dollar is moving in relation to other currencies.  Gold and Silver should also be on your radar over the next few months as well.  Lastly, prepare for the major cycle event in July/August 2019.

The past four tradings sessions with volatility has kept us busy check out our most recent index trades on the SP500


Our advice continues to be to look for opportunities as the volatility increases and continue to expect an upside price bias in the US stock market – at least until we have any strong evidence that price trend has changed.  Don’t buy into the doom-sayers just yet.  In our opinion, this US upside price move is not over yet.

If you want to become a technical trader and pull money from the markets during times when most others cannot be sure to join the Wealth Trading Newsletter today. Plus, for a few days only I’m giving away and shipping Free Silver Rounds to subscribers who join our select membership levels.

Chris Vermeulen
www.TheTechnicalTraders.com


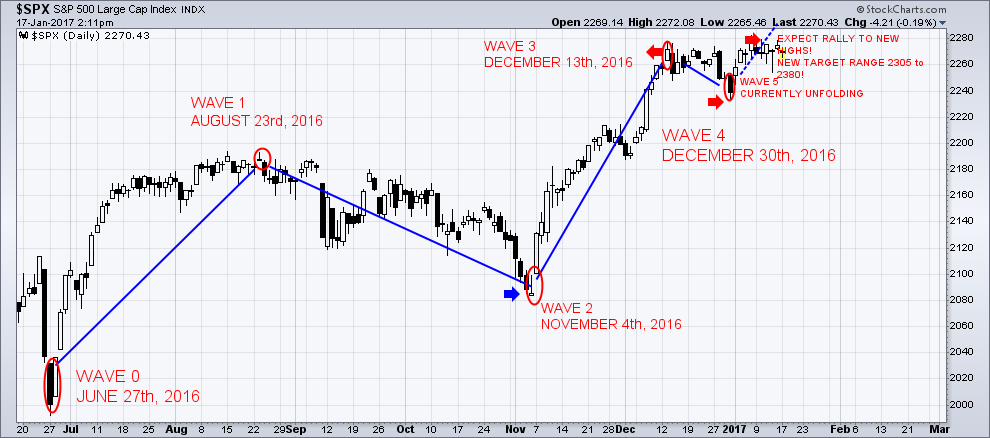
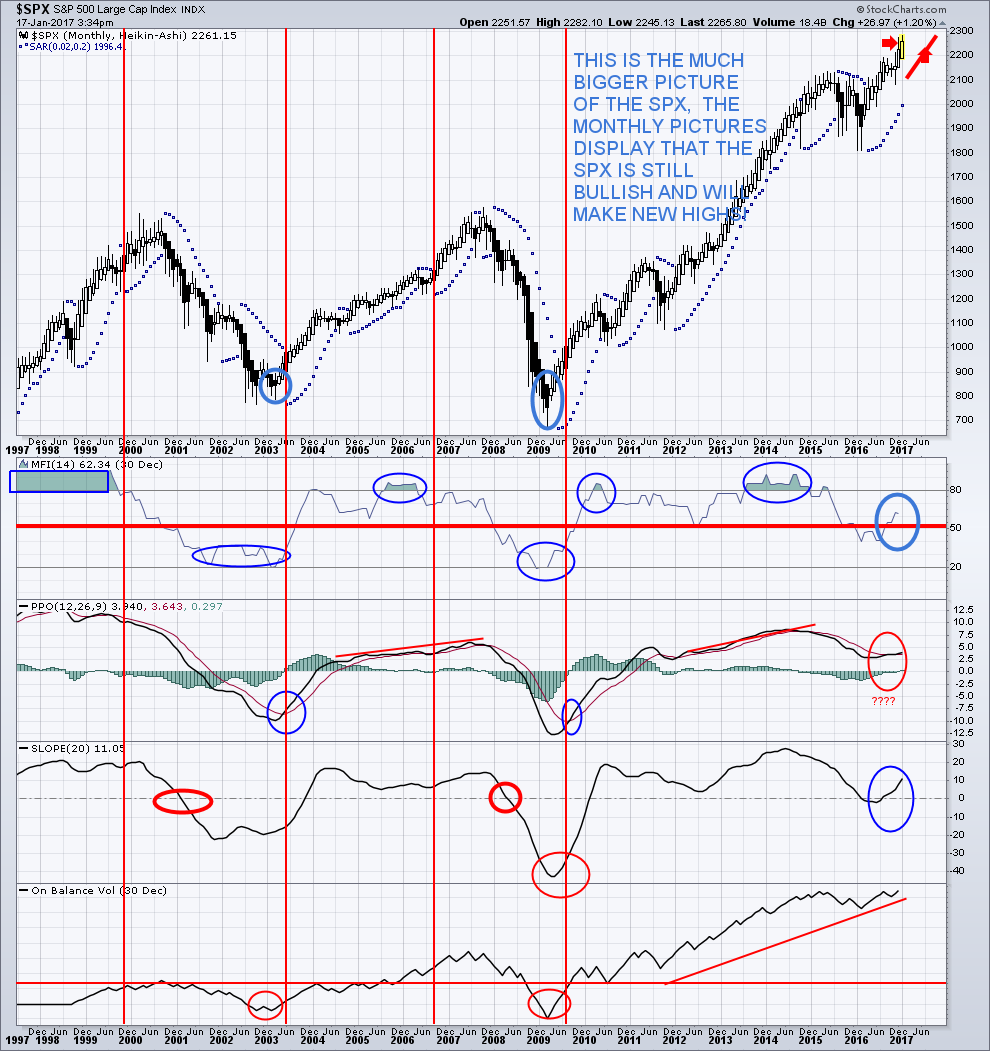
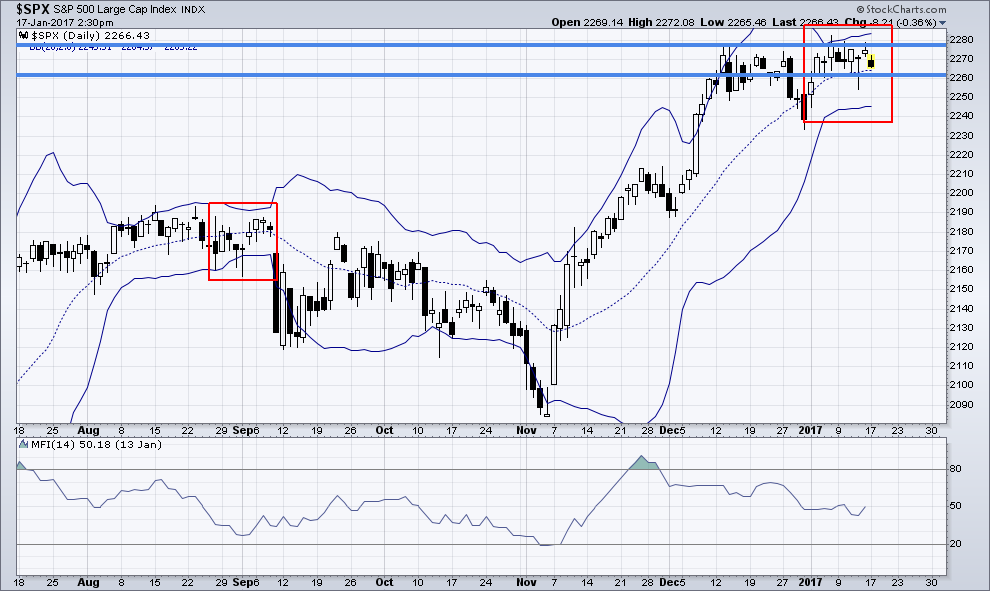
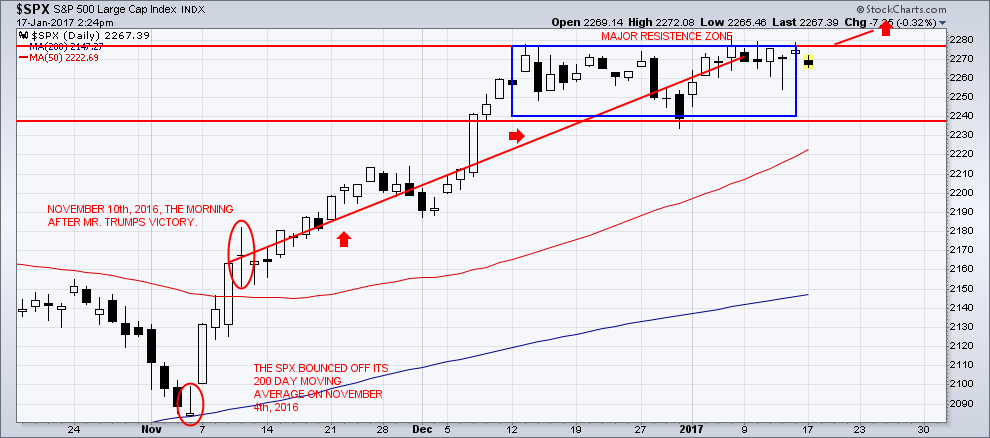
When the SPX breaks out above its’ current resistance level, it will be the next leg up in this bull market. We are currently in a consolidation period. The SPX seems to be resting for now!  The “Bollinger Bands Squeeze” is now taking hold and will result in a powerful move in either direction once broken.  I do have a new BULLISH trigger for members to enter into during this amazing “melt up” that will only be shared with my ‘elite members’.   I can assure you that you will want to be invested in this next BULLISH leg of the SPX!


The Next Move UP!

j201

j202


‘Bollinger Bands’ are one of my most preferred tools of technical indicators:

The “Squeeze”,(http://www.investopedia.com/articles/technical/04/030304.asp?lgl=bt1tn-baseline-below-textnote)  occurs during low levels of volatility as the ‘Bollinger Bands’ narrow. These periods of low volatility are followed by periods of high volatility. Therefore, a volatility contraction of the bands can foreshadow a significant advance or decline.  This is one of my best kept secrets of technical analysis, until now!

j203


Financial markets are now awaiting what the new Trump Administration has in store. These markets do not like “uncertainty”. So far, President-elect Trump has announced a direction of deregulation and lowering the tax bracket for corporations and repatriation of all corporate money (http://www.investopedia.com/terms/r/repatriation.asp) that is held overseas in foreign bank accounts.

The ‘ISI Research Study’ revealed that the “U.S. S&P 500 companies now have $1.9 trillion parked outside the country”.  Most likely, said funds will be applied so as to continue the stock buyback program thereby pushing the SPX to new levels that are ridiculously overpriced. Hot money ‘continues to be supporting the rise in equity markets. I share some of these hot money sectors and stock on my StockCharts.com public list!


Trump’s Victory Speech on November 9th, 2016:

“We are going to fix our inner cities and rebuild our highways, bridges, tunnels, airports, schools, hospitals. We’re going to rebuild our infrastructure, which will become, by the way, second to none. And we will put millions of our people to work as we rebuild it. We will also finally take care of our great veterans”.


Chart of the SPX “melt-up’:

j204

Are there too many happy investors?

The U.S. stock markets have been on a run since the U.S. Presidential election last November 9th, 2016.

U.S. stocks continue to see signs of “optimistic extremes”. The risk of buying on emotional decisions is still currently high.

There is no interest in shorting. The number of shares sold short, in hopes of buying them back at a lower price, has collapsed. The SPY fund (https://us.spdrs.com/en/product/fund.seam?ticker=SPY), short interest is the lowest since the summer of 2007.  Individual stocks are also showing a lack of short sales which, in turn, removes a pool of potential buying interest. A “de-trended” version of the short interest ratio has dropped to a level that has led to negative returns for stocks which will happen, but likely not for many month yet. The market is likely to grinding higher before a big correction takes place.

A new high presented itself on a day that the jobs report missed expectations. On January 6th, 2017, the jobs report came in less than what economists’ expectations were.  However, the SPX powered to a new high of 2276.06.  This may seem like good news, but during prior times that this occurred, stocks usually pulled back over the following weeks.

Stocks have drifted higher even after optimism reached an extreme. ‘Dumb Money Confidence’ exceeded 80% but the SPX has added on more gains without any kind of pullback. This type of buying pressure, after an extreme optimism sentiment, has previously occurred only a handful of times. It has usually led to losses as the late buyers became “exhausted”.


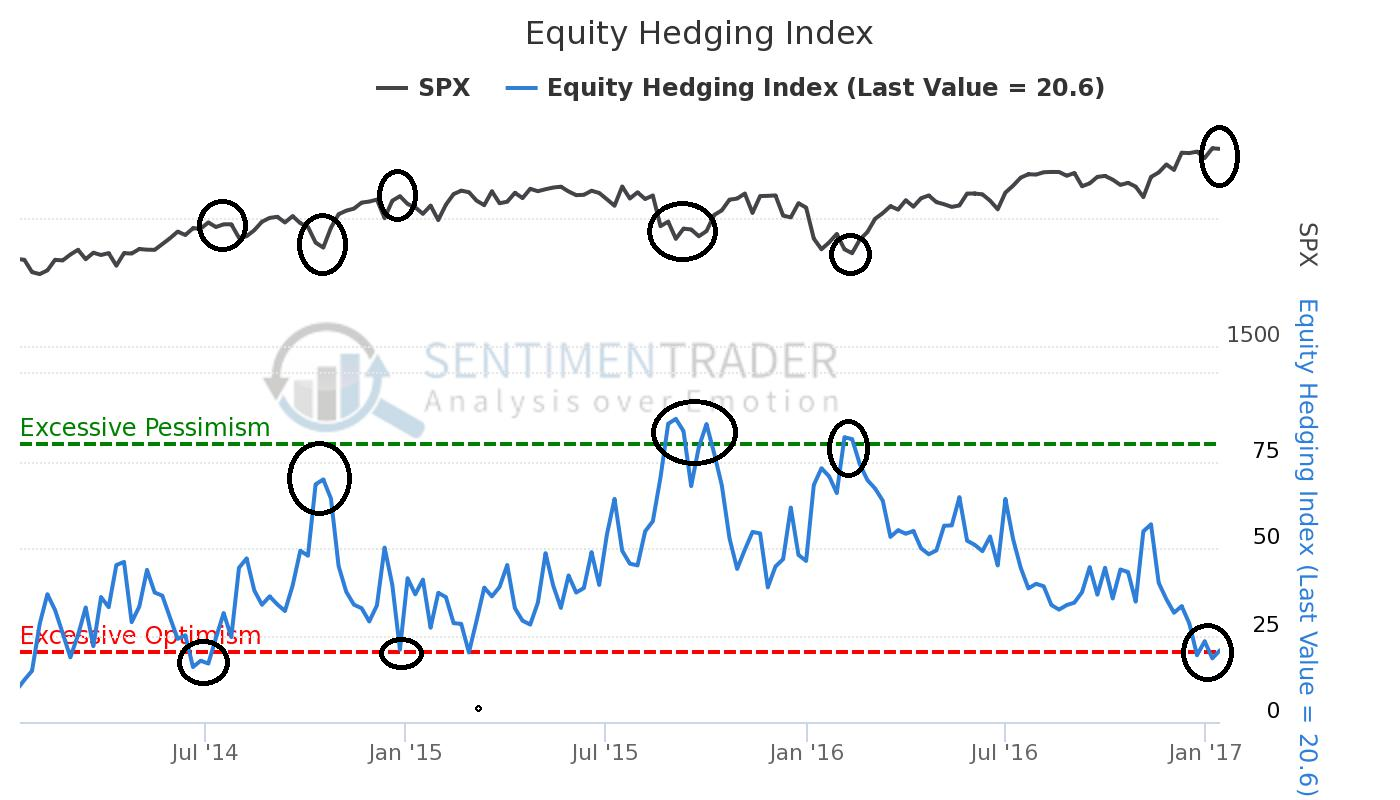
Investor confidence is so High they see no need to hedge their positions:

The Equity Hedging Index has declined to its’ lowest level in nearly two years, showing a lack of interest in the various ways that investors use to protect themselves from possible market declines.

j205

This chart is a contrary indicator. The higher the Equity Hedging Index, the more likely it is that stocks will rally going forward.  The lower the Equity Hedging Index, the less likely that stocks will rally.


                                                                                                              Conclusion:

Hopefully, Trump’s business experience will translate well into his new position. It is certainly my hope that he is as successful as possible. Even during the campaign Trump spoke about how stocks were in a giant ‘bubble’.  This euphoria that we have felt, since his election victory, has made that ‘bubble’ even larger. Throughout U.S. history, every ‘giant financial bubble’ has always ended very badly, and this time around will not be an exception. Trump may get the blame for it when it bursts, but the truth is that the conditions for the coming crisis have been building for a very, very long time.

I expect the stock market to stall out mid way this year in June/July at which point things could turn south. If you want to follow me live at StockTwits.com

Join my free trading newsletter at www.TheGoldAndOilGuy.com

Chris Vermeulen