Posts

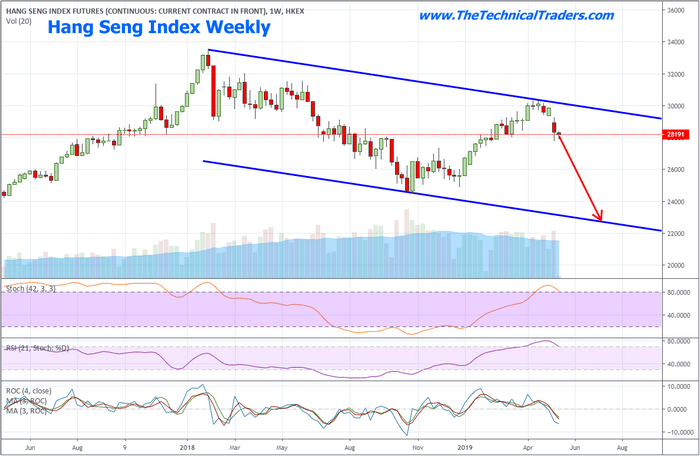
In PART I of this report we talked about and showed you the charts of the Hang Seng and DAX index charts and what is likely to unfold. In today’s report here we touch on the US markets. As we’ve suggested within our earlier research posts this year, US election cycles tend to prompt massive price rotations when the election cycles are intense.  For example, the 2000 election of George W. Bush prompted a very mild price rotation in 1999~2000.  This was likely because the transition from Clinton to Bush II was not overly contentious.  The 2008 election of Barrack Obama was a moderately contested election cycle and happened at the time of the biggest credit market collapse in modern history – thus, the markets were well on their way lower 12+ months before the elections.  The 2012 election cycle showed moderate price rotation as it was a highly contested election event in the US.  The 2015-16 election event was highly contested as well and the price rotation near this time appears longer and deeper than the 2012 event.

Now, in 2020, we have one of the biggest, most highly contested US election cycles in recent history unfolding and we have already begun to see a price range /rotation over the past 12+ months that suggests we could see even bigger price rotation.  If we add into this mix the US/China trade issues, global market concerns, US political rhetoric, and other issues, we have a recipe for A BIG MOVE setting up.


Our analysis still suggests that we are poised for an attempt at fresh new all-time highs before any massive price rotation takes place (near the upper trend line).  Yet, we believe the downside price rotation is an eventual component of the next 16+ months of the US election cycle and the future price advance that should take place in the near future.  In other words, we believe the markets are setting up for a bigger shake-out throughout this election cycle/trade issue event that will prompt lower prices before the end of 2019.  We do believe the markets will settle and resume an upward trend bias after this downside price rotation – yet we don’t know exactly when that will happen.


To the best of our ability to predict the future, we can state this at the moment.  It appears the end of 2019 will be filled with large price rotation – likely to the downside as trade issues and election/political issues cause a “shock-wave” in the markets.  We believe early 2020 will see a relief rally that may setup a bigger price move throughout the remainder of 2020.  Right now, traders need to be prepared for an incredible increase in volatility and price rotation.  It is very likely that we will see a VIX level above 40 at some point before the end of 2019.  This is a time for skilled traders to get in, get profits and get out.  Position trading over the next 12+ months will be very difficult.

For active swing traders, you are going to love our daily trading analysis. On May 1st we talked about the old saying goes, “Sell in May and Go Away!” and that is exactly what is happening now right on queue. In fact, we closed out our SDS position on Thursday for a quick 3.9% profit and our other new trade started Thursday is up 18% already.

Second, my birthday is only three days away and I think its time I open the doors for a once a year opportunity for everyone to get a gift that could have some considerable value in the future.

Right now I am going to give away and shipping out silver rounds to anyone who buys a 1-year, or 2-year subscription to my Wealth Trading Newsletter. I only have 5 left as they are going fast so be sure to upgrade your membership to a longer-term subscription or if you are new, join one of these two plans, and you will receive:

1-Year Subscription Gets One 1oz Silver Round FREE
(Could be worth hundreds of dollars)

2-Year Subscription Gets TWO 1oz Silver Rounds FREE
(Could be worth a lot in the future)

I only have 5 more silver rounds I’m giving away
so upgrade or join now before its too late!

SUBSCRIBE TO MY TRADE ALERTS AND GET YOUR FREE SILVER ROUNDS!

Happy May Everyone!

Chris Vermeulen

It is becoming evident that the US/Chinese trade issues are going to become a point of contention for the markets going forward.  We’ve been review as much news as possible in an attempt to build a consensus for the future of the US markets and global markets.  As of last week, it appears any potential trade deal with China has reset back to square one.  The news we are reading suggests that China wants to reset their commitments with the US, remove all tariffs and wants the US to commit to buying certain levels of Chinese goods in the future.  Additionally, China has yet to commit to stopping the IP/Technology theft from US companies – which is a very big contention for the US.

This suggests the past 6+ months of trade talks have completely broken down and that this trade issue will likely become a market driver over the next 12+ months.  The global markets had anticipated a deal to be reached by the end of March 2019.  At that time, Trump announced that he was extending talks with China without installing any new tariffs.  The intent was to show commitment with China to reach a deal at that time – quickly.

It appears that China had different plans – the intention to delay and ignore US requests.  It is very likely that China has worked to secure some type of “plan B” type of scenario over the past 6+ months and they may feel they are negotiating from a position of power at this time.  Our assumption is that both the US and China feel their interests are best served by holding their cards close to their chests while pushing the other side to breakdown through prolonged negotiations.

Our observations are that an economic shift is continuing to take place throughout the globe that may see these US/China trade issues become the forefront issue over the next 12 to 24 months – possibly lasting well past the November 2020 US Presidential election cycle.  It seems obvious that China is digging in for a prolonged negotiation process while attempting to hold off another round of tariffs from the US.  Additionally, China is dealing with an internal process of trying to shift away from “shadow banking” to eliminate the risks associated with unreported corporate and private debt issues.

The limited, yet still valid, resources we have from within China are suggesting that layoffs are very common right now and that companies are not hiring as they were just a few months ago. One of our friends/sources suggested the company he worked for has been laying off employees for over 30 days now and he just found out he was laid-off last week.  He works in the financial field.

We believe the long term complications resulting from a prolonged US/China trade war may create a foundational shift within the global markets over the next 16 to 24+ months headed into the November 2020 US Elections.  We’ve already authored articles about how the prior 24 months headed into major US elections tend to be filled with price rotation while an initial downside price move is common within about 16+ months of a major US election event.  This year may turn out to prompt an even bigger price rotation.

US Stock Market volatility just spiked to levels well above 20 – levels not seen since October/November 2018, when the markets fell nearly 20% before the end of 2018.  The potential for increased price volatility over the next 12+ months seems rather high with all of the foreign positioning and expectations that are milling around.  It seems like the next 16+ months could be filled with incredibly high volatility, price rotation and opportunity for skilled traders.

Our primary concern is that the continued trade war between the US and China spills over into other global markets as a constricted price range based trading environment.  Most of the rest of the world is still trying to spark some increased levels of economic growth after the 2008-09 market crisis.  The current market environment does not settle well for investor confidence, growth, and future success.  The combination of a highly contested US Presidential election, US/China trade issues, a struggling general foreign market, currency fluctuations attempting to mitigate capital risks and other issues, it seems the global stock markets are poised for a very big increase in volatility and price rotation over the next 2 years or so.

Our first focus is on the Hang Seng Index.  This Weekly chart shows just how dramatic the current price rotation has been over the past few weeks and how a defined price channel could be setting up in the HSI to prompt a much larger downside objective.  Should continue trade issues persist and should China, through the course of negotiating with the US, expose any element of risk perceived by the rest of the world, the potential for further price contraction is very real.  China is walking a very fine line right now as Trump is pushing issues (trade issues and IP/Technology issues) to the forefront of the trade negotiations.  In our opinion, the very last thing China wants is their dirty laundry, shady deals and political leadership strewn across the global news cycles over the next 24+ months.


The DAX Weekly Index is showing a similar price pattern.  A very clear upper price trend channel which translates into a very clear downside price objective is price continues lower.  Although the DAX is not related directly to the US/China trade negotiations, the global markets are far more interconnected now than ever before.  Any rotation lower in China will likely result in a moderate price decrease in many of the major global market indexes.


As we’ve suggested within our earlier research posts, US election cycles tend to prompt massive price rotations when the election cycles are intense. In our next post PART II of this report, we talk about what happened in the past election cycles reviewing the monthly charts and weekly SP500 index charts which are very telling in what could be about to happen next for the stock market from an investors standpoint.

For active swing traders, you are going to love our daily trading analysis. On May 1st we talked about the old saying goes, “Sell in May and Go Away!” and that is excactly what is happening now right on queue. In fact, we closed out our SDS position on Thursday for a quick 3.9% profit and our other new trade started Thursday is up 18% already.

Second, my birthday is only three days away and I think its time I open the doors for a once a year opportunity for everyone to get a gift that could have some considerable value in the future.

Right now I am going to give away and shipping out silver rounds to anyone who buys a 1-year, or 2-year subscription to my Wealth Trading Newsletter. I only have 7 left as they are going fast so be sure to upgrade your membership to a longer-term subscription or if you are new, join one of these two plans, and you will receive:

1-Year Subscription Gets One 1oz Silver Round FREE
(Could be worth hundreds of dollars)

2-Year Subscription Gets TWO 1oz Silver Rounds FREE
(Could be worth a lot in the future)

I only have 13 more silver rounds I’m giving away
so upgrade or join now before its too late!

SUBSCRIBE TO MY TRADE ALERTS AND GET YOUR FREE SILVER ROUNDS!

Happy May Everyone!

Chris Vermeulen


Stay tuned for PART II next!


Now that most of the US Major Indexes have breached new all-time price highs, which we called over 5+ months ago, and many traders are starting to become concerned about how and where the markets may find resistance or begin to top, we are going to try to paint a very clear picture of the upside potential for the markets and why we believe volatility and price rotation may become a very big concern over the next few months.  Our objective is to try to help you stay informed of pending market rotation and to alert you that we may be nearing a period within the US markets where increased volatility is very likely.

Longer term, many years into the future, our predictive modeling systems are suggesting this upside price swing is far from over.  Our models suggest that price rotation will become a major factor over the next 12 to 15+ months – headed into the US Presidential election cycle of November 2020.  Our models are suggesting that the second half of this year could present an incredible opportunity for skilled investors as price volatility/rotation provide bigger price swings.  Additionally, our models suggest that early 2020 will provide even more opportunity for skilled traders who are able to understand the true price structure of the markets.  Get ready, thing are about to get really interesting and if you are not following our research or a member of our services, you might want to think about joining soon.

We are focusing this research post on the NQ, ES and YM futures charts (Daily).  We will include a longer-term YM chart near the end to highlight longer-term expectations.  Let’s start with the NQ Daily chart.

The NQ Daily chart, below, highlights our ongoing research, shows the 2018 deep price rotational low and the incredible rally to new all-time highs recently.  The most important aspect of this chart is the “Upside Target Zone” near the $8040 level and the fact that any rally to near these levels would represent an extended upside price rally near the upper range of the YELLOW price channel lines.  We believe any immediate price rotation may end near the $7500 level (between the two Fibonacci Target levels near $7400 & $7600) and could represent a pretty big increase in price volatility.


This ES Daily chart highlights the different in capabilities between the NQ and the ES.  While the NQ is already pushing into fairly stronger new price highs, the ES is struggling to get above the Sept/Oct 2018 highs and this is because very strong resistance is found between $2,872 and $2,928.  It is very likely that the price volatility will increase near these highs as price becomes more active in an attempt to break through this resistance.  It is also very likely that a downside price rotation may happen where price attempts to retest the $2,835 level (or lower) before finally pushing into a bigger upside price trend.  The Upside Target Zone highs are just below $3,000.  Therefore, we believe any move above $2,960 could represent an exhaustion top type of price formation.


This YM chart is set up very similarly to the ES chart.  Historical price highs are acting as a very strong price ceiling.  While the NQ is already pushing into fairly stronger new price highs, the YM continues to struggle to get above the Sept/Oct 2018 highs and this is because very strong resistance is found between 25,750 and 27,000.  Please take notice of the very narrow resistance channel (BOX) on this chart that highlights where we believe true price support/resistance is located.  We believe it is likely that a downside price rotation may happen where price attempts to retest the $26,000 level (or lower) before finally pushing into a bigger upside price trend.


As you can tell from our recent posts and this research, we believe price volatility is about to skyrocket higher as price rotates downward.  Our predictive modeling systems are suggesting that we are nearing the end of this current upside move where a downward price move will establish a new price base and allow price to, eventually, push much higher – well above current all-time high levels.

We’ve issued research posts regarding Presidential election cycles and how, generally, stock market prices decline 6 to 24 months before any US Presidential election.  We believe this pattern will continue this year and we are warning our followers to be prepared at this stage of the game.  No, it will not be a massive market crash like 2008-09.  It will be a downside price rotation that will present incredible opportunities for skilled traders.  If you want more of our specialized insight and analysis, then please visit www.TheTechnicalTraders.com to learn how we help our members find success.

Lastly, we’ve included this Weekly YM chart to show you just how volatile the markets are right now.  Pay very close attention to the Fibonacci Target Levels that are being drawn on this chart.  The downside target levels range from $16,000 to $21,060.  The upside target levels range from $30,000 to $32,435.  Top to bottom, The Fibonacci price modeling system is suggesting a total volatility range of over $16,000 for the YM Weekly chart and this usually suggests we are about to enter a period of bigger price rotation and much higher price volatility.


Right now, we suggest that you review some of our most recent posts to see how we’ve been calling these market moves, visit www.TheTechnicalTraders.com/FreeResearch/.  It is important for all of our followers to understand the risks of being complacent right now.  The markets are about to enter a period of about 24+ months where incredible opportunities will become evident for skilled traders. If you know what is going to happen, you can find opportunities everywhere.  If not, you are going to be on the wrong side of some very big moves.

Chris Vermeulen

One of the most important things about making calls about any future price movement is to have confidence in your research team and systems.  The second most important thing is to make these calls public so everyone can see if you were right or wrong about your predictions.  Predicting the future, often many months in advance, is not an easy task.  We like to ask people, how many people do you know that can predict something in the future, almost to the exact day, and find they were accurate more often than being wrong?

Well, this is the time we’ll see if our predictions are accurate or not.  Back in October 2018, we issued a research post indicating that Gold would rally above $1300, then stall, then set up a momentum base between $1260 and $1275 near mid-April or early May.  Here is a link to that public post: https://www.thetechnicaltraders.com/45-days-until-a-multi-year-breakout-for-precious-metals/

In February/March 2019, our research team honed in on the April 21~24 dates as a key cycle date for a very likely momentum bottom setup.  You can read our research here.  We believe these dates will be key to the future rally in Gold and they may very well be the last time we see sub-$1300 price levels for a while, but gold does need to reverse to the upside this week.

Currently, Gold is trading at $1278.10 with a recent low at $1273.  Remember our original prediction that the momentum base would likely setup between $1260 and $1275?  Right now, we believe this Momentum base is setting up exactly as we predicted back in October 2018 – over 6 months ago.

As we continue to watch this Momentum Base setup play out, we urge skilled traders to watch the outlying symbols for signs of confirmation and validation.  The news about the Iran Oil Sanctions, today, may become a key element going forward – but it is too early to tell right now.  We believe some global economic event will drive prices of Gold much higher over the next 30+ days.

Gold has moved lower over the past 30+ days from the $1340 level down to near the $1270 level – just as we predicted as well.  The timing of this recent downswing in price is perfect for our April 21~24 Momentum Base call.  We do believe there is still a chance that a $1255 to $1260 level may be seen this week or next.  The Momentum Bottom/Basing formation may form over a 7 to 10+ day range.  So, pay attention to these opportunities in Gold over the next few days and weeks.

NUGT (3x gold miners bull ETF) continues to fall as Gold Bases.  In fact, NUGT has fallen to levels that we have not seen since January 2019.  The reality of the matter is that NUGT may be the best confirmation tool/symbol we have right now for timing the end of our Momentum Base in Gold.  When NUGT rotates higher and forms the base, it will very likely mark the end of weaker prices for the entire precious metals sector and the beginning of the upside price rally we have been predicting.

As our research team likes to state – this is “do or die” time with regards to our predictions from many months ago.  We’ve stuck by them for months, telling anyone who would listen this setup would be the last time you see sub-$1300 levels in Gold for many months – possibly years.  If our analysis is correct, we suggest you pay attention to these symbols and lower Gold price levels right now.  Once this move begins to rally, it could take the markets by surprise.

Our expectations are that by mid-May, or so, we should already be in an upside price swing that should be targeting the $1450 to $1550 level.  This means we have about 7 to 15 trading days until we start to see some real upside price move in precious metals.

We should remind you that gold needs to find a bottom this week and price could become choppy and volatile.

Get ready and follow our research.  How many other research firms do you know that are capable of calling the markets 6+ months in advance with this type of accuracy?

Please visit www.TheTechnicalTraders.com to learn how we can help you find and execute better trades for your future.

Chris Vermeulen