Posts

Our research team has identified a potential trade setup in QID that correlates to our ongoing analysis of the US stock market and our Advanced Fibonacci Price Amplitude Arcs.  We believe a major price inflection point is setting up in the US stock market within the next 48 hours that may prompt a price trend reversal in the NASDAQ and other major US stock market indexes.  This pattern correlates to a much longer-term Head-n-Shoulders pattern that is also setting up in the SPY.

Our belief is that technical traders should wait for confirmation of this setup before entering any new trades, yet we believe we will have confirmation of this setup within 3 to 5 trading days – given the urgency of the setup with our Fibonacci Price Amplitude Arcs.  We believe a right-shoulder could be forming as the US stock markets push a bit higher in early trading this week. We believe the Fibonacci Price Acr’s are suggesting a major inflection point is preparing to disrupt price trends.

Just to be clear, this is a prediction, and as technical traders, we wait for confirmation before trading. This is the #1 issue with most traders. They jump the gun and buy into a trade idea before the price chart has confirmed and they lose a lot of money. Follow price, don’ try to lead it.

If our analysis is correct, we may see a fairly strong trend reversal over the next 5+ trading days as this pattern/setup complete and confirm.

Before you continue, be sure to opt-in to our free-market trend signals
before leaving this page, so you don’t miss our next special report & signal!

DAILY QID (INVERSE NASDAQ ETF) CHART

This Daily QID chart highlights the major RED Fibonacci Price Amplitude Arc that is setting up as well as the more narrow MAGENTA Arc.  Both of these arcs are aligning very close to one another.  Additionally, the RSI suggests any trend reversal to the upside could prompt a moderately large upside price trend.

NAS100 DAILY CHART

This NAS100 Daily chart highlights the right-shoulder of a longer-term price pattern that we believe may be ending soon.  If our analysis is correct, the right-side of the Head-n-Shoulders pattern may set up near the PURPLE Arc on this chart (or soon after) – prompting a broad downside price trend in the US stock market.

LONGER-TERM WEEKLY SPY CHART

This longer-term Weekly SPY chart shows the Head-n-Shoulder setup that is forming in the SPY.  Although the right side of the shoulder is rather short and volatile, we believe this setup may be a fairly strong potential pattern warning of a stronger downside price trend that may initiate soon.  Obviously, 240 (previous lows) would be an easy objective in the SPY if this happens.

CONCLUDING THOUGHTS

Current price levels suggest a resistance level has been reached.  If this resistance level persists in containing price and creates a Head-n-Shoulders pattern, there is a very strong likelihood that a broader downside price move may present real opportunities for profits.  Skilled traders should prepare for this potential and watch for confirmation of this pattern/setup.

If you are using our free public research for your own trading decision-making and/or using it as an opportunity to find and execute successful trades, please remember you are the one ultimately making the decisions to trade based on our interpretation and free research posts.  We, as technical traders, will continue to post new research articles and content that we believe is relevant to the current market setups.

If you want to improve your accuracy and opportunities for success, then we urge you to visit www.TheTechnicalTraders.com to learn how you can enjoy our research and our members-only trading triggers (see the first chart in this article).  If you are managing your retirement account or 401k, then we urge you to visit www.TheTechnicalInvestor.com to learn how to protect your assets and grow your wealth using our proprietary longer-term modeling systems.  Our goal is to help you find and create success – not to confuse you.

Our researchers will generate free research on just about any topic that interests them.  As technical traders, we follow price, predict future price moves, tops, bottoms, and trends, and attempt to highlight incredible setups that exist on the charts.  What you do with it is up to you.  Visit www.TheTechnicalTraders.com/FreeResearch/ to review all of our detailed free research posts.

In closing, we would like to suggest that the next 5+ years are going to be incredible opportunities for skilled traders.  Remember, we’ve already mapped out price trends 10+ years into the future that we expect based on our advanced predictive modeling tools.  If our analysis is correct, skilled traders will be able to make a small fortune trading these trends and Metals will skyrocket.  The only way you’ll know which trades to take or not is to become a member.

Chris Vermeulen
Chief Market Strategist
Founder of Technical Traders Ltd.

For many years now, metals traders and enthusiasts have been patiently waiting for the move in Silver that we feel its eventually going to happen.

There is almost a ritual process in the metals market that takes place when a crisis happens.  We’ve written about this in a past article and we’ve highlighted how we believe Silver is one of the absolute best opportunities if/once it breaks out.  It goes something like this…

A.  Silver is often an overlooked “little cousin” to other precious metals like Gold and Platinum.  Many traders would rather trade/acquire Gold vs. Silver.

B.  When a crisis begins to happen, both Gold and Silver tend to collapse an initially as the shock to the markets translates into sales of precious metals to improve cash/margin requirements.

C.  As the crisis continues to unfold, Gold will typically begin a sustained upside price move over many months where Silver may move very little to the upside.  This creates a massive peak in the Gold to Silver ratio.

D.  Then, suddenly Silver starts to rally upward faster than Gold and the Gold to Silver ratio begins to collapse.  Gold continues to move higher throughout this process, but Silver is already rallying much stronger than Gold.

This is the breakout move in Silver that we believe may be happening right now and may continue for many months or years into the future.  Allow us to explain this setup in more detail.

Before you continue, be sure to opt-in to our free-market trend signals
before leaving this page, so you don’t miss our next special report & signal!

SILVER DAILY CHART

First, we believe an extended FLAG formation in Silver has recently completed and we believe this price wedge type of pattern will prompt a renewed upside price trend in Silver prices over the longer-term given a number of factors that many skilled traders have failed to appreciate.  Technically, a price advance from current levels to levels above $21 will prompt a big shift in thinking for Silver traders.  These new highs will suggest Silver has finally broken above the previous $20 price highs and could be skyrocketing higher as it did in 2010~12.

SILVER WEEKLY CHART

This Weekly Silver chart shows exactly why we believe this Flag Breakout could prompt a major upside price rally in both Gold and Silver.  The downside price rotation that took place after the February 2020 global COVID-19 virus event prompted a vast rethinking of value and risk.  While Gold found support fairly early, suggesting skilled traders were moving away from risk and into safe-havens, Silver has stalled below $16.50 recently.  We believe this ”second-class” status for Silver is about to end in a very big way.  Follow along.

GOLD TO SILVER RATIO WEEKLY CHART

The Flag formation setup on the Daily and Weekly Silver charts is almost like the Starting Line of an incredible upward price event.  The COVID-19 price collapse did what it was supposed to do, deflate expectations related to future market valuations and shift investor consideration of Metals for a short period of time.  As risks accelerated and equity trades were put at risk, metals sold off as traders liquidated metals positions to cover risk exposure in Equities or another market.  Now that the risk event has taken place and metals are transitioning back towards a safe-haven solution again, a new process begins – the upside advance in Gold and Silver which takes the Gold To Silver Ratio back down below 65~75.

Looking back at the 2008~09 Credit Crisis and the current COVID-19 crisis event, we can see Gold is already trading at levels which are very high compared to the peak levels in 2011 (almost 4 years after the 2008 Credit Crisis).  We can also see that the Gold: Silver Ratio has reached the 120 level on this chart – which is incredibly nearly 41% higher than the peak levels in 2008.  Comparatively, the Gold:Silver Ratio collapsed 60% from 2008 to 2011 while Gold skyrocketed from $720 to $1870 (259%).  A similar move from current Gold price levels would suggest Gold could rally well above $4,500 over the next 2+ years.

Now, how does this relate to Silver?  In 2008, Silver was trading near $9.75 just before the peak in the Gold:Silver Ratio was reached.  By 2011, Silver had reached levels above $48.25 – an incredible 495% price increase.  This suggests Silver could rally from current levels, near $15.75 to levels above $78 (or higher) if our analysis is correct.  What are we expecting to happen next?

If our research is correct, we will see an upside price move in Silver to levels above $21 to $23 over the next three to five+ weeks.  At the same time, Gold will likely rally to levels near $1999~$2100.  This simultaneous price rally in both Gold and Silver should prompt the Gold:Silver ratio to stay rather elevated.  But the next move in Silver, above $25~$30, should push the Gold:Silver Ratio below 100 from current high levels – which would collapse the RSI level showing us the longer-term price rally in Gold and Silver has confirmed.

Every time the Gold:Silver Ratio collapses substantially, more than 35 to 40 RSI points after the Gold:Silver Ratio reached new high levels, this indicates a price rally in Gold and Silver is beginning.  You can see how often this setup qualifies and confirms over the past 30+ years on the chart below.  We’ve highlighted the uptrends in Silver in GREEN.

LONG-TERM HISTORICAL GOLD TO SILVER RATIO WEEKLY CHART

CONCLUDING THOUGHTS:

We believe the current FLAG formation breakout in Silver is the beginning of a much larger upside price trend that is just beginning.  Over the next few weeks and months, we believe Silver will begin an upside price advance that could last 12 to 24+ months and present an incredible opportunity for technical traders who follow price action.

If you are using our free public research for your own trading decision-making and/or using it as an opportunity to find and execute successful trades, please remember you are the one ultimately making the decisions to trade based on our interpretation and free research posts.  We, as technical traders, will continue to post new research articles and content that we believe is relevant to the current market setups.

If you want to improve your accuracy and opportunities for success, then we urge you to visit www.TheTechnicalTraders.com to learn how you can enjoy our research and our members-only trading triggers (see the first chart in this article).  If you are managing your retirement account or 401k, then we urge you to visit www.TheTechnicalInvestor.com to learn how to protect your assets and grow your wealth using our proprietary longer-term modeling systems.  Our goal is to help you find and create success – not to confuse you.

Our researchers will generate free research on just about any topic that interests them.  As technical traders, we follow price, predict future price moves, tops, bottoms, and trends, and attempt to highlight incredible setups that exist on the charts.  What you do with it is up to you.  Visit www.TheTechnicalTraders.com/FreeResearch/ to review all of our detailed free research posts.

In closing, we would like to suggest that the next 5+ years are going to be incredible opportunities for skilled traders.  Remember, we’ve already mapped out price trends 10+ years into the future that we expect based on our advanced predictive modeling tools.  If our analysis is correct, skilled traders will be able to make a small fortune trading these trends and Metals will skyrocket.  The only way you’ll know which trades to take or not is to become a member.

Chris Vermeulen
Chief Market Strategist
Founder of Technical Traders Ltd.

Silver and silver mining stocks are front and center for investors and active traders. Because of silvers high volatility (large price swings) it naturally attracts a lot of attention.

First you have seasoned investors who are waiting for the right opportunity to get long or short for the next move. Then you have the active traders playing the day to day price swings. Finally you get the gamblers who are salivating over the potential to double their accounts and are riding the commodity on pure emotions (Fear & Greed). All these things compound the volatility for the investment making it headline news and what everyone wants to be involved in.

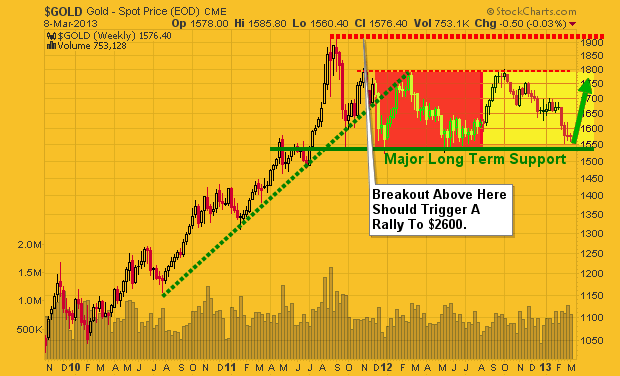
The focus of this report is show you where the price of gold, silver and miner stocks are currently trading and what to lookout for in the coming days/weeks. Below is a chart of gold but silver has a similar pattern and will follow or should I say lead the price of gold in percentage terms because of its volatility.

Gold Weekly Chart:

Gold has been testing its long term support level for three weeks. I expect we see price start to move quickly sooner than later but there is potential for it to tread water here until the second half of April. We all know the saying “Sell in May and Go Away” and as we get closer to that date we should start to see money flow into the “Safe Havens” being gold, silver, and miners. While this has not happened many times on the charts I am thinking beyond them and of what the masses are likely to flock to when stocks lose their luster.

Also if you have been following the price of the dollar index you know that its getting a little overbought and when it starts to correct the falling dollar should help send precious metals higher.

Gold3

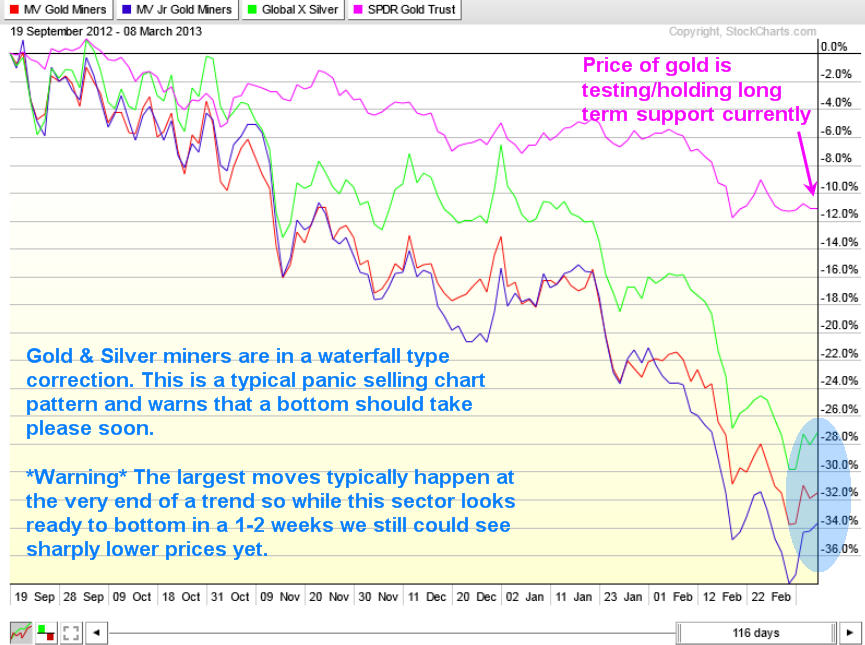
Gold & Silver Miners VS Gold Bullion Performance:

The stock market has certain chart patterns that tell chart readers what the holders of that particular investment is feeling emotionally. Knowing how to read these extreme patterns can yield some big gains and works for most investments types (stocks, bonds, commodities and currencies).

Without getting into the boring technical details precious metal stocks are starting show signs of panic selling which typically happens before a major bottom is put in place. A bottom generally takes a week or two for some type of bottoming pattern or base building to form. This is the most volatile time to be trading these investments so trade with caution.

Gold1


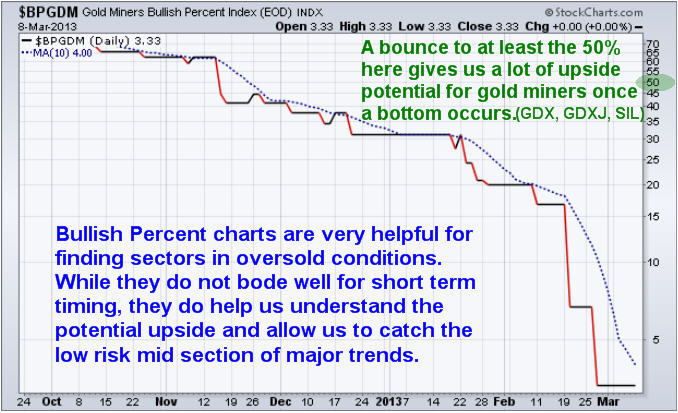
Gold Miners Bullish Percent Index:

Bullish percent indexes are a great way to see how popular an investment is. If you do not know what a bullish percent chart is then you can look it up online and learn more. The way I read it is when it’s up over 75-80 it’s a popular investment and everyone is buying it. It also means it’s in a major uptrend. But you must be aware that when everyone is buying something once price starts to turn down you better be one of the first few out the door before everyone else runs for the door and price crashes.

It’s similar but reversed for investments that are below 20. Everyone is selling, no one wants to own it but once the selling momentum stops price should rebound and rally. Keep in mind this indicator is not great for timing, but confirms that what you are looking at is either oversold, neutral or overbought in the BIG picture.

Gold2


Weekend Precious Metals Trading Conclusion:

In short, I still like gold, silver, and their related mining stocks. I am watching them very closely for signs of a bottom and will be jumping on that train when the selling momentum looks to have stalled. Keep in mind that all these investments are still in a VERY STRONG DOWN TREND and trying to catch a falling knife is not what I do. Waiting for momentum to shift is my focus as there should be big upside if metals and stocks can find a bottom soon. If gold breaks down below key support as posted on the weekly chart then the uptrend may be over and it will be time to start looking for short positions.

You can get my free weekly reports and ideas here: www.GoldAndOilGuy.com

Chris Vermeulen

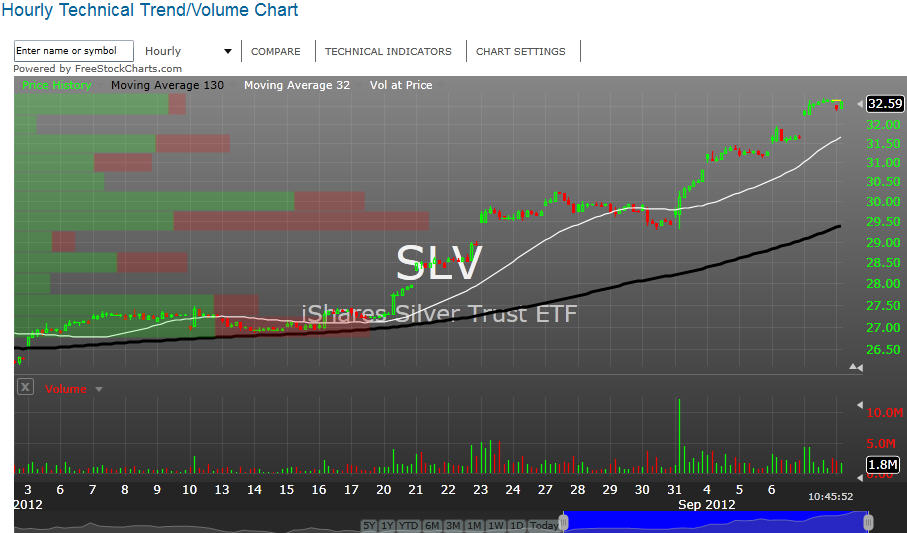
The price of silver reached a 5-month high this past week as investor interest seems to have been rekindled in both gold and silver as belief in financial markets increases that the latest round of monetary easing from the Federal Reserve – QE3 – will soon be on its way. Many investors had largely stayed away from silver in recent months after some had got caught up in its volatility. Silver had touched a 30-year high in April 2011 before plunging 35 percent in a few short weeks.

Now the volatility is back – but on the upside – as prices have climbed more than 20 percent in less than a month. The gains have outpaced that of gold which rose roughly 10 percent during the same time frame. Importantly for investors, the ratio between the two precious metals has moved about 10 percent in silver’s favor since mid-August. This is the first time silver has outperformed gold since the start of 2012.

For non-futures investors, the two precious metals can easily be tracked through the use of exchange traded funds (ETFs). The most liquid ETFs for the two precious metals are the iShares Silver Trust (NYSE Arca: SLV) and the SPDR Gold Shares (NYSE Arca: GLD) respectively.

Silver Bullion Spot Price

Gold Bullion Spot Price

You can take a look at my long term outlook analysis from last week here: http://www.thetechnicaltraders.com/gold-standard-to-be-reinstated-through-the-back-door/

Some may wonder why has silver outperformed gold in the past several weeks? The answer goes deeper than just confidence that QE3 is coming soon, but it is still rather a simple one. The sharp rally in silver was fueled largely by short-covering. That is, some investors (hedge funds, etc.) had made rather large bets that silver would continue falling and were caught off-guard by its recent rise. According to data from the Commodities Futures Trading Commission, the silver market during the week of August 27-31 saw the largest amount of short-covering since May 2011. At the same time. Bloomberg reported that hedge funds were the least bullish on silver in almost four years.

It is unknown for how long silver will outperform gold. But even some long-term fundamental investors such as legendary commodities investor Jim Rogers has said that he believes silver right now is a better investment than gold. He points to the fact that historically gold has been worth about 12 to 15 times what silver is worth, but that recently it has been worth roughly 50 times silver’s value. Silver is also the only major commodity not to have reached a new all-time high in the decade-long commodity bull market and is still cheaper than it was 32 years ago.

So it may be worth a look. But since silver is so volatile, wait for a downward spike before initiating or adding to a long position.

If you would like to get my weekly analysis on precious metals
and the board market join my free newsletter at www.TheGoldAndOilGuy.com

Chris Vermeulen

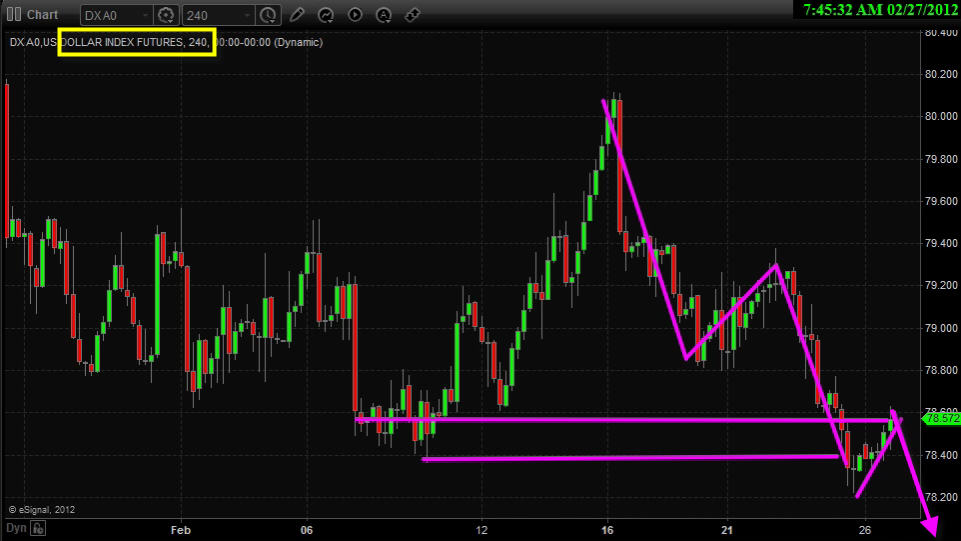
This morning we are seeing the US Dollar index move higher retesting a short term breakdown resistance level. What this means is that the dollar fell below support and is not slowing drifting back up to test the breakdown level. As we all know once a support level is broken it then becomes resistance. So if that holds true with the current move in the dollar we should see stocks and commodities find a short term bottom and continue higher today or tomorrow from the looks of things.

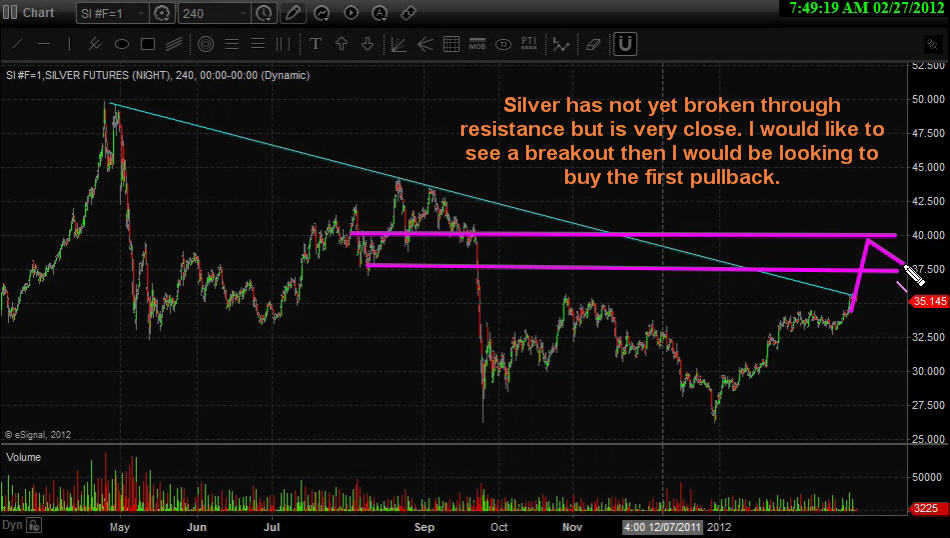
Gold has been pulling back the past couple trading session on light volume which healthy price action. It has done the opposite of what the dollar did above. Gold broke through a key resistance level and is slowly drifting back down to test the breakout level to see if it is support. If so then gold should continue higher in the coming days.


Both silver and gold miner stocks are lagging he price of gold. They have yet to break through their key resistance levels. That being said it could happen an day now as they have both been flirting with that level for a couple trading sessions now.


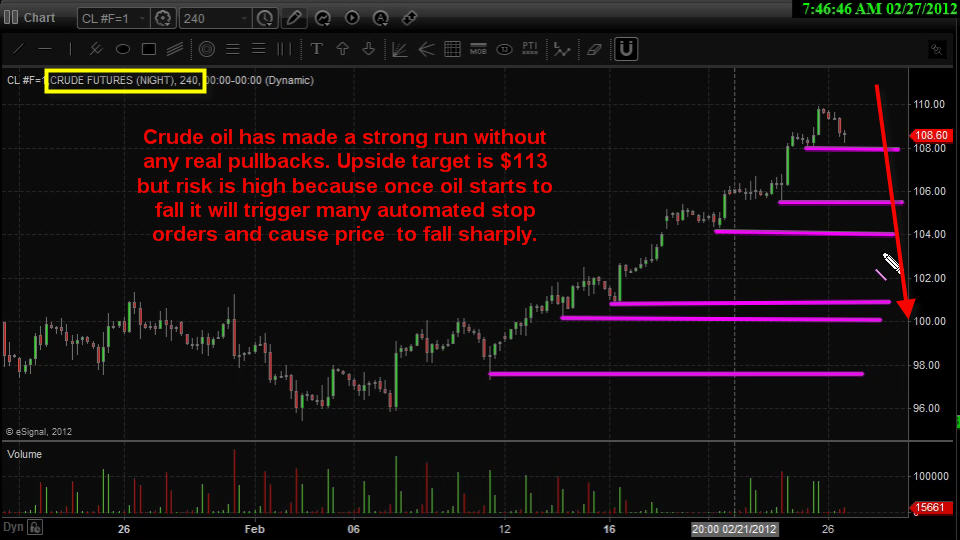
Crude oil continues to hold up strong and is headed straight for its key resistance levels without any real pullback. Chasing price action like this is not something do often because risk: reward is not in your favor. I am staying on the sidelines for oil until I see a setup that has more potential and less risk.

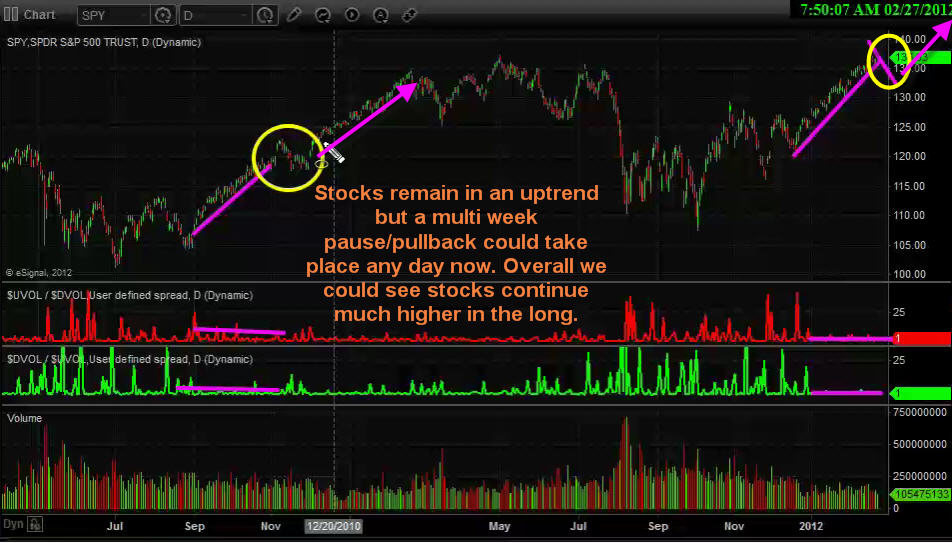
The equities market remains in a strong uptrend at this time. I do feel a 1-3 weeks pause/pullback could take place at any time but in the grand scheme of things we could be only half way through this runaway stock market rally as noted in the video.

The equities market is going to gap down this morning which is typical in a bull market. Remember. in an uptrend the stock market tends to gap lower at the open and close higher into the close. And it’s the opposite in a down trend with stocks gapping higher and sell off through the trading session.

Watch my detailed video analysis for this week: http://www.thetechnicaltraders.com/ETF-trading-videos/

Chris Vermeulen
www.TheGoldAndOilGuy.com

Special Swing Trading Report on Gold, Silver & Oil – CLICK HERE

PRECIOUS METALS

February gold closed higher on Friday as it consolidated some of this week’s decline. The mid-range close sets the stage for a steady opening on Monday. Stochastics and the RSI remain bearish signaling that sideways to lower prices are possible near-term. If February extends this week’s decline, trendline support drawn off the November-December lows crossing near 804.60 is the next downside target. Closes above the 10-day moving average crossing at 865.50 would signal that a low has been posted. First resistance is last Monday’s high crossing at 892.00. Second resistance is October’s high crossing at 938.80. First
support is Wednesday’s low crossing at 836.00. Second support is trading line support crossing near 804.60.

March silver closed higher on Friday due to short covering as it consolidates above the 10-day moving average. The mid-range close sets the stage for a steady opening on Monday. Stochastics and the RSI are neutral to bearish signaling that a short-term top might be in or is near. Closes below the 20-day moving average crossing at 10.908 are needed to confirm that a short-term top has been posted. If March extends the rally off October’s low, the reaction high crossing at 12.230 is the next upside target. First resistance is Monday’s high crossing at 11.770. Second resistance is the reaction high crossing at 12.230. First support is the 20-day moving average crossing at 10.908. Second support is Monday’s low crossing at 10.570. 

ENERGY MARKET
February crude oil closed lower on Friday as it extended Thursday’s breakout below the 10-day moving average crossing at 42.98. Today’s low-range close sets the stage for a steady opening on Monday. The door is open for additional weakness and a possible test of last week’s low. Closes below last Wednesday’s low crossing at 36.94 would temper the near-term friendly outlook in the market. Stochastics and the RSI have turned bearish signaling that sideways to lower prices are possible near-term. If February renews the rally off December’s low, the reaction high crossing at 52.95 is the next upside target. First resistance is the 20-day moving average crossing at 43.34. Second resistance is Tuesday’s high crossing at 50.47. First support is today’s low crossing at 39.38. Second support is last Wednesday’s low crossing at 36.94.