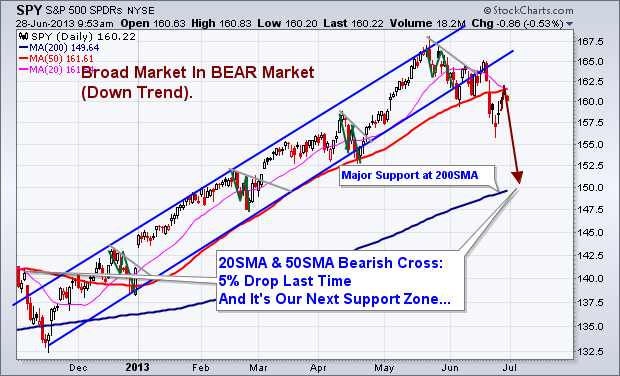
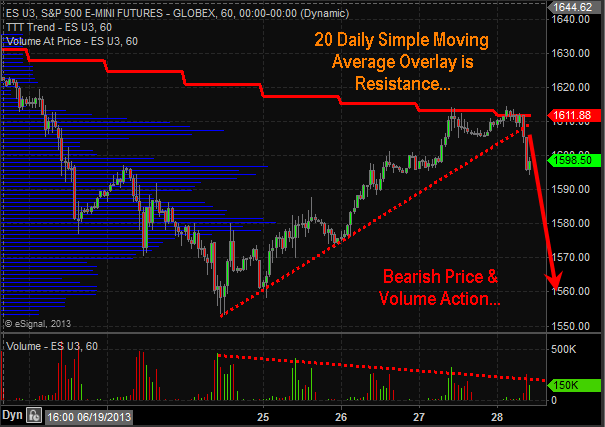
Stocks managed their third session higher as of Thursday June 27th and its too late to jump onto that move. Major indexes and leading stocks have rebounded into resistance along with a few key moving averages. The next 1-3 days favor a pause or pullback at the least simply because of the selling momentum and multiple resistance levels being tested. It is only natural for traders and investors to pull some money off the table or short at these levels.
Stepping back seven days and looking at the overall stock market we have seen a substantial drop in prices across the board. A Ton of stocks have formed their first impulse thrust to the downside which is typically what happens when a stock market is in a topping process (Stage 3 Distribution). The type of damage we had cannot be fixed overnight. This will be a process if it is to resolve to the upside and price action will remain wild (volatile).
The odds from a technical analysis stand point using Price, Momentum, Cycles, Volume and Moving Averages point to lower prices still to come. Actually they point to another 5% drop from the current level.
Major Points to Be Aware Of:
1. 20 Simple Moving Average is crossing below the 50SMA. Last time this took place it triggered a 5% drop in the SP500.
2. Price has bounced for three consecutive days. This typically puts the odds in favor for a pullback.
3. Price bounced and hit it’s head on the 20 and 50 moving averages on Thursday (RESISTANCE).
4. Market Time Cycles are in a decline phase meaning there will be a negative bias and seller will be actively pulling price lower on bounces.
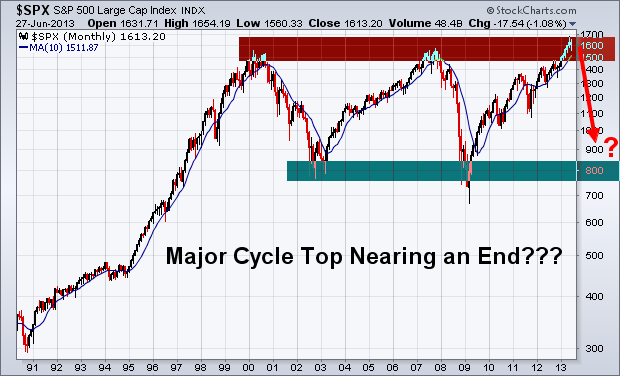
5. Major Long Term Chart looks favorable for a bear market to start which may last 12 months. If so this is just the beginning of some scary yet highly profitable potential trades in the coming year. Stocks fall 3-7 times faster than they rise…
Looking at these charts from a long term, intermediate and short term basis the odds are favoring lower prices. Being short stocks or buying inverse ETF’s is the current play for the market. But analysis and trends are subject to change depending on price and volume action each week. Do not get your heart set on the BIG picture outlook of a yearlong selloff. That could prove to be dangerous. We take this market one bar or candlestick at a time and trade based on current short term analysis.
http://www.thegoldandoilguy.com/wp-content/uploads/2014/11/tgaoglogo.png00adminhttp://www.thegoldandoilguy.com/wp-content/uploads/2014/11/tgaoglogo.pngadmin2013-06-30 10:42:322014-03-05 13:15:04Long or Short Stocks is the Question: I’ve Got the Answer!
I was just interviewed by Mike Swanson of www.wallstreetwindow.com in which we discussed our outlook for the stock market and gold.
You can get on Mike’s free list and see a little bit of what he offers by going here.
You can also download the mp3 audio file for this interview on your computer by clicking hereWITH A RIGHT BUTTON CLICK and selecting SAVE FILE AS from the drop down menu.
I have put together a very detailed video this morning coving bother some long term, short term and market cycles. The video is a little longer than normal but I want you to understand fully where the market is trading and what to look for in the coming days.
Pre-Market Analysis Points:
– Dollar is trading higher this morning which is putting pressure on stocks & commodities.
– Fed Chairman Bernanke Testifies at 10am ET which will cause all investments to move wild.
– Oil is trading slightly lower and oil inventory numbers come out at 10:30am ET.
– Natural gas is flat and continues to build a base at resistance for a possible future breakout.
– Gold, Sold Miners and Silver continue to consolidate within a multi month pattern. A major move is brewing but has not been triggered as of yet.
– Bonds are trading up from yesterday’s close after pulling back from reaching our double top price target on Monday.
– SP500 is nearing a couple resistance levels (previous pivot high, down trend line) Momentum, short term and intermediate cycles are starting to top and that means we should be prepared for a pullback/down trend which could last 4-6 weeks.
http://www.thegoldandoilguy.com/wp-content/uploads/2014/11/tgaoglogo.png00adminhttp://www.thegoldandoilguy.com/wp-content/uploads/2014/11/tgaoglogo.pngadmin2012-07-18 09:01:542012-07-18 09:01:54Stock Market Cycles Are Topping This Week
The term Stock market predictionsis a very controversial topic and does seem to give off a negative/non-credible overtone to most traders, investors and the general public. We all know you cannot predict the market with 100% certainty, but knowing that you can still predict the market more times than not if done correctly. Keep in mind that the term “market prediction” is also known as a market forecast or technical analysis outlook and is nothing more than a estimated guess of where the price for a specific investment is likely to move in the coming minutes, hours, days, weeks and even months.
Getting back on topic, this report clearly shows how the US dollar plays a dominant role in the price of other investments. Understanding how to read the Dollar Index will make you a better trader all around when trading stocks, ETF’s, options or futures.
SP500 Stock Market predictions – 10 Minute Chart: These charts clearly show the inverse relationship between the stock market and the dollar index. Knowing how to read charts (candle sticks, chart patterns, volume etc…) is not enough to give you a winning edge. You must also understand inter-market analysis as all markets are linked together in some way and the dollar plays a major role in where stock prices will move next. Review the charts and comments below on how I came up with my stock market prediction and trade idea.
Most Accurate Stock Market Predictions
Gold Market Prediction – 10 Minute Charts Gold is another investment which is directly affected by the price of the dollar. Review charts for more details.
Gold Market Forecast Procetions
Long Term Stock Market Forecast: The weekly dollar chart is VERY IMPORTANT to watch as a short term trader and long term investor because trend changes in the dollar means you open positions will also likely change direction.
So, if we apply technical analysis to the dollar chart as seen below. You will notice we are able to create a market forecast and predict roughly where price is likely to move and how long it should take to get there. If the dollar can break above the red resistance level then we can expect a rally for 4 – 8 weeks and a price target around the 87-88 level.
If this is the case then stocks and commodities would likely do the inverse price action and move lower, sharply lower…
In short, the next weekly candle stick on the dollar chart could be a game changer for those who are long the overall stock market.
I will admit that the current market conditions are not easy to trade because of all the headline news rolling out of Europe each week along with economic data. And I feel as though we have been tip toeing through a mine field for the past 12+ months waiting for extremely negative news are extremely positive news to trigging a wave of buying or selling that will make our jaw drop, but it has yet to happen. Remember always use stops and don’t get over committed in a headline driven market.
If you would like to receive my free weekly analysis like this, be sure to opt-in to my list: www.GoldAndOilGuy.com
Chris Vermeulen
http://www.thegoldandoilguy.com/wp-content/uploads/2014/11/tgaoglogo.png00adminhttp://www.thegoldandoilguy.com/wp-content/uploads/2014/11/tgaoglogo.pngadmin2012-07-08 14:02:112014-03-06 09:21:50Most Accurate Stock Market Predictions – Next Major Move
All investors can recall the horror during the five months from October 2008 through early March of 2009 as day after day the markets continued to make new lows. That type of catastrophic drop leaves many psychological scars and probably spooked millions of investors out of the stock market for good. To wit, since the March 2009 lows and throughout this new Bull Market Cycle, Investors are pulling money out of equity funds in droves and piling into Bonds. This is the fight or flight mentality taking hold of the herd, and as they continue to disbelieve in the new bull cycle in stocks, the market continues to power higher.
I’ve long been a believer in Elliott Wave Theory, which was developed in the 1930’s by R.N. Elliott. He was a man decades ahead of his time, and to this day his work remains revolutionary in tracking and forecasting market and commodity trends and cycles. This theory forms the basis of my work for market forecasting and trading and investing. While the crowd continues to wait for the next crash, the Elliott wave patterns I’ve been outlining have continued to foretell a bullish move possibly of historic proportions. Taking advantage of this type of move means you need to tune out the noise from CNBC, all of the jobs data, and the negative mantra. Everyone knows that stocks climb a wall of worry, but you have to have a method to let you know to stay long and where best to invest during a super cycle Elliott Bull Wave pattern as we are in now.
My theory back in late February 2009 was that the market was about to bottom and nobody knew it. I wrote an article on 321Gold.com at the time to outline my reasoning and had a chart showing 1200 on the SP 500 as a likely target. At the time the SP 500 was trading around 720 and had not yet completed it’s drop to 666, but was within a few weeks. Interestingly to me anyways, at 666 the SP 500 bottomed and not randomly at all! That 666 figure was an exact 61.8% Fibonacci re-tracement of the 1974 lows to the 2000 highs Bull Cycle. Often crowds act in patterned behaviors that are formed around Fibonacci mathematics. Typical re-tracements are 38%, 50%, 61.8%, or even 78.6%. Combining Elliott Wave patterns with Fibonacci sequences allows me to confirm or help firm up a forecast. That drop over five Fibonacci months completed a multi year cycle from the 2000 highs to the 2009 lows, and it did so right at a clear Fibonacci pivot point. This is why I believe the next many years will be very bullish for stocks, and most investors will not be on board.
Those Fibonacci and Elliott Wave patterns gave me the heads up to start turning bullish, coupled with the sentiment readings which were equally as bearish as the October 2002 bottoms. In addition, there was way too much discussion about deflation. The rubber band in essence was stretched so far to one side on the sentiment gauges and deflation talk, that it would only take a slight shift towards inflation to move stocks much higher.
Fast forward to October 2010, and we now see the ravages of inflation becoming very apparent some 18 odd months later. Gold is at $1350 per ounce, Silver is at $24, the SP 500 is heading back to 1200, Corn, Sugar, Coffee, Copper are all at huge highs. What investor’s don’t understand is stocks are one of your best asset classes in the earlier periods of an inflationary shift, what I would call an inflationary period of prosperity worldwide. Elliott Wave patterns most recently that I outlined on my market forecast service alerted my subscribers to prepare for a massive bull run once the 1094 area on the SP 500 was crossed to the upside.
Given the understanding that inflation would become the new trend, we took multiple positions in Gold stocks and Rare Earth metals stocks ahead of the curve. Some of our recent picks included Hudson Resources at 63 cents in August, now trading at $1.30. Others include BORN at $8, a Chinese Corn based producer of Alcohol that ran to $19 within 7 weeks. We were investing in Rare Earth stocks almost 12 months ago, including REE at $1.80, and it’s now trading over $13.00 a share! Even up to the present time, my ATP service has been positioning our subscribers into Tasman Metals at $1.54, now $2.28 and Quest Rare minerals at $4.10 now $5.50. These moves are happening in stunningly quick periods of time, so being positioned ahead of those moves is crucial.
Gold and Gold stocks have obviously had a very strong move to the upside. Back in August of 2009 I forecasted a massive five year advance in Gold and Gold stocks. This again was entirely based on Elliott Wave patterns I recognized and crowd behavior. Investors will recall the 13 year bull market in tech stocks that started in 1986 when Microsoft went public, and ended in 1999 when AOL was sold to Time Warner for 150 billion. Well, the first five years of the Tech Bull nobody participated except the early investors. Intel and Dell also went public, along with EMC and others. By the time 1991 rolled around, investors kind of woke up and start buying. The problem was they were late, missing the first five years. At that point Tech stocks bucked and kicked up and down with no net gains for three years. Investors gave up again in 1994, and then we began a torrid 5 year rally to 1999. It was not until the last 12 months of that rally that everyone piled in, herd behavior in it’s finest form. Well, we are seeing the same patterns now in the precious metals areas of the market. The final 5 years started in August of 2009, kind of like 1994 in tech stocks. The first 5 years were 2001-2006 where Gold funds returned 30% compounded per year, by the time everyone got on board the funds did nothing for then next three years. Everyone gave up and lost interest, and that was the August 2009 buy signal.
Bringing us full circle, investors continue to shy away from this stock bull market following the five month crash of nearly two years ago. This is exactly the psychology present in an early stage bull market. Going forward from here, I look for the SP 500 to hit 1220 at the top of an Elliott Wave three from the 1040 lows in the summer. That will be followed by a correction pattern and then we will resume the advance to new highs on this bull market stretch from March of 2009. Gold should work it’s way up to $1480-1520 if I’m right on it’s bull move from the $1155 lows this June. Below we have a chart of the SP 500 on a long term basis, and it is currently in the third wave up from the 1010 lows on July 1st. This wave pattern is powerful and should run to at least 1220 intermediately. In time, this multi-year bull market could power to all-time highs and really upset the Bears.
Inflation is taking hold around the world, and stocks are one of your best asset classes to participate. You can follow along by registering for free weekly updates at www.MarketTrendForecast.com
Get Our Free Trading Ideas At Our Twitter feed: http://www.twitter.com/activetrading Some of the recent Tweets have had returns of 30% to 75% within 5-10 days just in the past 30 days or so.
http://www.thegoldandoilguy.com/wp-content/uploads/2014/11/tgaoglogo.png00adminhttp://www.thegoldandoilguy.com/wp-content/uploads/2014/11/tgaoglogo.pngadmin2010-10-20 16:16:332010-10-20 16:16:33Hot Markets and Commodities, yet the small investor continues to miss the run!
May 17th 2010
Back in the third week of April I predicted here on Kitco.com a topping in the broader market indices. The theory was the VIX levels were extremely and historically too low concomitant with extremely high historical readings in investor bullish sentiment gauges. After thirteen Fibonacci months of a bull cycle rally, it was likely an A B C correction to the downside would begin. In further follows ups on TheMarketTrendForecast.com service I run on April 20th, I again outlined concerns with falling volumes on small cap stocks and too many “stories” being run up too far ahead of the economics.
At this point in the Bull market, it is common to have the crowd of investors move from a bias towards viewing all news as positive, to a negative slant on all news. Nothing has changed dramatically on the problems the world had before with Debt and currencies, but the reaction to those events turns negative. This works off the overly optimistic Elliott Wave patterns of the crowd, turning into a typical Zig Zag correction that lasts several months. There will be trading opportunities between that Mid-April topping forecast and my forecast for a bottom around mid-September. However, as recommended in April, Index investors and mutual fund investors should have been moving to the sidelines. I am looking for the SP 500 Index to drop to the 920-970 areas by mid-September before the next leg of the Bull market takes off. Now, the one caveat to that forecast is actually a lot more bullish. If the SP 500 can hold the 1100-1110 areas and pivot up strongly, we could move on to new highs. I put the likelihood of that around 20%, so be on guard. A counter-trend rally up in the next few weeks is highly probable, but the evidence continues to suggest working our way down into the 900’s in the SP 500 before the Bull resumes in earnest. We are selectively buying Gold and Biotech stocks in the Active Trading Partners service as well.
Gold has continued higher confirming my April 20th forecast on The Market Trend Forecast of a move from 1125 to 1235 in Gold. The Elliott Wave patterns remain extremely bullish for Gold to continue a 13 Fibonacci year cycle up into 2014. Gold has formed a very bullish pattern intermediately for a move to $1470-$1550 at the next major pivot top. In the interim, I expect continued consolidation in and around my $1,235 US levels before the next pivot high at $1300-$1,325 US. Fiat currencies are burning matches as foreign governments and other entities continue to attempt to put out a fire by printing more paper and covering the same fire with it. Until the analysts on CNBC stop questioning the validity of Gold and start questioning the validity of Fiat Paper, the bull will rage onwards with most of the pundits watching the caboose from the back of the tracks.
SP 500 Forecast from the Mid-May TMTF forecast service updates:
Gold Forecast is for $1570 over 6-9 months with pivot at $1300:
http://www.thegoldandoilguy.com/wp-content/uploads/2014/11/tgaoglogo.png00adminhttp://www.thegoldandoilguy.com/wp-content/uploads/2014/11/tgaoglogo.pngadmin2010-05-17 23:14:012014-03-10 08:51:24The Gold Bull Market and the SP 500 Index