Posts

My Stock market trend analysis is likely different from what you think is about to unfold. Keep an open mind as this is just showing you both sides of the coin from a technical stand point. Remember, the market likes to trend in the direction which causes the most investor pain.

Since the stock market bottom in 2009 equities has been rising which is great, but this train could be setting up to do the unthinkable. What do I mean? Well, let’s take a look at the two possible outcomes.

The Bear Market Trend & Investor Negative Credit

The S&P500 has been forming a large broadening formation over the last 13 years. The recent run to new highs and record amounts of money being borrowed to buy stocks on margin has me skeptical about prices continuing higher.

Take a look at the chart below which I found on the ZeroHedge website last week. This chart shows the SP500 index relative to positive and negative investor credit balances. As you can see we are starting to reach some extreme leverage again on the stock market. I do feel we are close to a strong correction or possible bear market, but we must remember that a correction may be all we get. It does not take much for this type of borrowed money to be washed clean and removed. A simple 2-6 week correction will do this and then stocks will be free to continue higher.

credit


Monthly Bearish Trend Outlook

Below you can see the simple logical move that should occur next for stocks based on the average bull market lasts four years (it has been four years) and the fact the negative credit is so high again.

Also, poor earnings continue to be released for many individual names across all sectors of the market. While corporate profits may be holding up or growing in some of the big name stocks, revenues are not. This means the big guys are simply laying off workers and cutting costs still.

Overall the stock market is entering its strongest period of the year. So things could get choppy here with strong up and down days until Jan. After that stocks could start to top out and eventually confirm a down trend. Keep in mind, major market tops are a process. They take 6-12 months to form so do not think this is a simple short trade. The market will be choppy until a confirmed down trend is in place.

MajorBear


Monthly BULLISH Trend Outlook

This scenario is the least likely one floating around market participant’s minds. It just does not seem possible with the global issues trying to be resolved. With the Federal Reserve continuing to print tens of billions of dollars each month inflating the stocks market this bullish scenario has some legs to stand on and makes for the perfect “Wall of Worry” for stocks to climb.

The US dollar is likely to continue falling in the long run, but I do not think it will collapse. Instead, it will likely grind lower and trade almost in a sideways pattern for years to come.

FoodForThought


Major Stock Market Trend Conclusion:

In summary, I remain bullish with the trend, but once price and the technical indicators confirm a down trend I will happily jump ships and take advantage of lower prices.

Remember, this is big picture stuff using Monthly and quarterly charts. So these plays will take some time to unfold and within these larger moves are many shorter term opportunities that we will be trading regardless of which direction the market is trending. As active traders and investors we will profit either way.

Get My Reports Free at: www.GoldAndOilguy.com

Chris Vermeulen


Trading with the trend should be your main focus for long term success no matter what type of trader you are (Options Trader, Stock Trader, or ETF Trader) although it’s not as easy as it sounds.

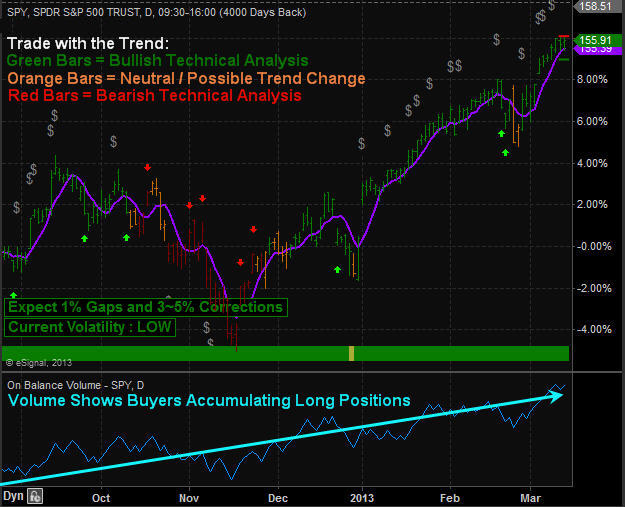
The good news is that there is a simple trading model that removes 95% of trading analysis and greatly reduces trading related emotions because the key technical analysis rules based on one of the world’s best chart technicians (John Murphy) technical analysis methods have been applied to the chart automatically. The key is to identify the trend of the market. Once that is known you can focus on trading strategies that take advantage of the current trend.

Over the past few years I have been creating this indicator/chart layout tool which converts my chart reading experience, tips and tricks into a simple system removing analysis paralysis which cause most individuals to second guess what they see and don’t pull the trigger. Using too many indicators or read/listening several other traders commentaries with different views than you causes this paralysis.

My simple red light, green light model clearly shows a viewer the current trend and expected price range (high and low) looking forward a couple days. I uses a series of data points like volatility, volume, cycles, momentum, chart patterns and logic rules. It even shows extreme pivot points helping you find low risk entry prices for both bull and bear market conditions.

Recent trends and signals for the SP500 Index Daily Chart:

SPY1

Trading With the Trend – The Sweet Spots

Knowing the direction of the market is simple using the chart system above but trading with the trend is not that simple because of natural human behavior. Instead traders fall victim to trying to pick a top or bottom because they think the price is overbought or oversold and they want to catch the next big trend change.

We all know the saying “the market climbs a wall of worry”. Well, the biggest worry most traders have is buying long in a bull market because stocks and price always look overbought and ready to top each week… This leads to people trying to get fancy picking a top only to get their head handed to them a few days or weeks later depending on how stubborn they are to exit a losing position.

The key to long term success is to buy during broad market (SP500) corrections once sentiment, cycles and momentum are starting to flash extreme oversold conditions. These show up as green arrows on the trend chart. At that point most sectors and high beta stocks like IBM, GOOG etc… should be at a key entry points with most of the downside risk removed already. Remember ¾ stocks follow the broad market so it only makes sense to follow it also.

What about a runaway stock market? This is when the stock market does not pullback but just keep grinding its way higher and higher… The only thing you can do is sit in cash, or look for a stock or sector that is having a small pause or pullback and get long with a small position until you get that broad market pullback and major by signal to add more.

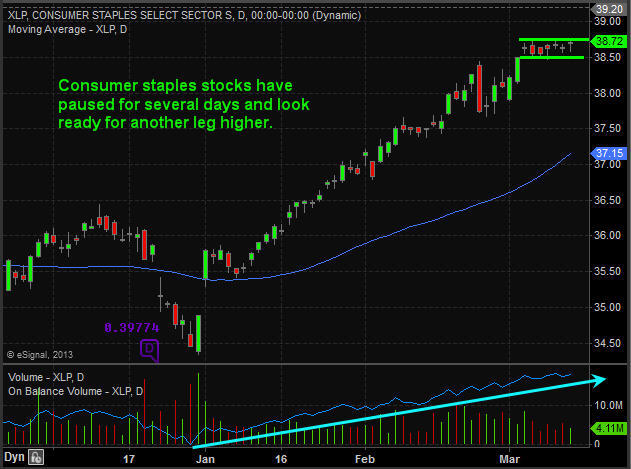
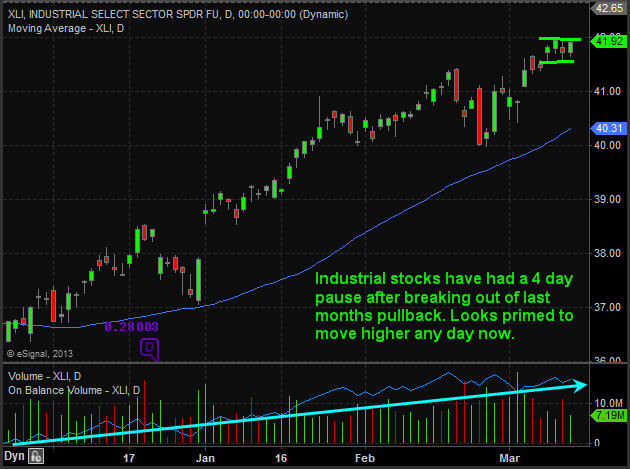
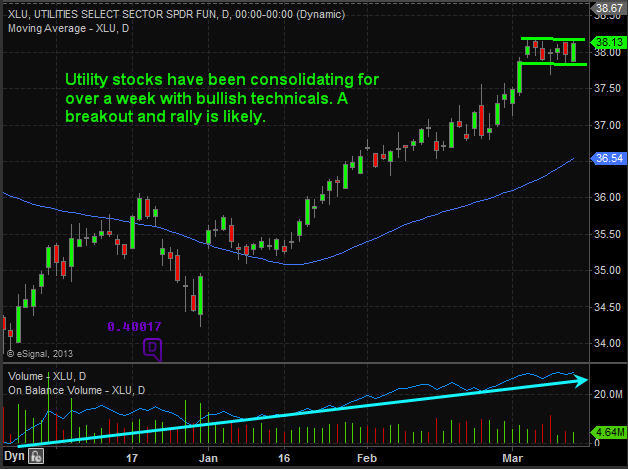
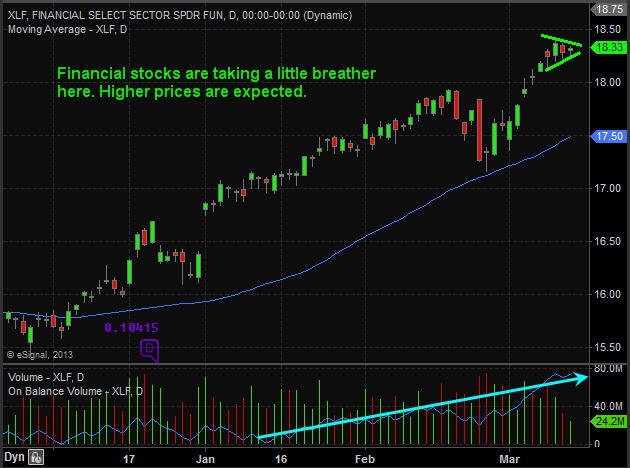
Below are a few sectors showing a minor pause/pullback within this bull market.

XLP

XLI XLU XLF


Mid-Week Trend Conclusion:

Overall, the broad market remains in an uptrend. While I would like to see the SP500 pullback and give us another major buy signal like it did in December and February I do mind that much if prices keep running higher as it just give us more cushion and potential profits for when the trend does eventually roll over and flip signals. I hope you found this report interesting. It’s just scratching the surface of this topic but it’s a start.

Know the stock market trends by joining my free newsletter: www.GoldAndOilGuy.com

Chris Vermeulen

Last week was exciting as we saw stocks and gold close above the February highs which confirms we are in a new up trend. The question everyone is wondering is:
.

How far will this market go before rolling over?

This is a tough question but we can get a good feeling about the risk and if it’s worth putting money to work or not at this point. Here are my quick points and thoughts about the stocks indexes at the current price (March 5th closing price).
• The market is extremely overbought on the hourly and daily charts. Buying here is just chasing prices around, and that is a net losing game.
• Small Cap stocks have been on fire making a new higher for the year. This is very bullish but again buying here carries too much risk because after such a sharp price appreciation, we can see it all be given back just as quick.
• Volume over the past three weeks has been below average and when I see higher prices on declining volume I expect prices to drop very quickly once the thrust upwards ends.
.

Stock Market Indexes – 21 Trading Days
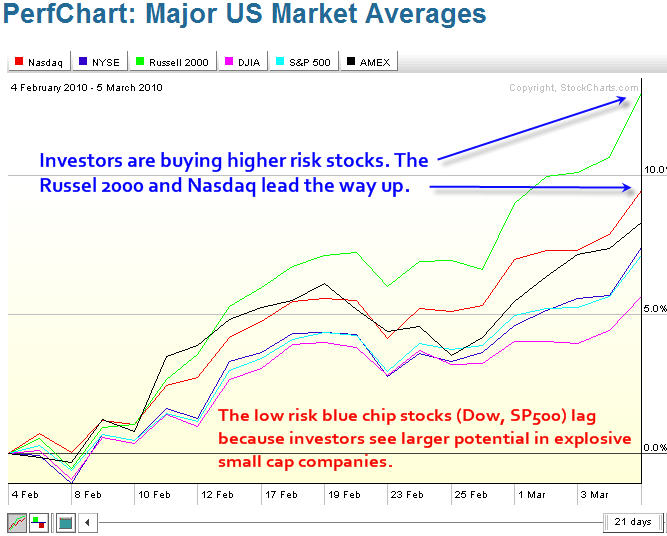
Here is a simple chart showing the past 21 trading sessions. It compares the Nasdaq, NYSE, Russell 2000, Dow Jones, SP500, and Amex indexes.

As you can see the Russell 2000 (small cap stocks) and Nasdaq (tech stocks) have been on fire the past couple weeks while the solid large cap stocks lag.

.
Are The Small Caps Stocks Telling Us Something?
Its means investors and traders are confident enough to buy higher risk companies. This is good for the overall market because small cap stocks tend to lead the market in both up and down trends. What has me concerned is the low volume rally, which I don’t like.

One thing to note is that small cap stocks tend to do well during times when the US Dollar is rising. This is because they are not multinational dealing with currency exchange. So this small cap stock rally has me wondering if the US Dollar is about to continue its up trend or if investors really are comfortable with buying riskier stocks?

.
.

GLD Gold ETF – Daily Chart
Gold gained some ground last week but the majority of the money seemed to flow into small cap stocks. But take a look at this bullish chart.

This is a text book bull flag pattern complete with and ABC retrace, trend line break, and reversal candle off of a support zone. I am bullish on gold long term but think we could see prices rise a couple percent from here but will trend sideways/down for the next 2-3 weeks to digest the recent move up.

.
.

US Dollar Index – Weekly Chart
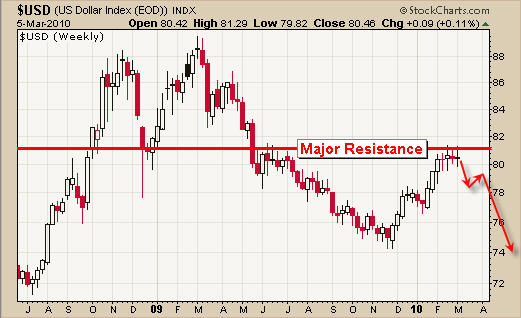
I have posted this chart several times in the past few months with 83 being a key resistance level. The dollar’s recent price action is very bullish and it is flagging just under this key resistance level. I feel the price is heading lower from here but only time will tell. A breakout to the upside will put a lot of pressure stocks and precious metals.

.
.

Weekend Trading Conclusion:
Last weeks strong rally into the close will most likely carry over into Monday and possibly Tuesday. The reason being is simply because retail traders and investors (John Doe’s) get excited when they see higher prices, thus it attracts more money into the market.

In short, I feel the market is overbought. All indexes are trading at resistance other than the Russell 2K index, and volume is below average. I am going to wait and see how things unfold this week before thinking about getting committed to any more long positions. If anything I will be looking to short the market using the intraday charts for a quick trade. Again low volume rallies that are overbought tend to snap back very quick on an intraday time frame providing a 1-4 hour trade.

Get My Free Weekly Trading Reports:

Chris Vermeulen
www.TheTechnicalTraders.com

Dec 27th 2009
Another holiday trading extravaganza!!!

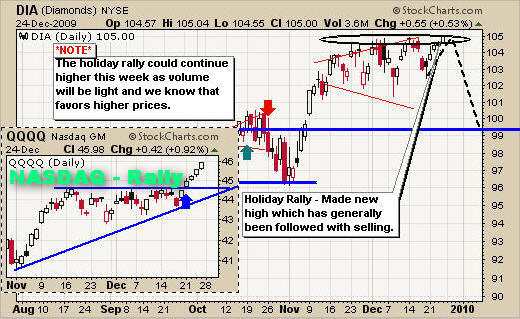
Last week the market fell into its regular holiday tradition of light volume, as institutions and big traders enjoyed the holidays thus allowing prices to drift higher. We still have one more week of light trading volume before this year and holiday season is officially over.

Trading during low volume times is regularly misinterpreted. Many traders figure they should not be trading this time of the year but from my experience, the last two weeks of the year are amazing for short term swing plays or day trading. The market seems to be much more predictable when the large program traders are not involved.

Also the more speculative plays (small and mid cap stocks) always seem to out perform as buyers bid the prices higher into the light selling volume. This is most likely why we are seeing the NASDAQ and Russell 2000 indexes making some nice gains of late.

Take a look at the charts…

Broad Market & NASDAQ Low Volume Rally

Stock Market Trend

Stock Market Trend

GLD ETF Trading – Daily Chart
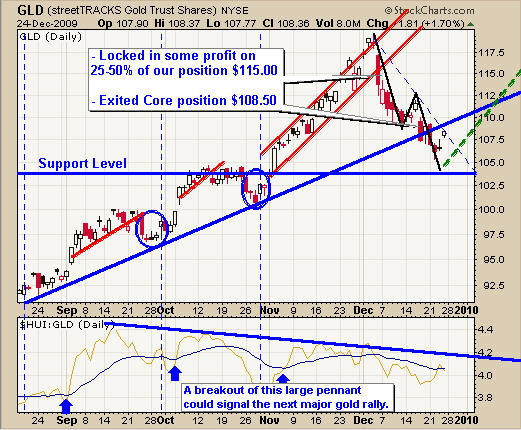
Gold prices broke down as expected in early December and are now nearing a possible bottom. The past 3 weeks have provided some very exciting day trades shorting spot gold prices. In the next few weeks I will be starting to provide more spot gold charts and intraday price action for all the international traders and futures traders ?

I did not provide the chart of silver as it trades very similar to gold. When the time comes I will provide detailed analysis for entry and exit points for members.

Gold Market Trend

Gold Market Trend

Crude Oil USO Trend Trading
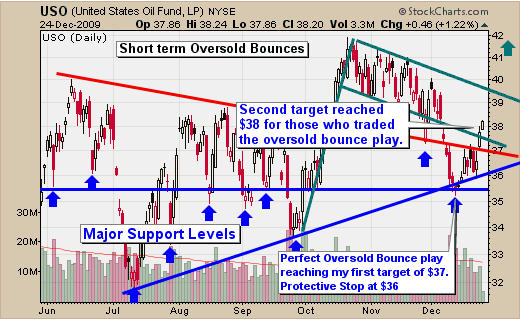
USO fund had a very nice pullback in early December and I pointed out a spec play at $35.50 with targets set at $37, $38 and $40. So far the first two profit taking targets have been reached.

Sorry for all the lines on the chart but sometimes it’s the only way to remember where all the crucial levels are for trading pivot points.

Oil Trend Trading

Oil Trend Trading

Natural Gas UNG Trend Trading
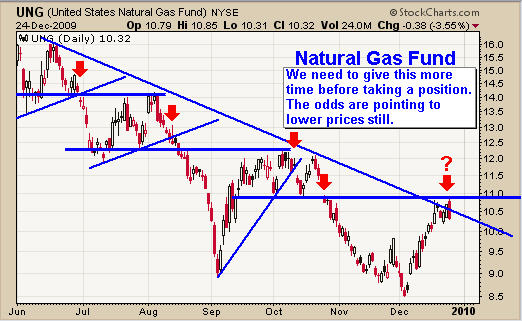
Natural gas trades like a bucking bronco. It’s a tough ride if you do not understand market psychology and apply strict money management to your positions.

Last weeks price action closed with a bearish candle after testing resistance twice. We could get a short trade this week depending on what happens from here. Let’s keep our eyes open for a low risk setup.

Natural Gas Trend

Natural Gas Trend


Market Trends Trading Conclusion:

This year has been fantastic for making money, but next year will most likely be much more difficult if we see the market top and head south or trend sideways. The market topping is not an event; rather a process and trend following systems will start having more losing trades than winners as the market momentum shifts from up, to sideways then down.

Don’t get me wrong, I am not saying I think its going to roll over and head south, cause quite frankly no one knows what its going to do from this point forward. This is the reason we are in cash and patiently awaiting new low risk opportunities to place our money. The joy of trading with technical analysis is that you don’t care which direction the markets go because the analysis, if done correctly, allows you to profit in all market conditions using different trading strategies.

The board market
, in my opinion, is way overbought due to the holiday rally. But we must remember there is another low volume week as we approach New Years and this could extend the rally more. Smaller trading positions should be used until we enter the New Year and volume steps back into the market.

Gold and silver are in a short term down trend and trading near a resistance level. We could see prices drop quickly or rally from here. So we are letting things unfold before making a commitment.

Oil
continues to move higher and last weeks weakening US dollar helped give oil a boost.

Natural gas is trading at resistance and looks ready to head back down. The daily and 30 minute chart did not setup a signal to short Natural Gas, but it was very close.

As usual, I will update on the market and provide daily updates and trades to members.

Free Gold ETF Trading Newsletter

Chris Vermeulen
www.GoldAndOilGuy.com – Gold Newsletter