
Timing stock market tops and bottoms is risky business and we all know the more the more risk we take the more potential gain would could also made. Correctly timing a top or bottom for any investment is flat out exciting not to mention financially rewarding. But this high risk trading tactic does come with some major issues which you must FULLY understand so that you can protect your capital and self-confidence.
On May 13th I wrote a special report on how to spot market tops just before they happen and how to do it with a very high probability of success. I also explain the major pit falls to be aware of so you stay on the right side of the market.
I recommend you read this special report now: http://www.thegoldandoilguy.com/how-to-spot-time-stock-market-tops/
That special report truly showed you what was going to happen a few weeks before it did. Much like how this report shows you what is likely to happen in June.
Looking at the market with my YOU ARE HERE type of using cycles, volume, price patterns and momentum to forecast what is likely to unfold in the coming weeks. Depending on the time frame used for my analysis I can figure out with a high probability where price will be in a few minutes, hours or days also.
Mall Market Directory – You Are Here
Stock market tops are tough to trade and time. That is because there are so many things happening in the media and emotions running wild that it’s tough to get a grasp on what you should really be focusing on to keep a level head trade around it.
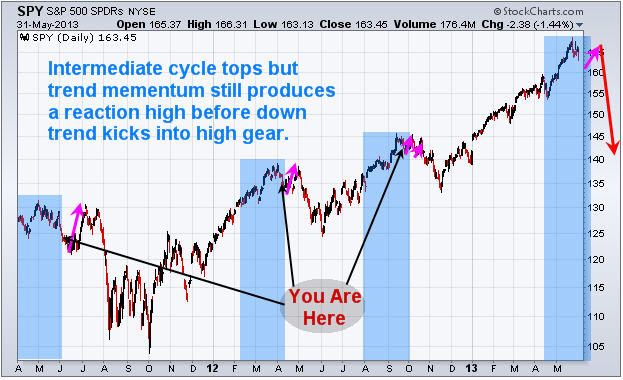
Market tops are typically not an event but rather a progression that takes much longer than most individuals expect. I still find myself jumping the gun at times and I know this and have been through this process hundreds of times in various investments. The human brain is a powerful tool but emotions can force you to override your rules/strategy still.
Stop Fighting! – Bulls & Bears are BOTH Correct at this Stage
It does not matter where you go to get your stock market news and reports… Everyone is arguing their bullish or bearish case more than EVERY. There is a reason for this and it’s because the SP500, DJIA, RUT and NASDAQ appear to be entering a cycle top. What does this mean? It means the uptrend is almost over from a technical analyst point of view, and those who are have been bearish for a long time feel the market topping out more now than ever in their gut that this is the top.
Keeping it simple removing news, economic data, emotions and biases we are left with one thing which is technical analysis. This is based on price alone and that is important to remember because the only thing that pays you money for an investment is when price moves in your favor. Believe it or not price only has blips on the charts here and there which is based off news, economic data etc… In the big picture stock prices tend to lead economic data by several months and in some cases years.
So the big question is this… If price action is the only thing that pays you when trading why bother worrying about all the other opinions, news out there. That stuff only adds to the confusion and in most cases gets you on the wrong side of the market.
Timing the Market Top Conclusion:
In short, from a technical point of view the SP500 remains in an uptrend. But according to technical analysis the upside momentum is starting to slow. If we get a few more down days then the trend will flip and be down but it has not yet happened.
When the trend does reverse down you must remember that 80% of the time price will bounce back up to test near the recent highs before truly rolling over and collapsing. Think of it like a zombie movie. Just when you think you killed one it comes back to life for one last scare before its dead.
Just to touch on stock market bottoms so you do not get confused. Stock market bottoms are little different than tops so they are traded differently. I will cover them when the time comes.
Trading the market is not easy during this type of condition, which is why members and myself got long SSO on the 23rd and two days later sold out for a 3.5% gain. I am now looking to reload this week for another bounce/rally play but only time will tell if we get another setup.
Download my FREE eBook on Controlling Your Trades, Money & Emotions: http://www.thegoldandoilguy.com/trade-money-emotions.php
Chris Vermeulen


