The Technical Traders Ltd has identified a unique price to volatility relationship between the SP500 and VIX index. The calculations required to compute the VIX index are composed of a number of factors. That final value of the VIX index is reported on an annualized basis. This means that VIX index as already internalized the past 12 months price volatility into the current VIX levels.
We believe this increased VIX volatility expectation could be muting future VIX spikes and trading systems focus on the VIX Index. The fact that the VIX as likely to internalized that large October to December 2018 price rotation and will not move beyond this price range until well after April or May of 2020 creates a unique problem for VIX systems and analysts. In short, the VIX has normalized a 20% price volatility expectation, or more, and will not reduce this expectation until well after April or May of 2020.
Taking a look at this weekly VIX chart clearly highlights the large 472% increase in January and February 2018. The reason why the VIX increased by this incredible amount is that the prior 12 months price volatility was extremely muted. The price rotation in the SPX was -343, for a total of -12%. The second VIX Spike between October and December of 2018 resulted in a 227% increase while price rotated more than 600 points, -20.61%, in the SPX. Obviously, the larger price movement in October through December 2018 would have likely resulted in a large VIX move if prior volatility expectations had remained the same.
It is our belief that the January to February 2018 price volatility rotation increase the VIX volatility expectations by at least 30 to 40%. The second, much larger, price rotation during October to December 2018 pushed the VIX volatility expectations higher by at least 10 to 15%. Our researchers believe the normalized VIX levels representing current price volatility are likely to stay above 12 or 13 until well after November or December 2019 if price volatility and expectations stay rather muted. Any additional large price rotations, to the downside, will likely continue to normalize or internalize increased VIX level volatility expectations.
This SPX chart helps to compare the relative VIX price increases in relation to the true SPX price volatility. We’ve also drawn a 12-month price window, as a red box on this chart, to highlight how the VIX attempts to normalize the past 12 months volatility going forward. It is our belief that a move above 500 to 600 points in the SPX may only prompt a rally in the VIX to near 28 to 30. Whereas, the same price swing from October to December 2018 prompted a VIX move to about 36. We would need to see the SPX move at least 900 points before the VIX will spike above 25 again. Remember after January or February of 2020 the VIX may begin to contract again as price volatility stays muted for the rest of this year.
We currently believe a large price rotation may be set up for near the end of 2019. Our proprietary cycle modeling systems and extended research are suggesting this downside move may begin sometime near August or September of 2019. Remember, this new VIX research suggests that any large price downswing may result in a very moderate VIX price increase at first. In other words, things could get very interesting towards the end of 2019 for traders.
Please take a minute to visit www.TheTechnicalTraders.com and see how we have been navigating, trading and profiting from the market over the past 17 months, I think you will be pleasantly surprised. Our research team believes the US stock market will likely form an extended pennant formation over the next 60+ days. Now is the time for us to plan and prepare for what may become a very volatile second half of 2019 and early 2020.
https://thegoldandoilguy.com/wp-content/uploads/2019/06/13-1.png463700adminhttp://www.thegoldandoilguy.com/wp-content/uploads/2014/11/tgaoglogo.pngadmin2019-06-17 16:09:552019-06-17 16:09:55Investors are confident, bullish and buying stocks, but…
In fact, there are several super cycles starting to take place as we head into 2020 and beyond which Brad Matheny and layout in our new book: 2020 Cycles – The Greatest Opportunity Of Your Lifetime
If you wanna become a technical trader with use and trade ETFs then be sure to join our Wealth Building Newsletter today and get our daily video analysis and swing trade alerts. In the past 17 months, our newsletter trade signals have generated 91% ROI for its subscribers, be sure to join before the markets start making new big moves and profit with us!
Chris Vermeulen www.TheTechnicalTraders.com
Subscribe to TheGoldAndOilGuy.com ETF newsletter and profit! – CLICK HERE
https://thegoldandoilguy.com/wp-content/uploads/2015/05/cvinterview.png151210adminhttp://www.thegoldandoilguy.com/wp-content/uploads/2014/11/tgaoglogo.pngadmin2017-02-15 10:12:492017-02-15 10:12:49What has been Pushing S&P 500 Higher?
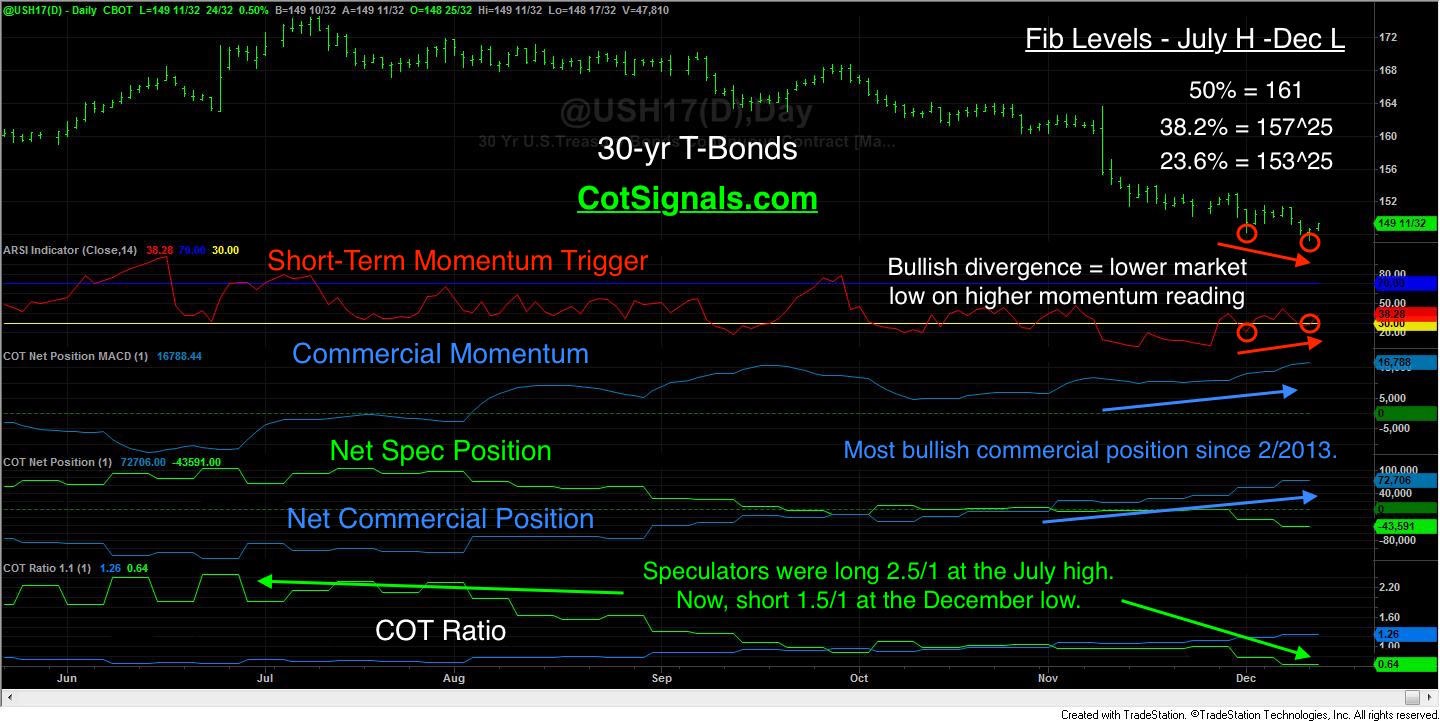
The Commercial Hedgers are considered the smart money. The Speculators are considered the dumb money.
The rise in yields corresponds with the decline in Treasury prices. A bounce is ahead of us in 2017.
Commercial traders have built up their most bullish position since February of 2013.
Commercial traders are now long 50% more long than they are short. This is the most bullish COT Ratio reading since July of 2011.
The speculative side of this trade have built up their most concentrated short position since February of 2013 and their largest net short position since March of 2012. The speculators are usually wrong. They set their recent COT Ratio high two weeks before the market topped out. The concentration of their short position should give pause to new short sellers.
The technical picture suggests a bounce is due.
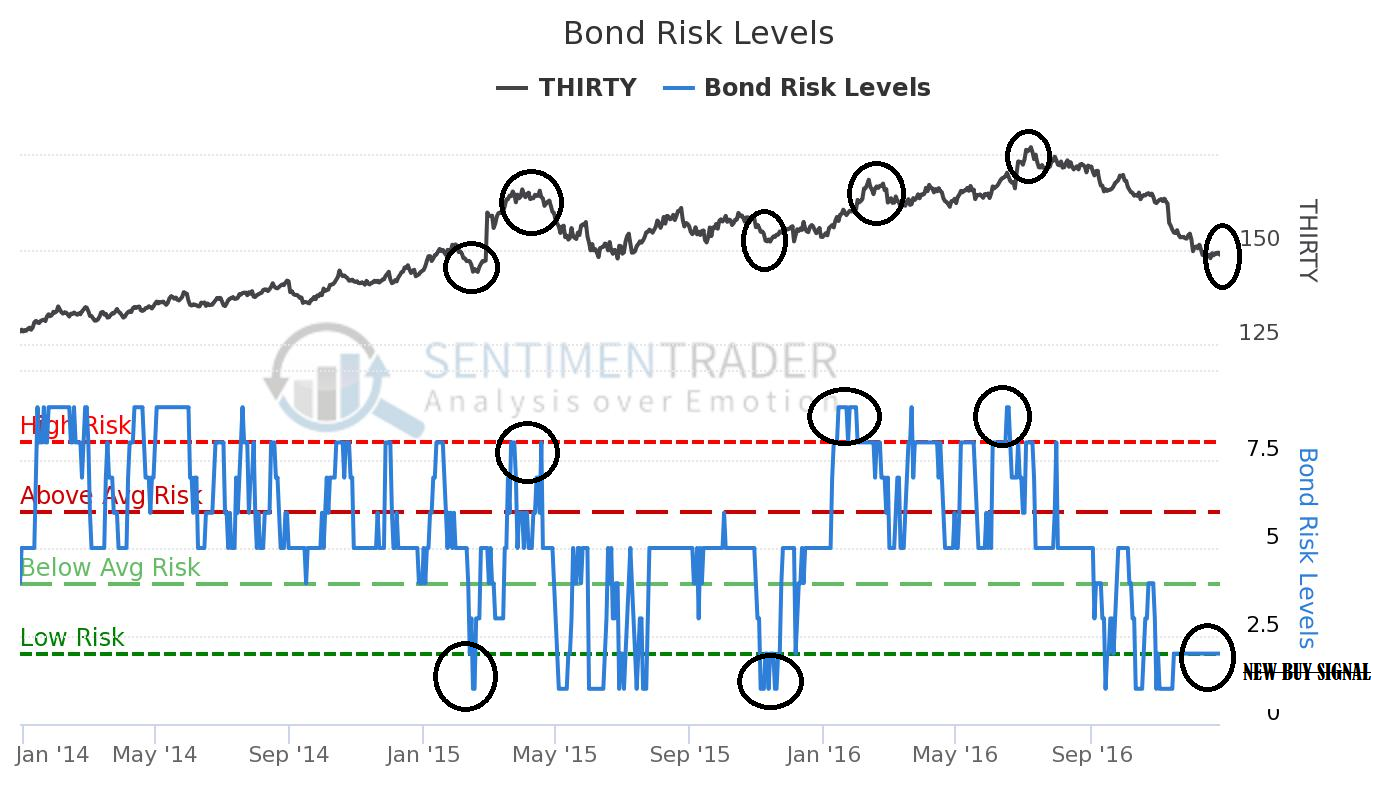
BOND RISK LEVELS
Latest Value(s):
Last Reading: 2.0 December 27th, 2016
Extreme Values:
Excessive Optimism: 8.0
Excessive Pessimism: 2.0
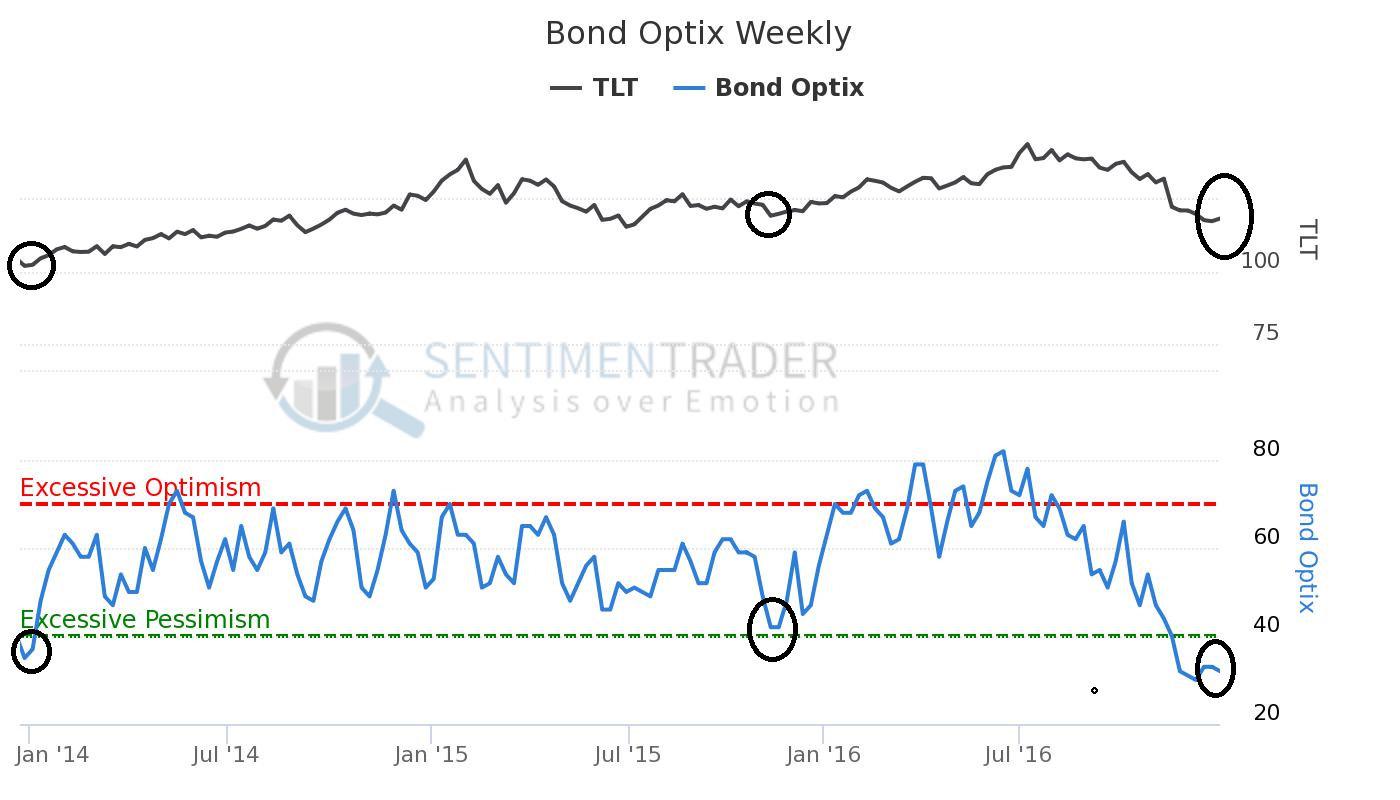
BOND OPTIX WEEKLY
Latest Value(s):
Last Reading: 33.0 December 23rd,, 2016
Extreme Values:
Excessive Optimism: 70.0
Excessive Pessimism: 40.0
The Treasury prices are oversold on the March 30-year Treasury Bond futures.
The evidence is displayed with the buyers of US Treasury Bonds. I side with the commercial traders. The dramatic imbalance in positions between the commercial and speculative traders suggests a bounce higher is imminent.
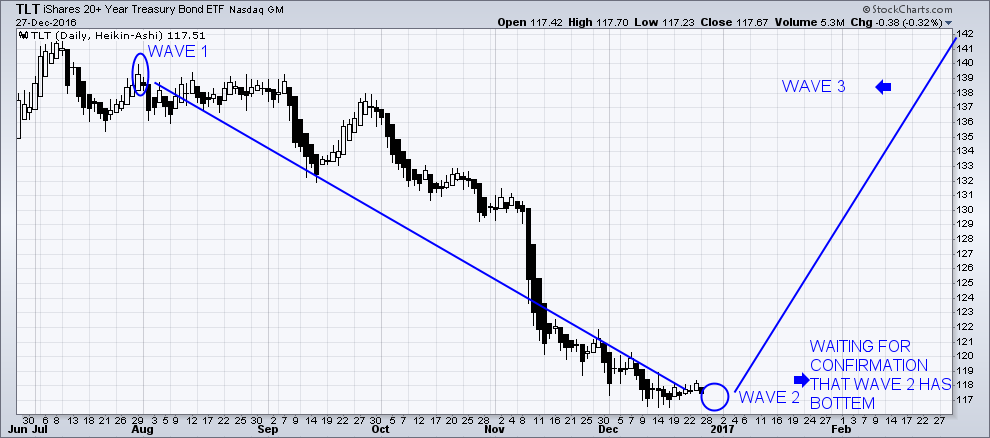
My Elliot Wave Of Bonds – TLT:
Elliott Wave 2 Theory
Elliott Wave (2) is the first correction against the new trend
Elliott Wave (2) corrects wave (1), but can never extend beyond the starting point of wave one. Typically, the news is still bad. As prices retest the prior low, bearish sentiment quickly builds, and “the crowd” haughtily reminds all that the bear market is still deeply ensconced. Still, some positive signs appear for those who are looking: volume should be lower during wave two
Elliott Wave 3 Theory
Elliott Wave (3) is usually the strongest and longest wave
Elliott Wave (3) is usually the largest and most powerful wave in a trend. The news is now positive and fundamental analysts start to raise earnings estimates. Prices rise quickly, corrections are short-lived and shallow. Anyone looking to “get in on a pullback” will likely miss the boat. Trading the Wave (3) is usually the most profitable. This will be a muti-year rally!
In Conclusion:
The new year of 2017 will not be a good one for global economies. There will be a big slowdown throughout the global economies. The equity markets, as well, will be extremely negative in 2017. The next yearly closing should be at a low level. The low of 2016,1800 in SPX, may be breached. The analysis is trying to say yes! Be prepared to exit your long stock positions at the midpoint of 2017 and enter “safe havens”. See my gold forecast – Click Here
Bonds should start to rise and hold up through 2017. But will only rally in a big way once there is a major global event/crisis or the later stages of a bear market in US equities. Either way, likely not going to happen till late 2017 or beyond.