Posts

Our research team has identified a potential trade setup in QID that correlates to our ongoing analysis of the US stock market and our Advanced Fibonacci Price Amplitude Arcs.  We believe a major price inflection point is setting up in the US stock market within the next 48 hours that may prompt a price trend reversal in the NASDAQ and other major US stock market indexes.  This pattern correlates to a much longer-term Head-n-Shoulders pattern that is also setting up in the SPY.

Our belief is that technical traders should wait for confirmation of this setup before entering any new trades, yet we believe we will have confirmation of this setup within 3 to 5 trading days – given the urgency of the setup with our Fibonacci Price Amplitude Arcs.  We believe a right-shoulder could be forming as the US stock markets push a bit higher in early trading this week. We believe the Fibonacci Price Acr’s are suggesting a major inflection point is preparing to disrupt price trends.

Just to be clear, this is a prediction, and as technical traders, we wait for confirmation before trading. This is the #1 issue with most traders. They jump the gun and buy into a trade idea before the price chart has confirmed and they lose a lot of money. Follow price, don’ try to lead it.

If our analysis is correct, we may see a fairly strong trend reversal over the next 5+ trading days as this pattern/setup complete and confirm.

Before you continue, be sure to opt-in to our free-market trend signals
before leaving this page, so you don’t miss our next special report & signal!

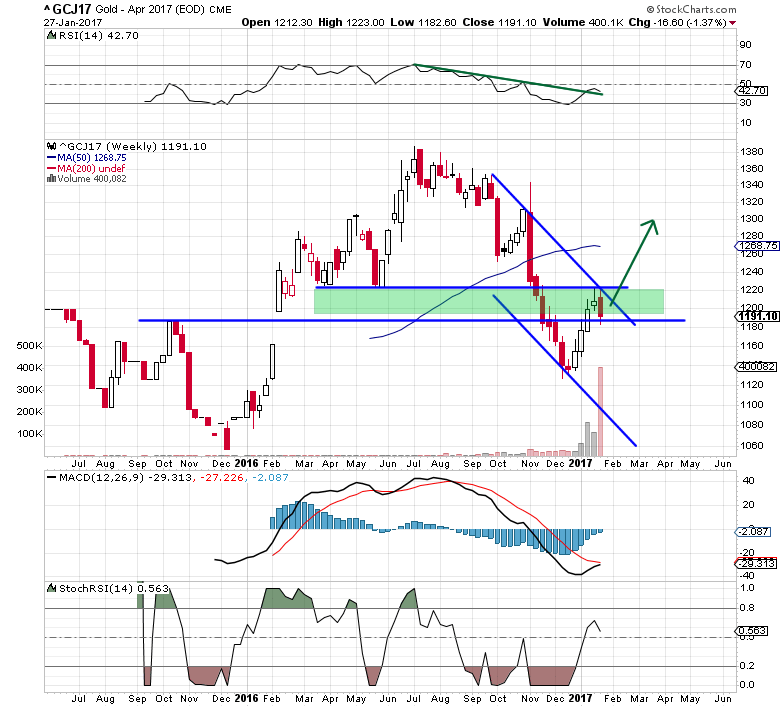
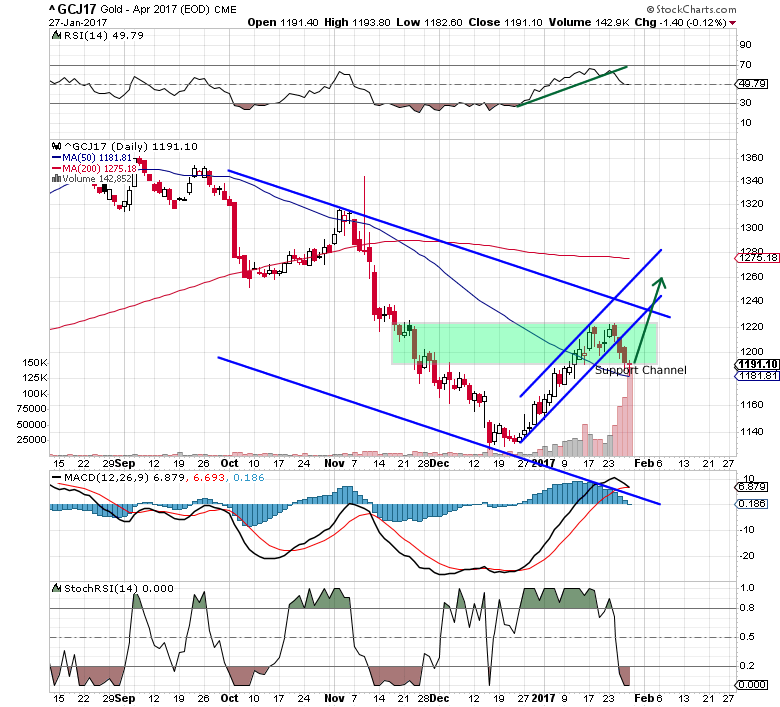
DAILY QID (INVERSE NASDAQ ETF) CHART

This Daily QID chart highlights the major RED Fibonacci Price Amplitude Arc that is setting up as well as the more narrow MAGENTA Arc.  Both of these arcs are aligning very close to one another.  Additionally, the RSI suggests any trend reversal to the upside could prompt a moderately large upside price trend.
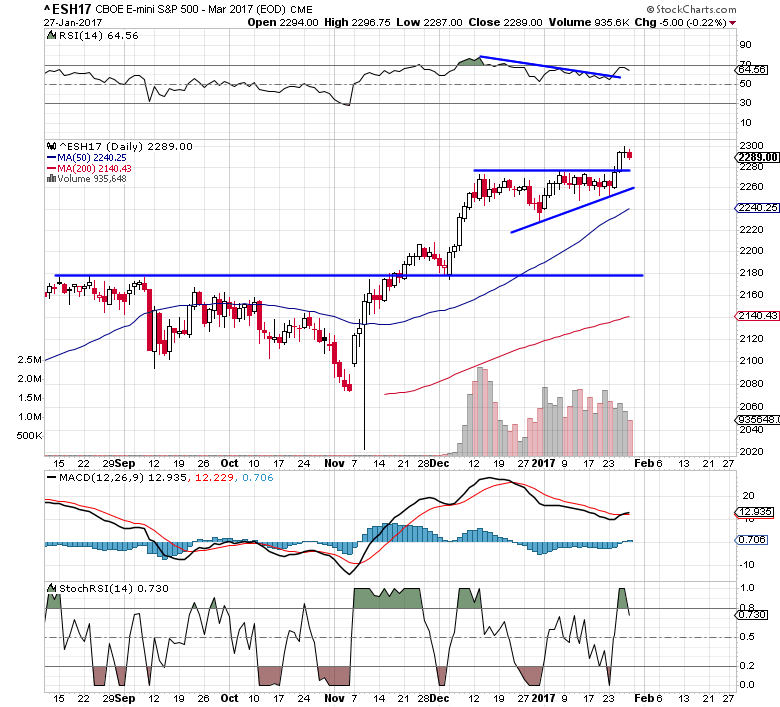
NAS100 DAILY CHART

This NAS100 Daily chart highlights the right-shoulder of a longer-term price pattern that we believe may be ending soon.  If our analysis is correct, the right-side of the Head-n-Shoulders pattern may set up near the PURPLE Arc on this chart (or soon after) – prompting a broad downside price trend in the US stock market.

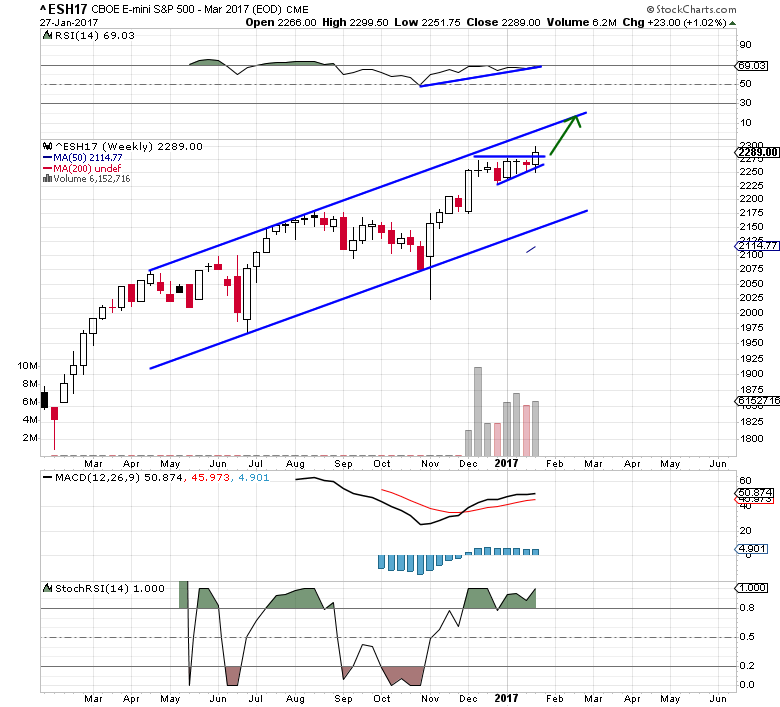
LONGER-TERM WEEKLY SPY CHART

This longer-term Weekly SPY chart shows the Head-n-Shoulder setup that is forming in the SPY.  Although the right side of the shoulder is rather short and volatile, we believe this setup may be a fairly strong potential pattern warning of a stronger downside price trend that may initiate soon.  Obviously, 240 (previous lows) would be an easy objective in the SPY if this happens.

CONCLUDING THOUGHTS

Current price levels suggest a resistance level has been reached.  If this resistance level persists in containing price and creates a Head-n-Shoulders pattern, there is a very strong likelihood that a broader downside price move may present real opportunities for profits.  Skilled traders should prepare for this potential and watch for confirmation of this pattern/setup.

If you are using our free public research for your own trading decision-making and/or using it as an opportunity to find and execute successful trades, please remember you are the one ultimately making the decisions to trade based on our interpretation and free research posts.  We, as technical traders, will continue to post new research articles and content that we believe is relevant to the current market setups.

If you want to improve your accuracy and opportunities for success, then we urge you to visit www.TheTechnicalTraders.com to learn how you can enjoy our research and our members-only trading triggers (see the first chart in this article).  If you are managing your retirement account or 401k, then we urge you to visit www.TheTechnicalInvestor.com to learn how to protect your assets and grow your wealth using our proprietary longer-term modeling systems.  Our goal is to help you find and create success – not to confuse you.

Our researchers will generate free research on just about any topic that interests them.  As technical traders, we follow price, predict future price moves, tops, bottoms, and trends, and attempt to highlight incredible setups that exist on the charts.  What you do with it is up to you.  Visit www.TheTechnicalTraders.com/FreeResearch/ to review all of our detailed free research posts.

In closing, we would like to suggest that the next 5+ years are going to be incredible opportunities for skilled traders.  Remember, we’ve already mapped out price trends 10+ years into the future that we expect based on our advanced predictive modeling tools.  If our analysis is correct, skilled traders will be able to make a small fortune trading these trends and Metals will skyrocket.  The only way you’ll know which trades to take or not is to become a member.

Chris Vermeulen
Chief Market Strategist
Founder of Technical Traders Ltd.

For many years now, metals traders and enthusiasts have been patiently waiting for the move in Silver that we feel its eventually going to happen.

There is almost a ritual process in the metals market that takes place when a crisis happens.  We’ve written about this in a past article and we’ve highlighted how we believe Silver is one of the absolute best opportunities if/once it breaks out.  It goes something like this…

A.  Silver is often an overlooked “little cousin” to other precious metals like Gold and Platinum.  Many traders would rather trade/acquire Gold vs. Silver.

B.  When a crisis begins to happen, both Gold and Silver tend to collapse an initially as the shock to the markets translates into sales of precious metals to improve cash/margin requirements.

C.  As the crisis continues to unfold, Gold will typically begin a sustained upside price move over many months where Silver may move very little to the upside.  This creates a massive peak in the Gold to Silver ratio.

D.  Then, suddenly Silver starts to rally upward faster than Gold and the Gold to Silver ratio begins to collapse.  Gold continues to move higher throughout this process, but Silver is already rallying much stronger than Gold.

This is the breakout move in Silver that we believe may be happening right now and may continue for many months or years into the future.  Allow us to explain this setup in more detail.

Before you continue, be sure to opt-in to our free-market trend signals
before leaving this page, so you don’t miss our next special report & signal!

SILVER DAILY CHART

First, we believe an extended FLAG formation in Silver has recently completed and we believe this price wedge type of pattern will prompt a renewed upside price trend in Silver prices over the longer-term given a number of factors that many skilled traders have failed to appreciate.  Technically, a price advance from current levels to levels above $21 will prompt a big shift in thinking for Silver traders.  These new highs will suggest Silver has finally broken above the previous $20 price highs and could be skyrocketing higher as it did in 2010~12.

SILVER WEEKLY CHART

This Weekly Silver chart shows exactly why we believe this Flag Breakout could prompt a major upside price rally in both Gold and Silver.  The downside price rotation that took place after the February 2020 global COVID-19 virus event prompted a vast rethinking of value and risk.  While Gold found support fairly early, suggesting skilled traders were moving away from risk and into safe-havens, Silver has stalled below $16.50 recently.  We believe this ”second-class” status for Silver is about to end in a very big way.  Follow along.

GOLD TO SILVER RATIO WEEKLY CHART

The Flag formation setup on the Daily and Weekly Silver charts is almost like the Starting Line of an incredible upward price event.  The COVID-19 price collapse did what it was supposed to do, deflate expectations related to future market valuations and shift investor consideration of Metals for a short period of time.  As risks accelerated and equity trades were put at risk, metals sold off as traders liquidated metals positions to cover risk exposure in Equities or another market.  Now that the risk event has taken place and metals are transitioning back towards a safe-haven solution again, a new process begins – the upside advance in Gold and Silver which takes the Gold To Silver Ratio back down below 65~75.

Looking back at the 2008~09 Credit Crisis and the current COVID-19 crisis event, we can see Gold is already trading at levels which are very high compared to the peak levels in 2011 (almost 4 years after the 2008 Credit Crisis).  We can also see that the Gold: Silver Ratio has reached the 120 level on this chart – which is incredibly nearly 41% higher than the peak levels in 2008.  Comparatively, the Gold:Silver Ratio collapsed 60% from 2008 to 2011 while Gold skyrocketed from $720 to $1870 (259%).  A similar move from current Gold price levels would suggest Gold could rally well above $4,500 over the next 2+ years.

Now, how does this relate to Silver?  In 2008, Silver was trading near $9.75 just before the peak in the Gold:Silver Ratio was reached.  By 2011, Silver had reached levels above $48.25 – an incredible 495% price increase.  This suggests Silver could rally from current levels, near $15.75 to levels above $78 (or higher) if our analysis is correct.  What are we expecting to happen next?

If our research is correct, we will see an upside price move in Silver to levels above $21 to $23 over the next three to five+ weeks.  At the same time, Gold will likely rally to levels near $1999~$2100.  This simultaneous price rally in both Gold and Silver should prompt the Gold:Silver ratio to stay rather elevated.  But the next move in Silver, above $25~$30, should push the Gold:Silver Ratio below 100 from current high levels – which would collapse the RSI level showing us the longer-term price rally in Gold and Silver has confirmed.

Every time the Gold:Silver Ratio collapses substantially, more than 35 to 40 RSI points after the Gold:Silver Ratio reached new high levels, this indicates a price rally in Gold and Silver is beginning.  You can see how often this setup qualifies and confirms over the past 30+ years on the chart below.  We’ve highlighted the uptrends in Silver in GREEN.

LONG-TERM HISTORICAL GOLD TO SILVER RATIO WEEKLY CHART

CONCLUDING THOUGHTS:

We believe the current FLAG formation breakout in Silver is the beginning of a much larger upside price trend that is just beginning.  Over the next few weeks and months, we believe Silver will begin an upside price advance that could last 12 to 24+ months and present an incredible opportunity for technical traders who follow price action.

If you are using our free public research for your own trading decision-making and/or using it as an opportunity to find and execute successful trades, please remember you are the one ultimately making the decisions to trade based on our interpretation and free research posts.  We, as technical traders, will continue to post new research articles and content that we believe is relevant to the current market setups.

If you want to improve your accuracy and opportunities for success, then we urge you to visit www.TheTechnicalTraders.com to learn how you can enjoy our research and our members-only trading triggers (see the first chart in this article).  If you are managing your retirement account or 401k, then we urge you to visit www.TheTechnicalInvestor.com to learn how to protect your assets and grow your wealth using our proprietary longer-term modeling systems.  Our goal is to help you find and create success – not to confuse you.

Our researchers will generate free research on just about any topic that interests them.  As technical traders, we follow price, predict future price moves, tops, bottoms, and trends, and attempt to highlight incredible setups that exist on the charts.  What you do with it is up to you.  Visit www.TheTechnicalTraders.com/FreeResearch/ to review all of our detailed free research posts.

In closing, we would like to suggest that the next 5+ years are going to be incredible opportunities for skilled traders.  Remember, we’ve already mapped out price trends 10+ years into the future that we expect based on our advanced predictive modeling tools.  If our analysis is correct, skilled traders will be able to make a small fortune trading these trends and Metals will skyrocket.  The only way you’ll know which trades to take or not is to become a member.

Chris Vermeulen
Chief Market Strategist
Founder of Technical Traders Ltd.

These are crazy times and if you’re attempting to make some fiat via trading, you need all the help you can get. To that end, it was great to get acquainted today with Craig Hemke of TF Metals Report.

If you’re not familiar with Craig’s work and his service, you can find all that you need to know by visiting his website:  TFMetalsReport.com

Over the course of this call, Craig and I discuss:

  • Methods and strategies for identifying trading opportunities
  • The discipline applied in finding a trade, sticking with it or taking profits
  • The current “Best Asset Now” and why

But there’s a whole lot in between, too, so please take time to give this podcast a thorough listen. You’re certain to learn something new.

Many thanks to Craig for sharing his valuable time today.

As a technical analyst and trader since 1997, I have been through a few bull/bear market cycles in stocks and commodities. I believe I have a good pulse on the market and timing key turning points for investing and short-term swing traders. 2020 is an incredible year for traders and investors.  Don’t miss all the incredible trends and trade setups.

Subscribers of my Active ETF Swing Trading Newsletter had our trading accounts close at a new high watermark. We not only exited the equities market as it started to roll over in February, but we profited from the sell-off in a very controlled way with TLT bonds for a 20% gain. This week we closed out SPY ETF trade taking advantage of this bounce and entered a new trade with our account is at another all-time high value.

Ride my coattails as I navigate these financial markets and build wealth while others watch most of their retirement funds drop 35-65% during the rest of this financial crisis going into late 2020 and early 2021.

Just think of this for a minute. While most of us have active trading accounts, what is even more important are our long-term investment and retirement accounts. Why? Because they are, in most cases, our largest store of wealth other than our homes, and if they are not protected during the next bear market, you could lose 25-50% or more of your net worth. The good news is we can preserve and even grow our long term capital when things get ugly like they are now and ill show you how and one of the best trades is one your financial advisor will never let you do because they do not make money from the trade/position.

If you have any type of retirement account and are looking for signals when to own equities, bonds, or cash, be sure to become a member of my Passive Long-Term ETF Investing Signals which we issued a new signal for subscribers.

Chris Vermeulen
Chief Market Strategies
Founder of Technical Traders Ltd.

Cory Fleck from the Korelin Economics Report and Chris Vermeulen talked and provided some thoughts on the precious metals markets. The stocks are continuing to lead the sector and GDX is adding to the breakout. But not all precious metals sectors and stocks are in bull markets right now. We outline what’s still lagging. Also some comments on a Natural Gas trade at the end.

Overall, this has been an excellent trade.  We got our members into this trade fairly early and are already pulling profits and trailing stops.  It certainly helps to have the modeling systems and seasonal analysis tools we use to find these setups for our members – but you can do it too.  All it takes is a bit of skill and understanding of how certain markets operate within seasonal trends and setups.  Otherwise, if you don’t have the time to research every chart we can do it all for you and just send you the trades we are taking.

As a technical analyst and trader since 1997, I have been through a few bull/bear market cycles in stocks and commodities. I believe I have a good pulse on the market and timing key turning points for investing and short-term swing traders. 2020 is an incredible year for traders and investors.  Don’t miss all the incredible trends and trade setups.

Subscribers of my Active ETF Swing Trading Newsletter had our trading accounts close at a new high watermark. We not only exited the equities market as it started to roll over in February, but we profited from the sell-off in a very controlled way with TLT bonds for a 20% gain. This week we closed out SPY ETF trade taking advantage of this bounce and entered a new trade with our account is at another all-time high value.

Ride my coattails as I navigate these financial markets and build wealth while others watch most of their retirement funds drop 35-65% during the rest of this financial crisis going into late 2020 and early 2021.

Just think of this for a minute. While most of us have active trading accounts, what is even more important are our long-term investment and retirement accounts. Why? Because they are, in most cases, our largest store of wealth other than our homes, and if they are not protected during the next bear market, you could lose 25-50% or more of your net worth. The good news is we can preserve and even grow our long term capital when things get ugly like they are now and ill show you how and one of the best trades is one your financial advisor will never let you do because they do not make money from the trade/position.

If you have any type of retirement account and are looking for signals when to own equities, bonds, or cash, be sure to become a member of my Passive Long-Term ETF Investing Signals which we issued a new signal for subscribers.

Chris Vermeulen
Chief Market Strategies
Founder of Technical Traders Ltd.

This weekend we thought we would share some really important data and charts with all of you precious metals bugs/traders (like us).  You probably remember our October 5th, 2018 call in Gold that has set off an incredible series of events for all of us.  We made a prediction that day that Gold would rotate higher from the $1200 level targeting the $1300 level, then stall and move lower to set up a “momentum base” near April 21~24 before accelerating much higher after June/July 2019.  Our original research chart is shown below. But first, be sure to opt-in to our free market forecast newsletter This incredible research targeted the $1600+ level by September/November 2019.  We are only about $70 away from that level right now and we have new ADL research to share with all of our followers.
If you are a fan of our research or you can understand the value of the ADL predictive modeling system and what we have highlighted for our followers – you already know that any future ADL predictions for precious metals should be of particular interest to all of you.  What are metals going to do over the next few months and how can you prepare for this move, let us help you try to prepare for this next move. Check out these exciting charts full of opportunities that we will be sharing. This Gold Monthly chat highlighting the ADL predictive modeling system results shows why gold traders need to be patient and wait for the next setup.  That setup exists over the next 30 days as the ADL predictive modeling system is suggesting that Gold will attempt a downside price rotation to levels near $1490 before attempting another rally back above $1600.  This is the next proper price rotation setup that traders need to look for.  The second setup occurs in Jan/Feb 2020 where the price is expected to rotate from above $1600 to levels near $1540 before launching into another big rally to levels above $1870. The Adaptive Dynamic Learning (ADL) predictive modeling system is one of the most incredible price modeling tools we use in our research.  We’ve just shown you what our research tools believe Gold will do over the next 14+ months.  We believe we are helping more traders and investors by proving our incredible research tools work better than any other technology solutions available in the market right now and are proving it by posting these types of charts many months before price can attempt to prove or disprove our research.
Now, one of the biggest moves is going to be in Silver and we’ve all been waiting for the incredible reversion of the Gold/Silver ratio.  It is at that point when Silver begins to rally faster than Gold is rallying that we will see a true reversion in the Gold/Silver ratio.  That event will result in an incredible rally in silver that could push the price of silver above $35 to $40 per ounce – or higher. Our ADL predictive modeling system running on a Quarterly Silver chart highlights the opportunity that still exists for metals traders.  Silver will continue to rally as Gold rolls higher.  Silver will continue to rally to levels just below $20 over the next 8+months.  The big breakout to the upside starts to take place Q3 2020.  That move will push Silver prices to levels above $20 where a brief rotation will take place.  By Q1 2021, the price of silver will be rallying extensively and the cat will be out of the bag in terms of what or why the metals are skyrocketing.
These moves in precious metals are going to be once of the most incredible opportunities for investors.  There will be other swings in market sectors and major global market indexes as well.  This is the time for all traders/investors to take advantage of the resources that are available to learn to take advantage of these setups.  Our research team continues to deliver some of the most incredible research and predictive modeling results anyone has ever seen.  If you can not see the value of being able to see 14 to 24 months into the future. We urge you to consider finding resources and a team of researchers that can assist you over the next 12+ months as the moves in the global markets are going to be incredibly large and varied.  Now is the time to take advantage of these opportunities and to find the right partners to assist you in finding the right trades.

CRUCIAL WARNING SIGNS ABOUT GOLD, SILVER, MINERS, AND S&P 500

In early June I posted a detailed video explaining in showing the bottoming formation and gold and where to spot the breakout level, I also talked about crude oil reaching it upside target after a double bottom, and I called short term top in the SP 500 index. This was one of my premarket videos for members it gives you a good taste of what you can expect each and every morning before the Opening Bell. Watch Video Here. I then posted a detailed report talking about where the next bull and bear markets are and how to identify them. This report focused mainly on the SP 500 index and the gold miners index. My charts compared the 2008 market top and bear market along with the 2019 market prices today. See Comparison Charts Here. On June 26th I posted that silver was likely to pause for a week or two before it took another run up on June 26. This played out perfectly as well and silver is now head up to our first key price target of $17. See Silver Price Cycle and Analysis. More recently on July 16th, I warned that the next financial crisis (bear market) was scary close, possibly just a couple weeks away. The charts I posted will make you really start to worry. See Scary Bear Market Setup Charts.

CONCLUDING THOUGHTS:

In short, you should be starting to get a feel of where commodities and asset class is headed for the next 8+ months. The next step is knowing when and what to buy and sell as these turning points take place, and this is the hard part. If you want someone to guide you through the next 12-24 months complete with detailed market analysis and trade alerts (entry, targets and exit price levels) join my ETF Trading Newsletter. Be prepared for these incredible price swings before they happen and learn how you can identify and trade these fantastic trading opportunities in 2019, 2020, and beyond with our  Wealth Building & Global Financial Reset Newsletter.  You won’t want to miss this big move, folks.  As you can see from our research, everything has been setting up for this move for many months. Join me with a 1 or 2-year subscription to lock in the lowest rate possible and ride my coattails as I navigate these financial market and build wealth while others lose nearly everything they own during the next financial crisis. As a technical analysis and trader since 1997, I have been through a few bull/bear market cycles. I believe I have a good pulse on the market and timing key turning points for both short-term swing trading and long-term investment capital. The opportunities starting to present themselves will be life-changing if handled properly.

FREE GOLD OR SILVER WITH MEMBERSHIP!

Kill two birds with one stone and subscribe for two years to get your FREE PRECIOUS METAL and get enough trades to profit through the next metals bull market and financial crisis! Chris Vermeulen – www.TheTechnicalTraders.com

Have you ever been presented with an opportunity and missed out on it?  Well, here is an opportunity you Do NOT want to miss out on.

Based upon my unique “Cycle Analytical” work combined with my “Proprietary Predictive Analytics Model, I can assure you that there are new highs to be made in the U.S. stock. Appling my unique metric, which are not available to the public, I can inform you that the stock markets are not overbought or overextended, at present. The market remains in a clear bullish trend!  This next new leg is very sustainable!


Technically Speaking, It Is Now Back To “Buy The Dip”:

The SPX, Dow Jones and the Nasdaq Composite all closed at new all-time highs last Friday, February 10th,2017.  The Trump Rally is just getting started according to Bloomberg.

Investors should expect that the global markets will continue their bull market run throughout the first half of 2017 rather than forming a top which leads to a bear market. “Extremes” have lost their’ meanings, at this point. The Federal Reserve has given the green light to major banks in the U.S. to raise dividends and buy back shares of their companies. The huge thrust in momentum has now returned to the four U.S. stock indexes.

Nicholas Teo of KGI Securities said that: “Ever since his victory in November, global stock markets have been steered by actions events rhetoric emanating from the new commander-in-chief”.

The trigger events show the willingness of the markets to give the Trump Administration a lot more ‘slack’ as we engage into 2017.  Billions of dollars are continuing to flow into the U.S. real estate market from Chinese nationals. They are using their offshore cash reserves to make payments on the properties they have speculated on in the U.S. There are also big-money speculators who have the sophistication needed to circumvent China’s Capital Controls.

Blackrock estimates that there is a whopping $50 trillion in cash “sitting on the sidelines”. This money has come from global central-banks, financial-firm reserves and consumer savings accounts.  Blackstone is keeping nearly one-third of its’ assets in cash. Fund managers have increased their reserves to levels that equal the highest since 2001. This means that there is a lot of liquidity with nowhere to go, but UP.

We are still in the early days of the new Trump Administration and everything seems to be going his way. President Trump’s proposed economic policies are being well received by U.S. businesses, especially Wall Street big banks. His plans are certainly positive – such as deregulation, defunding of various useless federal agencies, simplification of the tax code and lowering taxes. Many people, including some of the best money managers, in the world, are at a loss trying to figure out where to put their money, right now.  However, all that you need to do this year is to follow my lead as I strive to make profitable returns and be on the right side of all markets, and you cannot afford to miss any hugely profitable setup this year!


All of the indicators continue to suggest higher prices ahead! 

The Elliott Wave Principle is a description of how groups of people behave. It reveals that mass psychology swings from pessimism to optimism thereby creating specific and measurable patterns. In the chart below, repeating patterns in prices are displayed showing where we are located at any given time. In those repeating patterns, I can predict where we are going next.


Wave 5:

Wave 5: Wave five is the last leg in the primary direction of the dominant trend.  Wave 5 advance is caused by a small group of traders. Prices will make a new high above the top of wave 3.

 tr1


How To Make Money In 2017!

Do you trade like the professionals do? Most traders make the same mistakes – which is why they consistently lose money!  Implementing my winning strategy by receiving SMS text alerts every time we enter or close a trade is the best way to get you setup and be profitable on the same day!  Trading and focusing on my Momentum Reversal Method (MRM) and trading just the hot stocks and sectors for quick oversized gains is my expertise. Therefore, these momentum trades are moving significantly in one direction on heavy volume. The length of time for which I may hold a momentum trade depends on how quickly the trade is moving with trades lasting 3-25 days in length and we look for a7%- 35% potential gain.

Momentum traders are truly a unique group of individuals. Unlike other traders or analysts who dissect a company’s financial statements or chart patterns, a momentum trader is only concerned with stocks in the news. These stocks will be the high percentage and volume movers of the day/week.

Read more: Momentum Traders | Investopedia http://www.investopedia.com/university/introduction-stock-trader-types/momentum-traders.asp#ixzz4YY8FK9VY
On February 8th, 2017, myself and subscribers closed out our NUGT trade for a 112% profit that we entered into on December 16th.2016,

tr2

Sometimes stocks move very fast.  As I enter any new swing trades, I will immediately send out these alerts to you on your mobile device.

On February 8th, 2017, we entered the ERX at $33.00.  Right after we got into this trade, ERX, (http://etfdb.com/etf/ERX/), we were up 6% to 8% and we closed half our position.  Instantly receiving these alerts on your mobile device can make a huge difference in both time and profits as you saw in the ERX setup!  I always send out my swing trades to my members by SMS, but keep in mind most trades can be entered within a 1-3 day period as I don’t catch exact market bottoms or tops.

tr3

America Is Happy, Again!

tr4

A recent Gallup Poll reported that American’s confidence in the U.S. economy remained strong in January of 2017. Gallup’s U.S. Economic Confidence Index averaged +11, which is the highest monthly average reached in Gallup’s nine-year trend. I just came across this video that is enough to make you start thinking about changing your long term portfolio asset allocation – Watch Video Here


So, if you are looking for a simplified and highly accurate pulse on the markets, along with timely swing trades, I urge you to join my newsletter at www.ActiveTradingPartners.com.


Chris Vermeulen

Our recent analysis bases on a previous report of the potential for a further run in the US markets based on a number of technical and fundamental factors leads to the question of “what could happen with Gold and Silver”.  A broad US market rally may put some pressure on the metals markets initially, but, in our opinion, the increase in volatility and uncertainty will likely prompt more potential for upward price action in precious metals.


As with most things in the midst of uncertainty and transition, the US Presidential election has caused many traders to rethink positions and potential.  As foreign elections continue to play out, wild currency moves are starting to become more of a standard for volatility.  Combine this with a new US President and a repositioning of US global and local objectives and we believe we are setting up for one of the most expansive moves in recent years for the US general markets and the metals markets.  This week, alone, we have seen a flurry of action in DC and the US markets broke upward on news of the Dakota Pipeline and other Executive actions.


As we wrote week or so ago, we believe the US markets will push higher in 2017 a business investment, US strategy and foreign capital runs back into the US equity market chasing opportunity and gains.  Additionally, we believe the strength of the US market, paired with continued strength of the US Dollar, will drive a further increase in global volatility and wild swings in foreign markets.  This volatility, uncertainty and equity repositioning will likely drive Gold and Silver to continued highs throughout 2017 – possibly much longer if the new trend generates renewed follow-through.


Our belief that the US markets will continue to melt-up while certain foreign markets deteriorate relates to our belief that currency variances will become more volatile and excessive over the next few months.  This, in combination with a renewed interest in developing US economic solutions, will likely drive the US markets higher while the metals markets will continue to become a safe-haven for US and foreign investors to protect against deflation and foreign market corrections.


S&P Futures are setting up a clear bullish pennant/flag formation that will likely prompt an explosive price move within 2~3 weeks.  This bullish flag formation is likely to drive the ES price higher by roughly 100+ pts.  Currently, strong resistance is just above 2275, so we’ll have to wait for this level to be breached before we see any potential for a bigger price move.


SP500 Weekly Chart
ES_Weekly2


SP500 Daily Chart

ES_Daily

GOLD is channeling in a very clear and narrow upward price channel and trading in the middle of a support zone.  The recent reversal, near the end of 2016, was interesting because GOLD trailed lower after the US election, but then reversed course just before the new year.  The interesting fact about this move is that this new upward swing in GOLD correlates with the beginning of the Bullish Flag in the S&P Futures as well as a decrease in volatility.  We believe as this Bullish Flag will prompt a jump in volatility and price action that will result in is a strong push higher in GOLD.


GOLD Weekly Chart
GC_Weekly


Gold Daily Chart

GC_Daily2


SILVER is setting up in a similar manner as GOLD.  Although the SILVER chart provides a clearer picture of the downward price channel that is about to be breached – and likely drive both SILVER and GOLD into a new bullish rally.  The support Zone in SILVER, between $16.60 ~ $17.40 is still very much in play.  SILVER will likely stay within this zone while the Bullish Flag plays out.  Yet, when the breakout begins, a move above $18.00 will be very quick and upside targets are $18.50~18.75 and $19.50~$20.00 (possibly much higher in the long run).


SILVER Weekly Chart
SI_Weekly


Silver Daily Chart
SI_Daily2


EUR/USD correlation to the US moves should be viewed as measure of strengthening US economy/USD as related to foreign market volatility and potential.  As the USD strengthens, this puts pressure on foreign governments and global transactions based in USD.  This also puts pressure on the METALS markets because billions of people around the globe consume precious metals as a “safe-haven” related to currency volatility.  We expect the EUR/USD levels to fall near “parity” (1.00) again and possibly dip below parity based on future foreign election results.  This volatility and uncertainty will translate to increased opportunity for GOLD and SILVER to run much higher over the next few months.


EURUSD Daily Chart

EUR_Daily2


USDMXN Daily Chart

USDMXN  

USDGBP Daily Chart

USDGBP


Right now is a fantastic opportunity to take advantage of these lower prices.  We may see rotation near to the lower support zone levels as price rotates over the next few weeks.  The key to any trade in the metals market is to understand the potential moves and watch for confluence and volatility in other markets.  We believe the next few weeks/months will be very telling.  If we are correct, we’ll see new highs in the US markets fairly quickly and we’ll see a new potential bullish breakout in GOLD and SILVER.

You can follow our weekly analysis and trade ideas at www.TheMarketTrendForecast.com

Chris Vermeulen & John Winston

Gold to Regain Its Gleam!

One question that gold investors are asking now is, will 2017 be as spectacular for the yellow metal as it was in 2016? The short and sweet answer to this is YES.

The dollar, gold and the major U.S. stock exchanges will all see new highs. Gold is currently in a “complex corrective correction” while experiencing its’ last pullback, beforehand.

Both the short-term outlook and the long-term outlook for gold is BULLISH!  Trumps’ victory win is a positive for gold bulls. Policy uncertainty and slowing growth, following a Trump win, will stoke the yellow metals’ price in 2017.

Gold prices have been under pressure since the Trump victory, but the long-term scenario for gold is that it is parabolic. The global economy is still in contraction. Global Center Bankers continue with monetary easing, leading to currency debasement. Interest rates continue to slide into negative territory in Europe and Asia.  Gold’s investment appeal will encounter a period of time before it generates positive yields. Gold, as an investment, will once again be back in vogue. As prices rally, investment demand will only rise further, taking everyone by surprise.

The demand for gold jewelry has been declining within the large gold-consuming nations. The gold investors will call the shots in this new ‘bull’ market of gold.  Current supply constraint has cushioned gold prices from the rally in the U. S. dollar.

This is the last great buying opportunity for gold before it makes its’ next historic run in 2017 and beyond.


Excessive Pessimism: 2.0
THIS IS WHEN THE BEST OPPORTUNITY TO BUY GOLD IS PRESENTED

Latest Value(s):

– Last Reading: 1.0

– Extreme Values:

– Excessive Optimism: 8.0

gr1


Excessive Pessimism: 30:
THIS IS WHEN THE BEST OPPORTUNITY TO BUY GOLD IS PRESENTED

Latest Value(s):

– Last Reading: 34.0

– Extreme Values:

– Excessive Optimism: 75.0

– Excessive Pessimism: 30.0

gr2


Gold Hedgers Positions

Latest Value(s):

– Last Reading: -134022.0

Extreme Values:

The green dotted line is 1 standard deviation above the 3-year average;
the red dotted line is 1 standard deviation below the 3-year average.

gr3


The Drivers!

A key factor that has driven investments in gold is the negative interest rate in Europe, Japan, Denmark, Sweden, and Switzerland. The sovereign debt of approximately one third of the developed countries traded with a negative yield while an additional 40% of the countries had yields below 1%.

Gold prices will be driven more by its’ value as an ‘investment asset class’. Gold will supersede investments in other ‘asset classes’ such as equity and bonds in due time.

The massive U.S. debt continues to spiral out of control. The Treasury Department’s printing presses are cranking out hundreds of billions of dollars in new money. European countries are imploding financially and the entire European Union is at risk of a collapse.  These ‘geopolitical’ factors will be driving the demand for gold as a ‘safe haven”.

The global ‘retail’ investment market is well positioned for growth what with demand for gold in China, India, Germany and the U.S. for 2017.

Social media is a ‘key driver’ which is critical in both China and India. Financial advisors and financial websites are the key drivers in the U.S. markets. In Germany, banks play the most important influence; ‘Protect wealth against the system’.  It has a competitive advantage compared to other investment options.


Jordan Eliseo, Chief Economist at precious-metals dealer ABC Bullion, says “Gold retreated about 18 percent from its year-to-date high. Afterward, it gained 26 percent in the first half of 2016.  The decline so far, this year has been about 15 percent from its year-to-date high.  Gold, is setting up for another rally in fashion like last year. The recent correction has already drawing in some investors to buy what they see as cheap metal.”


On December 14th my trading partner accurately forecasted the recent bottom in gold which you can see in this gold market forecast.

December 14th Forecast chart:

gr4

He then took things a step further and entered into a NUGT (3x long gold miners ETF) with subscribers and recently locked in 50% profit on the first half and is up over 70% on the balance as of Fridays closing price.


GOLD WEEKLY CHART REMAINS IN DOWNTREND

The constructing on this new infrastructure is going to require a lot of new money. The country is already close to $20 trillion in debt, so if the administration plans to make this one of their priorities, it is going to have to print it.

gr5


‘THE GREAT RESET’

Nixon closed the gold window on August 15th, 1971 and consequently, the world entered a new era.  For the first time in history, all the world’s monies were unbacked fiat currencies, adrift on a sea of floating exchange rates.  This stopped the redemption of currency for gold. Today, gold reserves are nothing more than an asset listed on the FEDS’ balance sheet.  Gold had stopped being an integral part of our financial monetary system

At the top of international commerce, money managers had always known the dangers of ‘currency risk’, but now every currency has become a ‘soft currency’. Recognition of ‘currency risk’ seeped down into the knowledge chain, but on the street of personal financial management, despite it being 45 years later, not many have caught on to the concept.


To Live And/Or Continue Living the American Dream

Golds’ strength is in the role of ‘wealth protection’. It is a ‘safehaven’ and its ‘independence’ from the global financial system makes it a great investment for the future. Gold is still good value for those who do not own any to accumulate ounces.

In a few days, I will be publishing a piece talking about the shift in the economy and what I call “The Great Transfer of Wealth”. Be sure to join my free newsletter below to receive this special report!

Chris Vermeulen
www.TheGoldAndOilGuy.com

Silver and silver mining stocks are front and center for investors and active traders. Because of silvers high volatility (large price swings) it naturally attracts a lot of attention.

First you have seasoned investors who are waiting for the right opportunity to get long or short for the next move. Then you have the active traders playing the day to day price swings. Finally you get the gamblers who are salivating over the potential to double their accounts and are riding the commodity on pure emotions (Fear & Greed). All these things compound the volatility for the investment making it headline news and what everyone wants to be involved in.

The focus of this report is show you where the price of gold, silver and miner stocks are currently trading and what to lookout for in the coming days/weeks. Below is a chart of gold but silver has a similar pattern and will follow or should I say lead the price of gold in percentage terms because of its volatility.

Gold Weekly Chart:

Gold has been testing its long term support level for three weeks. I expect we see price start to move quickly sooner than later but there is potential for it to tread water here until the second half of April. We all know the saying “Sell in May and Go Away” and as we get closer to that date we should start to see money flow into the “Safe Havens” being gold, silver, and miners. While this has not happened many times on the charts I am thinking beyond them and of what the masses are likely to flock to when stocks lose their luster.

Also if you have been following the price of the dollar index you know that its getting a little overbought and when it starts to correct the falling dollar should help send precious metals higher.

Gold3

Gold & Silver Miners VS Gold Bullion Performance:

The stock market has certain chart patterns that tell chart readers what the holders of that particular investment is feeling emotionally. Knowing how to read these extreme patterns can yield some big gains and works for most investments types (stocks, bonds, commodities and currencies).

Without getting into the boring technical details precious metal stocks are starting show signs of panic selling which typically happens before a major bottom is put in place. A bottom generally takes a week or two for some type of bottoming pattern or base building to form. This is the most volatile time to be trading these investments so trade with caution.

Gold1


Gold Miners Bullish Percent Index:

Bullish percent indexes are a great way to see how popular an investment is. If you do not know what a bullish percent chart is then you can look it up online and learn more. The way I read it is when it’s up over 75-80 it’s a popular investment and everyone is buying it. It also means it’s in a major uptrend. But you must be aware that when everyone is buying something once price starts to turn down you better be one of the first few out the door before everyone else runs for the door and price crashes.

It’s similar but reversed for investments that are below 20. Everyone is selling, no one wants to own it but once the selling momentum stops price should rebound and rally. Keep in mind this indicator is not great for timing, but confirms that what you are looking at is either oversold, neutral or overbought in the BIG picture.

Gold2


Weekend Precious Metals Trading Conclusion:

In short, I still like gold, silver, and their related mining stocks. I am watching them very closely for signs of a bottom and will be jumping on that train when the selling momentum looks to have stalled. Keep in mind that all these investments are still in a VERY STRONG DOWN TREND and trying to catch a falling knife is not what I do. Waiting for momentum to shift is my focus as there should be big upside if metals and stocks can find a bottom soon. If gold breaks down below key support as posted on the weekly chart then the uptrend may be over and it will be time to start looking for short positions.

You can get my free weekly reports and ideas here: www.GoldAndOilGuy.com

Chris Vermeulen