Posts

Our Adaptive Fibonacci Price Modeling system suggests a much deeper price move is in the works and the current price rally will likely end near resistance levels identified by the Adaptive Fibonacci Price Modeling system.  We are posting this research post for friends and followers to help them understand the true structure of price and to allow them to prepare for what we believe will become a much deeper downside price move in the future.

Fibonacci Price Theory teaches us that price moves in waves within up and down price cycles.  The recent peak in price, near February 25, 2020, has resulted in a very deep -36% price collapse in the S&P 500 (ES) recently.  This downside move has been mostly straight down, excluding a brief retracement in early March.  The strength of this downside price move suggests a moderate upside price recovery will take place before the next downside leg sets up.

Before we continue, be sure to opt-in to our free market trend signals 
before closing this page, so you don’t miss our next special report!

S&P 500 WEEKLY CHART OF 2008-09 CREDIT CRISIS MARKET COLLAPSE

Throughout the 2008-09 Credit Crisis market collapse, prices staged multiple recovery attempts within the downward price trend.  The first, after the initial -20.88% selloff in late 2007, resulted in a +14.83% price recovery that lasted for over 15+ weeks.  The second recovery, near the end of July 2008, resulted in a +9.56% recovery after a nearly -17% price decline.  After this brief recovery in July 2008, the price collapsed by a massive -44% from August to November 2008.

DAILY S&P 500 CHART

This Daily ES chart highlights the first two levels of resistance at 2700 & 2870 that could stall the rally and prompt a downside price move in the future. Support is currently at 2450.  We believe the 2700 level will act as a soft ceiling in the ES where price may attempt to rally, briefly, above this level, which it did yesterday, then pull back and pause as selling pressure re-enters the market.  The 2870 level may act as a hard ceiling where price may attempt to reach this level, but immediately reverse back to the downside.

Overall, we believe continued selling as a result of forward global economic expectations is the most obvious outcome where a deeper price bottom will setup sometime later this spring or early summer.

WEEKLY S&P 500 CHART

This Weekly S&P 500 chart (ES) shows a possible outcome for price going forward if another downside move starts.  A new downside price move to levels near to, or just below, the 2015~16 low price range is not unreasonable. From this level, we believe a “Flag” formation will setup creating an extended price bottom pattern down at those extreme lows.  We believe this “Flag” formation will end near August~October 2020, just before the 2020 elections and prompt the beginning of a new upside price recovery in the US and global markets.

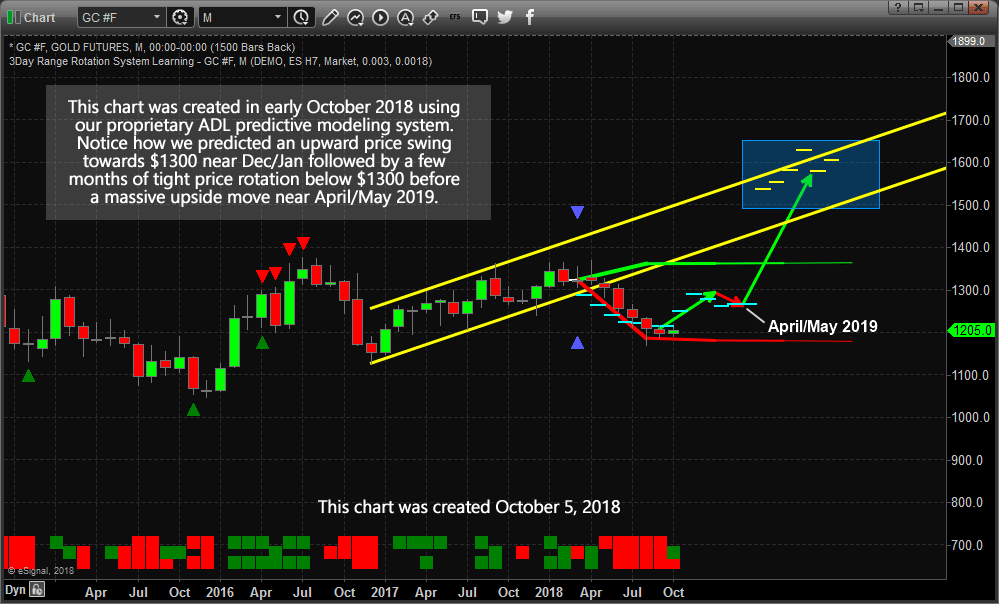
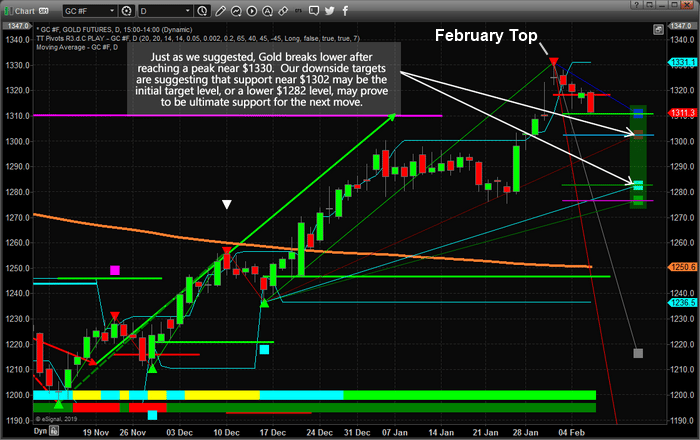
This is a large forward-looking projection and you may be rolling your eyes, but they are very possible. In fact, last year we predicted the months and price levels in which gold and oil would start new major trends, and we did this 8 months before they took place, similar to what we are proposing here.

CONCLUDING THOUGHTS:

The rotation in price setup by this brief upside price move will set up a new Fibonacci downside and upside price target range.  We believe it is essential for price to continue this type of rotation as the eventual bottom sets up in the US and global markets.  We believe the true price bottom will happen only after the virus event has subsided and global economies begin to start functioning like normal again.

Currently, there is simply too much of a world-wide disruption to expect that the bottom has already set up near last year’s (2019) brief price lows.  The scale and scope of the current downside price collapse do not properly reflect the total scope of this global virus event yet – it is still a reactionary move in price that has yet to properly digest the total scope of the global economic disruptions. There is a chance for stronger bounce/rally in the next few weeks/months if the virus can start to be contained, and that will continue to mimic that of the 2000 tech bubble. Believe it or not, there is a big similarity to what happened then, to what is happening now in terms of price action and market sentiment. Read article and see these charts.

In other words, we believe more selling will be seen in the global markets and more economic contraction will take place until we are safely beyond this virus event.  The longer the global economic shutdown continues, the more likely we are to see a deeper price bottom in the future and the more likely we are to see more extensive economic collateral damage across the world. No matter which way the markets move we will follow and trade the price action and profit. That is the benefit of following price vs trying to trade prediction, fundamental data etc.

In Part II of this research article, we’ll dig deeper into the underlying components that support our research.

As a technical analyst and trader since 1997, I have been through a few bull/bear market cycles in stocks and commodities. I believe I have a good pulse on the market and timing key turning points for investing and short-term swing traders.

I hope you found this informative, and if you would like to get a pre-market video every day before the opening bell, along with my trade alerts visit my Active ETF Trading Newsletter.

We all have trading accounts, and while our trading accounts are important, what is even more important are our long-term investment and retirement accounts. Why? Because they are, in most cases, our largest store of wealth other than our homes, and if they are not protected during a time like this, you could lose 25-50% or more of your entire net worth. The good news is we can preserve and even grow our long term capital when things get ugly like they are now and ill show you how and one of the best trades is one your financial advisor will never let you do because they do not make money from the trade/position.

If you have any type of retirement account and are looking for signals when to own equities, bonds, or cash, be sure to become a member of my Long-Term Investing Signals which we issued a new signal for subscribers.

Ride my coattails as I navigate these financial markets and build wealth while others lose nearly everything they own during the next financial crisis.

Chris Vermeulen
Chief Market Strategies
Founder of Technical Traders Ltd.

Another wild week for oil traders with missiles flying and huge overnight price swings in crude. As we recently pointed out within our current Oil research article, Oil and the Energy sector may be setting up for another great trade.  We recently commented on how the supply/demand situation for oil has changed over the past 20+ years.

With US oil production near highs and a shift taking place toward electric and hybrid vehicles, the US and global demand for oil has fallen in recent years.  By our estimates, the two biggest factors keeping oil prices below $75 ppb are the shift by consumers across the globe to move towards more energy-efficient vehicles and the massive new supply capabilities within the US.

Our researchers believe the downside price rotation in Crude Oil early this week, after the US missile attack in Iraq, suggests that global traders are just not as fearful of a disruption in oil supply as a result of any new military actions in Iraq, Iraq or anywhere near the Middle East.  If there was any real concern, then the price of Crude Oil would have spiked recently.

We talk more about what we expect with oil both the bullish and bearish outlooks in this recently recorded conversation with HoweStreet.

INVERSE ENERGY ETF ERY DAILY CHART

This leads us to believe the inverse Energy ETF, ERY, maybe setting up a very nice bottom in price below $40.  Ultimately, we believe a deeper price bottom may set up in the next 10 days where ERY may trade below the $36~37 range, but time will tell if we are correct about this or not.

Historically, price levels below $40 have resulted in some very nice long trade setups in ERY.  This ERY Daily chart highlights the Support Channel we believe exists in ERY and why we believe any entry-level below $36 is an outstanding entry point for any future upside price move.

WEEKLY ERY CHART

This Weekly ERY chart highlights the past rallies that have originated from within the Support Channel.  Pay special attention to the size and scope of these moves.  The October 2018 rally resulted in a 183% price rally.  The April 2019 rally resulted in a 57% price rally.  The July 2019 rally resulted in a 50% price rally and the last move in September 2019 resulted in a 41% price rally.

Could this next setup in ERY be preparing for another 40% to 60%+ upside price rally?

We believe the setup in ERY is very close to generating an entry trigger.  We have not issued any new trade triggers for our members-only service as we are waiting for confirmation of a potentially deeper price move in ERY.  Right now, get ready for what may become a very good setup in ERY over the next few weeks.

Watch what happens in the energy sector over the next 30 to 60 days.  We may be setting up for a fairly large price rotation as the tensions spill over into the global markets and precious metals.  We may find that Oil is the big loser over the next 60+ days.

Profit during times when most others can’t which is why you should join my Wealth Trading Newsletter for index, metals, and energy trade alerts. Visit our website to learn how you can see what this research is telling us.

SUBSCRIBE TO MY TRADE ALERTS AND 
GET YOUR FREE BULLION!

Chris Vermeulen
www.TheTechnicalTraders.com

NOTICE : Our free research does not constitute a trade recommendation or solicitation for our readers to take any action regarding this research.  It is provided for educational purposes only.  Our research team produces these research articles to share information with our followers/readers in an effort to try to keep you well informed.  Visit our web site (www.thetechnicaltraders.com) to learn how to take advantage of our members-only research and trading signals.

This week I talked with Chris Vermeulen who runs the website thetechnicaltraders.com on the current stock market rally, which has some similarities to the way the market acted in 1999 and other years of low volatility moves up.

Chris also gave his updated views on gold, silver, and some other trading setups he sees lining up now for 2020.

Get Chris’ daily video trend analysis, and detailed trade alerts for stocks, indexes, oil, and gold. Visit: https://www.TheTechnicalTraders.com

Crude Oil has been trading in a fairly narrow range since mid-August – between $52 and $57 ppb.  Our Adaptive Dynamic Learning (ADL) predictive modeling system suggested the downside price move in late July/early August was expected and the current support aligns very well with our ADL predictions of higher price rotation throughout most of September/October.  Please take a minute to review the original research post below :

July 10, 2019: PREDICTIVE MODELING SUGGEST OIL HEADED MUCH LOWER

CRUDE OIL MONTHLY CHART FORECAST

We believe the current price highs, near $59 to $60, will likely continue as strong price resistance over the next 25+ trading days before a bigger breakdown begins near Mid-October.  We expect the price to continue rotating within a fairly narrow range in alignment with our ADL predictions.  Our original article suggested a high price target area near $60 from our ADL research.  Now that Crude Oil has nearly reached this level, we believe the continued upside opportunity in Crude Oil is limited. Be sure to opt-in to our Free Trade Ideas Newsletter to get more updates.

DAILY CRUDE OIL CHART

This Daily Crude Oil Chart highlights what we believe will become resistance just below the $60 price level and suggests the $55 to $56 price level may be intermediate support.  Thus, we expect the price to rotate a bit lower, possibly into the $54 to $56 level, then stall and rotate further as we transition into the end of September.

WEEKLY CRUDE OIL CHART TREND DIRECTION

We don’t expect anything crazy to happen in Oil until later in September or into early October.  Our ADL predictive modeling suggests that Crude Oil will peak in October and begin a broader downside move towards levels just below $50.  Crude Oil may begin this move a bit earlier than our ADL system predicts because of news or some fundamental data related to oil demand/supply.  It is not uncommon for the price to move towards the ADL predicted levels many weeks before or after our Monthly ADL predictions.  When we create the Monthly ADL charts, the data represented is based on highly probable levels for the completed month.  So, we know that near the month of October or November, Oil should be targeting the sub-$50 level.

CONCLUDING THOUGHTS:

Ultimately, near the end of 2019 or into early 2020, Oil should be targeting the sub-$30 price level on a larger downside price move.  Sub-$30 Oil would likely mean that global supply/demand issues, as well as global economic concerns, would be top-tier issues.  We believe the future price moves in Crude Oil will present very clear opportunities for skilled technical traders.  Right now, we have to be patient as the price continues to rotate above $55 and below $60 before the real price moves begin to take place.

I have had a series of great trades this month. In fact, over the past 20 months, my ETF trading newsletter portfolio has generated over 100% return when compounded for members. And we locking in 5.1% profits on Tuesday with the Russell 2000 index, and also XLU for a quick 1.43% profit as well. So, if you believe in technical analysis, then this is the newsletter and market condition for you to really shine, especially with my trading indicators coming online.

As a technical analysis and trader since 1997, I have been through a few bull/bear market cycles. I believe I have a good pulse on the market and timing key turning points for both short-term swing trading and long-term investment capital. The opportunities are massive/life-changing if handled properly.

Be prepared for these price swings before they happen and learn how you can identify and trade these fantastic trading opportunities in 2019, 2020, and beyond with our  Wealth Building & Global Financial Reset Newsletter.

Join me with a subscription to lock in the lowest rate possible and ride my coattails as I navigate these financial market and build wealth while others lose nearly everything they own during the next financial crisis.

Chris Vermeulen – www.TheTechnicalTraders.com

Our researchers have identified a very rare type of price pattern that is typically associated with explosive trend changes and trends.  We call this type of pattern a “Sandwich” pattern because of how price reacts within a range.  The IWM, Russell 2000 ETF, is illustrating a nearly perfect example of this pattern right now.

Daily IWM chart (Russell 2000 Small Cap Index)

This close up view of the Daily IWM chart highlights the Sandwich pattern over the most recent 5 trading days and how price enters this volatile period, rotates around within a range, then settles near the upper or lower end of the range before a price breakout occurs.  Notice the earlier Sandwich pattern setup and how price settled near the bottom of the range before a downside price leg pushed the price much lower. It is our belief that the IWM could be setting up for a significant reversal or breakout based on this Sandwich pattern os be ready for an extended move.

Longer-term View of the Daily IWM chart

Here is a longer-term Daily IWM chart that highlights previous Sandwich patterns for you to review. We go into more detail and a very interesting setup in the IWM and transportation index that took place in 2008, same set up we see now. See charts and report here.
One thing to understand about the Sandwich pattern is that it is an early warning sign that price has reached an inflection point and will likely attempt to break out or reverse down from the ranges set up within the Sandwich pattern. Also, you can see from the examples, above, that these patterns can take many bars to form and are sometimes somewhat convoluted in structure.  The most recent Sandwich pattern is unique because it is very defined over the past 5+ days.  We believe an upside price pop to the upside could turn into a “washout high” price setup. Compare this price activity to the SPY chart and you’ll see that the IWM, Small Caps, are operating as a leading price indicator for the potential breakout/breakdown move that may happen in the immediate future.  We see similar types of price rotation, but nothing as clear as we see on the IWM chart.
The fed news is shaking things up and our analysis stats this month could be the market top. We expect Aug 19th-ish… but this month is the window we feel it may happen. Stay tuned to our research – this is going to be fun to trade.

WARNING SIGNS ABOUT GOLD, SILVER, MINERS, AND S&P 500

In early June I posted a detailed video explaining in showing the bottoming formation and gold and where to spot the breakout level, I also talked about crude oil reaching it upside target after a double bottom, and I called short term top in the SP 500 index. This was one of my premarket videos for members it gives you a good taste of what you can expect each and every morning before the Opening Bell. Watch Video Here. I then posted a detailed report talking about where the next bull and bear markets are and how to identify them. This report focused mainly on the SP 500 index and the gold miners index. My charts compared the 2008 market top and bear market along with the 2019 market prices today. See Comparison Charts Here. On June 26th I posted that silver was likely to pause for a week or two before it took another run up on June 26. This played out perfectly as well and silver is now head up to our first key price target of $17. See Silver Price Cycle and Analysis. More recently on July 16th, I warned that the next financial crisis (bear market) was scary close, possibly just a couple weeks away. The charts I posted will make you really start to worry. See Scary Bear Market Setup Charts.

CONCLUDING THOUGHTS:

In short, you should be starting to get a feel of where each commodity and asset class is headed for the next 8+ months. The next step is knowing when and what to buy and sell as these turning points take place, and this is the hard part. If you want someone to guide you through the next 12-24 months complete with detailed market analysis and trade alerts (entry, targets and exit price levels) join my ETF Trading Newsletter. Be prepared for these incredible price swings before they happen and learn how you can identify and trade these fantastic trading opportunities in 2019, 2020, and beyond with our  Wealth Building & Global Financial Reset Newsletter.  You won’t want to miss this big move, folks.  As you can see from our research, everything has been setting up for this move for many months. Join me with a 1 or 2-year subscription to lock in the lowest rate possible and ride my coattails as I navigate these financial market and build wealth while others lose nearly everything they own during the next financial crisis. As a technical analysis and trader since 1997, I have been through a few bull/bear market cycles. I believe I have a good pulse on the market and timing key turning points for both short-term swing trading and long-term investment capital. The opportunities starting to present themselves will be life-changing if handled properly.

FREE GOLD OR SILVER WITH MEMBERSHIP!

Kill two birds with one stone and subscribe for two years to get your FREE PRECIOUS METAL and get enough trades to profit through the next metals bull market and financial crisis! Chris Vermeulen – www.TheTechnicalTraders.com
Our research team believes Silver could be the Sleeper Rally setup of a lifetime for investors if the global economic cards continue to get scattered and crumpled over the next 10+ years.  The recent rally in Gold got a lot of attention last Friday (the end of May 2019).  We had been warning about this move for the past 8+ months and generated an incredible research post in early October 2018 that clearly highlighted our belief that Gold would peak above $1300 early in 2019, then stall and move toward $1270 near April/May 2019, then begin an incredible upside price rally in June/July/Aug 2019.  We couldn’t have been more clear about this prediction and we posted it publically in October 2018. See This Previous Gold Forecast Snapshot Now, our research team is going to share with you some incredible insights into what may become the most incredible trade setup we’ve seen in the past 12+ years – the Sleeper Silver Setup. Going all the way back to the early 1970s, when the Hunt Brothers ran most of the metals markets, we can see the incredible price rally in Silver from $1.28 per ounce to nearly $41.50 in late 1979.  This move setup with a very simple pattern – a high price breakout in 1973 that broke a sideways price channel and initiated a nearly 6+ year rally resulting in an incredible 3142% price increase from the lows. Could it happen again?
Well, after this incredible price peak, the price of Silver languished and moved lower, eventually bottoming in 1991 near $3.50.  After that bottom setup, the price of Silver setup another sideways price channel and traded within this range until a 2004 High Price Breakout happened AGAIN.  It seemed inconsequential at the time – a rogue high price near $8.50.  Maybe that was it and maybe price would just rotate lower back to near the $4.00 range??
This High Price Breakout setup an incredible price rally that resulted in a continue price advance over the same 6+ year span of time.  This rally was not as big as the 1974 to 1979 price rally in percentage terms, but it was much bigger in terms of price valuation.  The 1979 price peak ended at $41.50 and resulted in a $40.25 price increase whereas the 2011 price peak resulted in a $46.32 price increase. Will it happen again in our lifetime?
As incredible as it might seem, we believe Silver is setting up another High Price Breakout pattern that should conclude within the next 2 to 4 months with a price high near $22.50 to $24.00 (see our proprietary Fibonacci price modeling projections below).  After this peak is reached, hold on to your hat because we believe the upside price rally could mimic past rallies and attempt to immediately move the price of Silver to well above $85 per ounce.  Ultimately, we can only guess as to where the top of this move may end – but we can safely estimate it will likely top somewhere between $90 and $550. This, of course, will require some type of major bear market is other asset classes and possibly some global crisis but we believe it is very possible in due time.  Our predictive modeling systems will help us determine where the actual price peak will be as this unfolds over time.
And there you have it – one of the most incredible trade setups you’ll ever see in your lifetime.  Yes, it may happen twice in your life or more, but we believe this setup in Silver is just weeks or months from initiating the next upside price leg (the High Price Breakout) and we are alerting you now to be prepared. UNIQUE PHYSICAL SILVER OPPORTUNITY: We should start to see money flow into the safe-haven assets like the Utility sector, bonds, and most importantly precious metals. I anticipated this and our XLU utilities ETF taken with members was a quick 3.11% winner. Our VIX ETF trade also hit our 25% profit target within a few days of entry. Now, I have a few silver rounds here at my desk I am going to give away and ship out to anyone who buys a 1-year, or 2-year subscription to my Wealth Trading Newsletter. You can upgrade to this longer-term subscription or if you are new, join one of these two plans listed below, and you will receive:
1-Year Subscription Gets One 1oz Silver Round FREE (Could be worth hundreds of dollars) 2-Year Subscription Gets TWO 1oz Silver Rounds FREE (Could be worth a lot in the future) I only have few silver rounds I’m giving away so upgrade or join now before its too late! SUBSCRIBE TO MY TRADE ALERTS AND GET YOUR FREE SILVER ROUNDS! Chris Vermeulen

We’ve been trying to alert all of our followers of the setup in precious metals for well over 6 months.  Here is our research post from February 6, 2019 (nearly 4 months ago) that highlights our prediction of an April 21~24 momentum base and our earlier calls predicting a move above $1300, then a stall and move lower towards the base in April, then the next leg higher.

We could not have been clearer in our analysis and we predicted the bottom and rally in gold in Oct, called the top and closed our GDXJ miners position near the in February, and called for gold to bottom this April/May over 7 months in advance.


SEE GOLD PREDICTION CHART FROM OCTOBER 2018
Predicted the rally, then the correction which brings us to today
See Blog Post


SEE GOLD CORRECTION FORECAST FEB 6th
Expecting pullback to $1275 level
Read these articles and see for yourself why our research and predictive modeling system are second to none.

BECOME A TECHNICAL TRADER TODAY AND
TRADE WHAT MATTERS – PRICE ACTION! 
CLICK HERE


P.S. If you wanna see our Proprietary Trading Tools – Click Here