Our Adaptive Dynamic Learning (ADL) predictive modeling system is predicting that Crude Oil will break recent support levels near $55 and move very quickly down to levels near $50 to $51 before August 2nd, 2019. The move to near the $50 price level is likely to be a 100% measured Fibonacci price extension related to the initial downside move from $61 to $55 earlier in July 2019.
After this new downside move completes, we expect Crude Oil will form a short-term price base just above $50 that may last many days or weeks. Our earlier analysis of Oil called this move and we outline our future oil expectations. For more information about this call, please review the following research posts.
This Daily Crude Oil chart highlights the next downside price move that we are expecting will take place over the next 4 to 7 days. After the $50 to $51 lows are reached, Oil should base near these levels and begin a moderate upside move back to levels above $54. This move aligns perfectly with our earlier analysis and research and strongly suggests that oil will target a sub-$40 price level in the near future.
What does this mean for investors and traders? It means that our ADL predictive modeling system is accurately calling these moves in oil and that the sub $40 price expectations could reflect a decrease in global economic expectations over the next 6+ months. For oil to continue to fall to levels below $40, demand would have to wane or supply would have to increase globally – or both. Additionally, it would likely indicate that global expectation for the future demand for oil would be far lower than previously expected. A commodity price collapse, like this, could be an early warning sign that the global economy is slowing much faster than many expect or it could be a sign that the fundamentals in the oil market are shifting as the economy is slowing.
Either way, it appears we are headed for sub $40 price levels in oil later this year.
CRUCIAL WARNING SIGNS ABOUT GOLD, MINERS, SILVER, SP500
In early June I posted a detailed video explaining in showing the bottoming formation and gold and where to spot the breakout level, I also talked about crude oil reaching it upside target after a double bottom, and I called short term top in the SP 500 index. This was one of my premarket videos for members it gives you a good taste of what you can expect each and every morning before the Opening Bell. Watch Video Here.
I then posted a detailed report talking about where the next bull and bear markets are and how to identify them. This report focused mainly on the SP 500 index and the gold miners index. My charts compared the 2008 market top and bear market along with the 2019 market prices today. See Comparison Charts Here.
On June 26th I posted that silver was likely to pause for a week or two before it took another run up on June 26. This played out perfectly as well and silver is now head up to our first key price target of $17. See Silver Price Cycle and Analysis.
More recently on July 16th, I warned that the next financial crisis (bear market) was scary close, possibly just a couple weeks away. The charts I posted will make you really start to worry. See Scary Bear Market Setup Charts.
CONCLUDING THOUGHTS:
In short, you should be starting to get a feel of where each commodity and asset class is headed for the next 8+ months. The next step is knowing when and what to buy and sell as these turning points take place, and this is the hard part. If you want someone to guide you through the next 12-24 months complete with detailed market analysis and trade alerts (entry, targets and exit price levels) join my ETF Trading Newsletter.
Be prepared for these incredible price swings before they happen and learn how you can identify and trade these fantastic trading opportunities in 2019, 2020, and beyond with our Wealth Building & Global Financial Reset Newsletter. You won’t want to miss this big move, folks. As you can see from our research, everything has been setting up for this move for many months.
Join me with a 1 or 2-year subscription to lock in the lowest rate possible and ride my coattails as I navigate these financial market and build wealth while others lose nearly everything they own during the next financial crisis.
As a technical analysis and trader since 1997, I have been through a few bull/bear market cycles. I believe I have a good pulse on the market and timing key turning points for both short-term swing trading and long-term investment capital. The opportunities starting to present themselves will be life-changing if handled properly.
FREE GOLD OR SILVER WITH MEMBERSHIP!
Kill two birds with one stone and subscribe for two years to get yourFREE PRECIOUS METAL and get enough trades to profit through the next metalsbull market and financial crisis!
Chris Vermeulen – www.TheTechnicalTraders.com
https://thegoldandoilguy.com/wp-content/uploads/2019/07/25.png516850adminhttp://www.thegoldandoilguy.com/wp-content/uploads/2014/11/tgaoglogo.pngadmin2019-07-30 09:47:442019-07-30 09:47:44Crude Oil Should Breakdown to $51 Early This Week
On this day, celebrating fathers and all they do for families and their children, we thought we would share some really interesting research regarding the next six months trading expectations in the NASDAQ and what it means for your trading account. One element of our research involves data mining and searching for historical price correlation models. These types of elements help us identify when the price is acting normally or abnormally.
We like to focus on the NQ (NASDAQ) because its tech-heavy and is where a lot of the Capital Shift (money from other countries is flowing into as a safe/best asset class at this time).
Below, We are going to Geek-Out a little and sharing raw data values from one of our data mining utilities highlighting each month’s historical activity in the NQ.
Pay close attention to the “Total Monthly Sum” and the monthly NEG (negative) and POS (positive) values. These values show the range of price activity over the past 20 years normalized for each month. Obviously, we can’t expect the markets to adhere to these normalized values, but we can gain insight from the data retrieved by this data mining tool.
To help you understand this data we’ll focus some brief analysis on the month of June, below. June has a total monthly NEG value of -1009 and a total monthly POS value of 1410. Additionally, the NEG value is comprised of 9 months of data and the POS value is composed of 11 months of data. Therefore, the relationship between NEG and POS months is roughly 1:1 – or about equal. Overall, the positive months outweigh the negative months by 401 points. The largest monthly positive and negative values are 492 and -189. This suggests the positive price aspect of these mined data points is about 2.3:1 respectively.
The conclusion we derive from this date is that June is moderately more positive based on historical price data then negative. This data is derived from the NQ. Therefore the expectations of a positive 300 to 400 point move in the NQ for June would be in line with historical expectations. Anything beyond that range should be considered a price anomaly. These types of price anomalies to happen fairly often but are difficult to predict.
As of today, the NQ has already moved upward by over 400 points since the end of May. This price advance equaling our expected data range would suggest that the upward price move in the NQ may be very close to ending.
=====[ June Monthly Analysis ]========================
– Largest Monthly POS : 492 NEG -189.25
– Total Monthly NEG : -1009 across 9 bars – Avg = -112.11
– Total Monthly POS : 1410 across 11 bars – Avg = 128.18
——————————————–
– Total Monthly Sum : 401 across 20 bars
Analysis for the month = 6
===================================================
As you scan through the rest of these data mining results, pay very close attention to the largest monthly ranges as well as the overall price bias described by the total monthly NEG and POS values. For example, in July the monthly values are more narrow in range. Yet the total monthly NEG and POS values depict a broader range for price.
Additionally, the POS bars (13) compared to the NEG bars (6) describes a vastly different historical price relevance. The possibility of an upside price bias in July is much stronger than what we determined four June. The 13:6 ratio of upside to downside price bars in July converts into a nearly 2:1 upside price expectation versus a 1:1 ratio in June. Because of this, we can determine that July will likely result in a positive upside price move of at least 150 to 250 points in the NQ before exhausting.
=====[ July Monthly Analysis ]========================
– Largest Monthly POS : 319.75 NEG -200
– Total Monthly NEG : -656 across 6 bars – Avg = -109.33
– Total Monthly POS : 1654 across 13 bars – Avg = 127.23
——————————————–
– Total Monthly Sum : 998 across 19 bars
Analysis for the month = 7
===================================================
Our data mining tool suggests that August may be much more volatile than July. The larger monthly total sum suggests a possible breakout move to the upside. The increases in total monthly values suggest volatility will also increase. Overall the combined July and August data points suggest rotation may end with a big move to the upside sometime in late August before a correction.
=====[ August Monthly Analysis ]========================
– Largest Monthly POS : 477 NEG -313.25
– Total Monthly NEG : -835.5 across 8 bars – Avg = -104.44
– Total Monthly POS : 1702.5 across 12 bars – Avg = 141.88
——————————————–
– Total Monthly Sum : 867 across 20 bars
Analysis for the month = 8
===================================================
September data points show an immediate reversal to the upside price bias. The data reporting from our data mining tool flips to the negative side fairly strong. Overall expectations are roughly 1:1 that a downside price move will dominate for September.
Our data mining utility suggests a downside price move of between -450 and -550 points. If you’ve been following our research, you already know that we are predicting a moderately large downside reversal beginning in late August or September. It is our belief that the US stock markets will rotate downwards after a peak in price in August. We believe this downside move could last well into November, much like the downside move in 2018.
=====[ September Monthly Analysis ]========================
– Largest Monthly POS : 229 NEG -473
– Total Monthly NEG : -1460.25 across 10 bars – Avg = -146.03
– Total Monthly POS : 903.5 across 10 bars – Avg = 90.35
——————————————–
– Total Monthly Sum : -556.75 across 20 bars
Analysis for the month = 9
===================================================
Should our expectations play out in the market, the downside price move in September, October and possibly November, would result in a unique price anomaly setup near this price bottom.
As you can see from the data mining results, below, the last quarter (3 months) of the year typically results in upside price bias. Therefore, any deep downside price move after our expected peak in August will set up a very unique price anomaly pattern where skilled traders should be able to capture an incredible upside price run near the end of 2019.
=====[ October Monthly Analysis ]========================
– Largest Monthly POS : 480.25 NEG -679.75
– Total Monthly NEG : -1564.5 across 7 bars – Avg = -223.50
– Total Monthly POS : 2320.25 across 13 bars – Avg = 178.48
——————————————–
– Total Monthly Sum : 755.75 across 20 bars
Analysis for the month = 10
===================================================
=====[ November Monthly Analysis ]========================
– Largest Monthly POS : 316.5 NEG -768
– Total Monthly NEG : -1169 across 6 bars – Avg = -194.83
– Total Monthly POS : 1509 across 14 bars – Avg = 107.79
——————————————–
– Total Monthly Sum : 340 across 20 bars
Analysis for the month = 11
===================================================
Pay very close attention to the fact that December can be fairly mixed in terms of overall price bias and upside or downside price expectation. With a 1:1 (equal price weighting) for both positive and negative price results and a monthly sum of only about 100 points, we would expect December to be moderately congested and flat.
=====[ December Monthly Analysis ]========================
– Largest Monthly POS : 782 NEG -616.25
– Total Monthly NEG : -1179.5 across 10 bars – Avg = -117.95
– Total Monthly POS : 1291.5 across 10 bars – Avg = 129.15
——————————————–
– Total Monthly Sum : 112 across 20 bars
Analysis for the month = 12
===================================================
And there you have it, our Father’s Day gift to all of you. These results from our proprietary data mining utility are providing you with a detailed map of what to expect in the NQ going forward through December 2019. This is only one aspect of our research team’s resources and unique capabilities that assist us in understanding what price will be doing in the future. There are many other utilities and trading indicator tools that we use to help confirm and validate our analysis.
We’ve included a chart of the S&P E-mini futures contract with a yellow line drawn across our predicted price modeling expectations starting from the end of 2017 until now. Pay very close attention to our expected price levels and the market price levels as time progressed forward. As you become more skilled in understanding how this data can be used to benefit your trading and deliver results, you’ll learn why our research team relies on our proprietary modeling tools and software so heavily.
We thought we might share a bit of specialized data with you on this Father’s Day so that you could use some of our proprietary information in your own research and analysis going forward.
Please remember, price action dictates everything. Even though we can model and data mine incredible information months or years into the future, everything comes down to what price is doing right now. If it confirms our analysis, then fantastic – our research may be right on the money. If the price moves beyond our expectations and research, then we have to reevaluate our expectations in correlation with the data that we have to determine if we need to adjust our expectations going forward.
My point is, yes we can forecast, yes we have been correctly more times than not, but you cannot just go out and place trades based on this analysis alone because our analysis will change with the market.
To be blatantly honest, we don’t really care what the market does or when. We FOLLOW the market and trade on its coat tales, we don’t jump in front of it and guess/hope it will reverse as we are predicting.
Some of our articles/forecasts we share simply don’t happen and we get lots of flack from free followers of these articles. But what most followers fail to understand is that even when our predictions are DEAD WRONG, we and our subscribers make money in most cases. Again, we don’t trade the forecasts we just let them help guide us, and we trade with the dominant trend.
We have a good pulse on the major markets and can profit during times when most others can’t which is why you should join my Wealth Trading Newsletter for index, metals, and energy trade alerts.
I can tell you that huge moves are about to start unfolding not only in metals, or stocks but globally and some of these super cycles are going to last years. These super cycles starting to take place will go into 2020 and beyond which we lay out in our new PDF guide: 2020 Cycles – The Greatest Opportunity Of Your Lifetime
I am going to give away and ship out silver rounds to anyone who buys a 1-year, or 2-year subscription to my Wealth Trading Newsletter. You can upgrade to this longer-term subscription or if you are new, join one of these two plans listed below, and you will receive:
1-Year Subscription Gets One 1oz Silver Round FREE
(Could be worth hundreds of dollars)
2-Year Subscription Gets TWO 1oz Silver Rounds FREE
(Could be worth a lot in the future)
SUBSCRIBE TO MY TRADE ALERTS AND GET YOUR FREE SILVER ROUNDS!Free Shipping!
Happy Fathers Day Guys!
Chris Vermeulen
Founder of Technical Traders Ltd.
https://thegoldandoilguy.com/wp-content/uploads/2019/06/10.png425700adminhttp://www.thegoldandoilguy.com/wp-content/uploads/2014/11/tgaoglogo.pngadmin2019-06-16 18:02:252019-06-16 18:02:25Index Prediction System Is Telling Us A Very Different Story
We believe the current price rotation is just the beginning of something much bigger. Over the past 16+ months, we’ve been calling these tops and bottoms many months in advance. In February/March 2018, we called the bottom and initiated a call that the US stock market would rally to establish new all-time highs. Very few believed us at that time, but the markets did exactly what we predicted. In September 2018, we called for the markets to experience weakness, pause after a quick downturn, then establish an “ultimate bottom” near November 2018 before rallying back to near all-time highs again. At that time, everyone was betting the new market crash had taken over Wall Street and we were really the only ones suggesting the US stock market would rally back from the December 2018 lows. Guess what happened? The markets did exactly what we predicted and went on to hit new highs months later.
We’ve recently called the precious metals move perfectly with our originating research being done in October 2018. We called the Oil downturn in 2018 as well as the rally starting near December 2018. Now, we are going to share with you some incredible market insights and help you prepare for what will likely become the most frustrating next six months of trading for everyone.
Why is it going to be frustrating? Because everyone has already made up their minds as to what they expect to happen in the markets and WHY. We read a report today from an analyst that suggested he “moved into a defensive position and initiated positions in Inverse ETFs and Put Options”. Probably a smart move if he timed it right. What he’s going to do over the next 6 months will either make him a king or a pauper.
The fact is that the US stock market has initiated a very moderate downside price rotation recently and multiple levels of support must be breached before we could consider any of the recent downside pricing pressure as a “major trend reversal”. We believe many of these analysts are hyperventilating with regards to this move and seeing what they want to see from it – THE BEAR MARKET.
At this time, we do not agree with this narrative. Yes, the US stock market is under pricing pressure. The US/China trade deal is far from completed and the new US/Mexico tariffs are sure to roil the markets. Europe has just completed EU elections and must continue to navigate the hard questions of future management and opportunity with a BREXIT hanging over everyone’s heads. The Prime Minister of Malaysia is calling for a new “gold backed SE Asian currency” to help prevent the wild currency valuations as Malaysia saw in the mid-1990s. The US Presidential election cycle is just 15 months away and it is sure to be a blood-bath in some ways.
Could it be the start of the bear market?? Maybe, but our research suggests otherwise.
Our research suggests there is still another chance that the US stock market could bottom after these recent lows find support and rally back to near all-time highs again. Be cautious about how we stated this… “could bottom after these recent lows find support and rally back to near all-time highs again” does not mean “rally beyond recent highs” or “another leg to the upside will take place”. It means that we believe the current support will prompt a brief price rally back to “near all-time highs” before the end of August 2019.
This Weekly ES chart highlights the support levels we are watching and the peak zone near $2961. We believe the current support levels will attempt to provide a floor for price above $2630 and will prompt an upside price channel that will likely see price climb higher from recent lows.
The bottom line here for the broad stock market is that we should see bounce over the next couple weeks, then we follow the market higher with a big rally or short a collapse in price.
This chart is a little noisy with analysis and our custom indicator lines but it shows key analysis levels. The same type of setup is also taking place in the NQ – although we believe the NQ may have a bit further downside price risk than the ES or YM at the moment. We believe the support levels near $6800 and $6400 will act as a price floor and attempt to drive price moderately higher over the next 25 to 45 days. We believe the NQ will come under increased price pressure because of a capital rotation away from risk in Technology and future risk factors.
The YM is setting up very similar to the ES. Very clear support and the current price level is still relatively bullish compared to the two most recent bigger downside price moves. The idea that analysts could call this “The Big One” with little to know price confirmation is very confusing. We believe support above $23,400 will likely hold and price will begin a moderate upside price move (within a channel/pennant formation) over the next 25 to 40+ days in the YM.
One very clear exception to this analysis would be a very clear price breakdown below the lowest support level while attempting to target the December 2018 lows. Should this happen over the next 30 to 60 days without any sign of the support rotation and upward price channel we are expecting, then we would consider this analysis to have failed and we could be looking at a much bigger downside price move in the US stock markets. At this point, we don’t believe this will happen UNLESS some massive US or foreign crisis event unfolds over the next 30 to 60+ days.
We believe a shift in the “Capital Shift” process we have been discussing for the past 2+ years is still taking place. This is a “risk off” move prompted by a renewed FEAR level and currency price trends over the past 6+ months.
This currency chart clearly shows everyone is selling their currency and moving into what they believe is the safest currency which is the USD.
We believe Capital Shift process will go through a weakening process while fear drives investors out of high performing assets. This process will likely shift back towards searching for undervalued US equities as global investors seek new opportunities after these support levels prompt a base. The hunt to find returns will eventually lead everyone back into the US stock market as there is too much turmoil in the global markets currently.
If you missed this move, sit back and wait for these support levels to settle and then look for new trade opportunities. There will be lots of time to get into the BIG SHORT TRADE when it finally sets up and confirms.
https://thegoldandoilguy.com/wp-content/uploads/2019/06/9.png5871003adminhttp://www.thegoldandoilguy.com/wp-content/uploads/2014/11/tgaoglogo.pngadmin2019-06-04 12:20:202019-06-04 12:20:20Second Half of 2019 – Expect The Unexpected
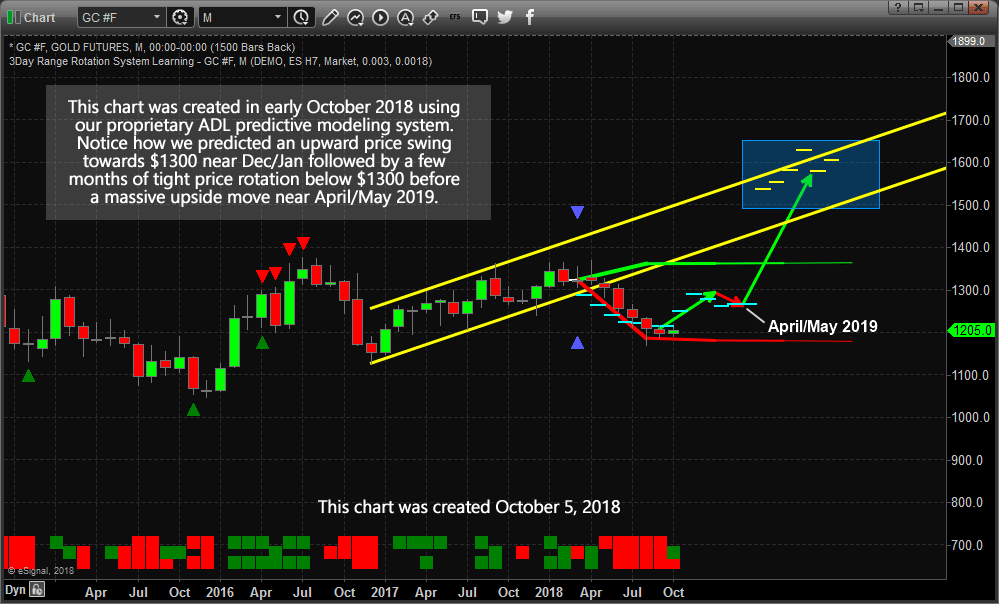
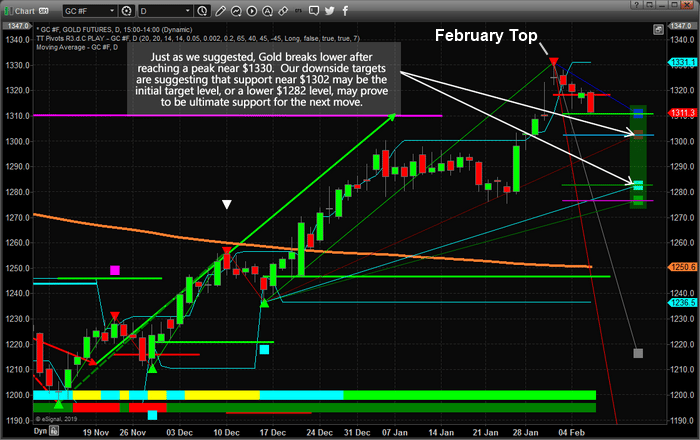
We’ve been trying to alert all of our followers of the setup in precious metals for well over 6 months. Here is our research post from February 6, 2019 (nearly 4 months ago) that highlights our prediction of an April 21~24 momentum base and our earlier calls predicting a move above $1300, then a stall and move lower towards the base in April, then the next leg higher.
Many traders are watching the recent 3-day rally thinking “this is the end of the downside price move” and targeting new entry positions for the eventual upside price breakout. We’re here to warn you that our ADL predictive modeling system is suggesting we could see more volatility over the next 45+ days before a price breakout sets up.
Our Adaptive Dynamic Learning (ADL) predictive modeling system is something we like to keep away from public view for the most part. It is not something we share with the public often because it tends to show quite a bit of information about the future to skilled eyes. Today, you are going to get a glimpse of the ADL system on Weekly and Monthly TRAN charts to help you understand what to expect over the next 45+ days.
The ADL predictive modeling system is capable of learning from past price action and modeling “price DNA markers” based on a custom inference engine we created for this utility. That means it is capable of learning from any chart, any interval, any price data and any type of price activity while mapping the price data, technical data and corresponding future price activity into what we call and DNA price chain. After that mapping process is complete, we are able to ask it to show us what it has found and how current price bars align with the DNA mapping to show us what is likely for the future.
This Monthly TRAN ADL chart shows two ADL DNA Marker data points. The first data point, April 2018, consisted of 12 unique ADL price instances and suggests a moderate upside price bias may continue until near the end of July or early August 2019. August 2019 appears to be a “price anomaly” setup with a target price level near 10,000 for that month. Thus, August 2019, or any time +/- 30 days from that month, could be very volatile. The second data point originates from June 2018 and consists of 4 unique ADL price instances. The lack of ADL price instances (4 vs 12) is not as important as the predicted outcome of this DNA marker. ADL instances with small numbers of matching instances tend to be unique price data – something that is not seen in price that often and somewhat rare. This ADL data point is predicting a moderate upside price bias until June/July 2019, then the DNA marker is telling us that a downward price bias should start and that these future predictions do not have a strong probable outcome. This means August through November 2019 could be very volatile and result in unexpected price actions.
This next chart is a Weekly TRAN ADL chart that suggests 2 or 3 more weeks of moderate upside price bias before a big decline in prices headed into June 2019. If we follow the DASH lines on this chart and count the weeks going forward, it appears June 2019 will result in a moderate price decline toward the recent lows – possibly a bit lower. Then it appears the TRAN will stall near 10,200 – possibly moving a bit higher near the middle/end of July. After that, the ADL predictive modeling system is suggesting that the TRAN will break down below the 10,200 level and potentially head much lower – towards the 9,600.
The timing of this is interesting because it suggests the current US/China trade issues will not result in more price decline for the next 30+ days. Yes, we’ll like to see more price rotation, but the potential for a massive price decline over this span of time is rather muted. We may see a retest of the 10,200 level near Mid-June, but price should find support at that time and recover towards the 10,400 to 10,500 level near early July. Mid to End July looks very weak – where price may break aggressively lower, below 10,200 and attempt to target the 9,600 level.
This next chart is a Weekly TRAN chart showing our Adaptive Fibonacci price modeling system. The Fibonacci price modeling system is one of our standard analysis tools. This utility is suggesting that price weakness may set up a Descending Flag formation over the next few weeks/months. This type of pattern suggests that a breakout move will result after the apex is reached. The YELLOW trend line on this chart may become a downside price target if our ADL predictions are correct and the TRAN price breaks down toward the 9,600 level or lower.
Take another look at the end of the first, Monthly ADL chart. See those YELLOW upside ADL arrows on the right side of the chart? Those are the current ADL predictions for October, November, December 2019. This prediction suggests that the Apex Breakout move at the end of the Descending Flag formation will be an upside price breakout sometime near the end of 2019.
Be prepared for another increase in volatility in Early June and Early/Mid July. Our predictive modeling systems are suggesting a breakdown in price will happen near these dates and this downside move should result in increased VIX/Volatility when the breakdown happens.
This does not appear to be the BIG CRASH that everyone is talking about. It appears to be a normal price pattern setup as weakness settles in and the TRAN appears to retest the 10,000 level (support) with the potential of moving slightly below this level.
We’ve just highlighted what our predictive modeling system is currently proposing will happen over the next 6+ months in the TRAN. If you know anything about the TRAN, you should be able to translate this into a trading road-map for the next 6+ months in the US markets. What is the value of having something like the ADL – being able to look into the future and see what is likely to happen 4 to 6+ months into the future? Visit www.TheTechnicalTraders.com to learn how we deploy these proprietary tools for our members to help them find and execute better trades.
This is proving to be an incredible trading year for traders who follow our trade alerts newsletter.
For active swing traders, you are going to love our daily trading analysis. On May 1st we talked about the old saying goes, “Sell in May and Go Away!” and that is exactly what is happening now right on queue. In fact, we closed out our SDS position on Thursday for a quick 3.9% profit and our other new trade started Thursday is up 20% already.
Second, my birthday is only three days away and I think its time I open the doors for a once a year opportunity for everyone to get a gift that could have some considerable value in the future.
Right now I am going to give away and shipping out silver rounds to anyone who buys a 1-year, or 2-year subscription to my Wealth Trading Newsletter. I only have a few left as they are going fast so be sure to upgrade your membership to a longer-term subscription or if you are new, join one of these two plans, and you will receive:
1-Year Subscription Gets One 1oz Silver Round FREE
(Could be worth hundreds of dollars)
2-Year Subscription Gets TWO 1oz Silver Rounds FREE
(Could be worth a lot in the future)
I only have a few more silver rounds I’m giving away
so upgrade or join now before its too late!
https://thegoldandoilguy.com/wp-content/uploads/2019/05/2.png387700adminhttp://www.thegoldandoilguy.com/wp-content/uploads/2014/11/tgaoglogo.pngadmin2019-05-16 21:09:122019-05-16 21:09:12Markets Rally Hard – Is The Volatility Move Over?
Over the past 6+ months, we’ve been covering the price rotations in precious metals very closely. We’ve issued a number of amazing calls regarding Gold and Silver over the past few months. Two of the biggest calls we’ve made were the late 2018 research post that suggested Gold would rally to above $1300, then stall. The other amazing call was our research team’s suggestion that April 21~24 would see Gold setup an Ultimate Base, or what we were calling a “Momentum Base”, near $1250 to $1275.
We issued both of these markets calls many months in advance of these dates/price levels targeting these moves. In both cases, we issued these market calls well over 60 days prior to the move actually taking place. The accuracy of these calls can be attributed to our proprietary price modeling solutions as well as the skill and techniques of our research team. Don’t mind us while we take a few seconds to take credit for some truly amazing precious metals calls over the past 6+ months.
This Weekly Gold chart highlights just about everything we have been suggesting would happen over the past 12+ months. The rally in Gold from below $1200 to almost $1350 setup an upside price leg that we believe is still just beginning. The rotation lower, after the February 2019 highs, setup the Momentum Base near April 24 – RIGHT ON TARGET. Now, the upside price advance that we’ve been predicting should launch Gold well above the $1400 price level appears to be setting up.
Our Adaptive Dynamic Learning price modeling system, as well as our Adaptive Fibonacci Price modeling system, have been key elements to unlocking these early calls. You can read more about our earlier Gold and Silver calls by reading this article: https://www.thetechnicaltraders.com/adl-predictions-for-price-of-gold/
The next leg higher for Gold will see a price peak near $1450 before another brief sideways/stalling pattern sets up. After that, our research suggests a rally will quickly drive Gold prices above $1550 (or much higher).
As we’ve been suggesting, Silver will likely lag behind Gold by about 20+ days. We believe Silver is going to see an incredible upside price move – even bigger than Gold in percentage terms. Our belief is that Silver will be trading above $26 to $28 per ounce – almost DOUBLE the recent low price level, when Gold will be trading just above $2000 per ounce. The reason for this is the relationship between the Gold/Silver/US Dollar pricing levels – called the Gold/Silver Ratio. The chart is below
When the ratio is above 0.80, we consider this to be a “Moderate Peak” zone for Gold. Where the price of Gold (per ounce) represents more than 80 ounces of Silver. The ratio of the price of Gold to the price of Silver is a fairly common measure to determine when Silver is very undervalued compared to Gold. When the ratio typically falls above 0.80, then the price of Silver is very cheap compared to the price of Gold. When this ration move above 0.90, these levels are Extreme Peaks in the disparity of pricing between Gold and Silver. These are the areas where both Gold and Silver rally back to restore a ratio level closer to 0.60 or 0.65 (or lower).
This would indicate that the price of Silver will rally much faster than the price of Gold and in order for this ratio to move back to the 0.06 level, Silver would have to rally at a rate of 1.35:1 or 1.45:1 compared to Gold.
This Weekly Silver chart highlights the levels we are watching for the upside breakout in Silver to begin – $15.40 or higher and we believe the upside price move in Silver till accelerate well above $18 per ounce very quickly. Again, the move in Silver will likely lag behind Gold by at least 20+ days. So now if the time to buy Silver in physical form (or any form) as we prepare for this move. Once it starts, we can promise you that the rally will be impressive and quick.
Watch how Gold and Oil react over the next few weeks as Fear re-enters the global markets. Our belief is that Oil will fall while Gold initiates the first leg higher, towards $1400 to $1450 before stalling. Once this happens, we can be certain a new upside price advance is beginning in Gold and this could be a fairly strong indicator that the markets are weakening and there is increased global fear.
This is proving to be an incredible trading year for traders who follow our trade alerts newsletter.
For active swing traders, you are going to love our daily trading analysis. On May 1st we talked about the old saying goes, “Sell in May and Go Away!” and that is exactly what is happening now right on queue. In fact, we closed out our SDS position on Thursday for a quick 3.9% profit and our other new trade started Thursday is up 18% already.
Second, my birthday is only three days away and I think its time I open the doors for a once a year opportunity for everyone to get a gift that could have some considerable value in the future.
Right now I am going to give away and shipping out silver rounds to anyone who buys a 1-year, or 2-year subscription to my Wealth Trading Newsletter. I only have 4 left as they are going fast so be sure to upgrade your membership to a longer-term subscription or if you are new, join one of these two plans, and you will receive:
1-Year Subscription Gets One 1oz Silver Round FREE
(Could be worth hundreds of dollars)
2-Year Subscription Gets TWO 1oz Silver Rounds FREE
(Could be worth a lot in the future)
I only have 4 more silver rounds I’m giving away
so upgrade or join now before its too late!