Chris Vermeulen, Founder of The Technical Traders joins me to focus on a couple of commodities sectors. We start off with oil and a level that Chris is watching closely to buy. Then we look at the precious metals.
3 DAYS LEFT TO GET YOUR FREE SILVER ROUNDS WITH SUBSCRIPTION!
We continue to see money flow into the safe-haven assets like the Utility sector, bonds, and most importantly precious metals. I anticipated this and our XLU utilities ETF taken with members for 4.4% already, and our VIX ETF trade we closed for a 25% last week.
For May I am going to give away and ship out silver rounds to anyone who buys a 1-year, or 2-year subscription to my Wealth Trading Newsletter. You can upgrade to this longer-term subscription or if you are new, join one of these two plans listed below, and you will receive:
The US Memorial Day weekend is set up to become a very interesting time for investors. The EU voting is complete and the change in EU leadership may move the markets a bit. China appears to be playing a waiting game – attempting to hold the US/Trump at bay until after the 2020 US elections. This week is certain to be very interesting for traders/investors.
The European stocks moved higher in trading on Monday as the relief from the EU election event and support for auto shares pushed the markets higher. The transition in the EU over the next few months will solidify into a political and social agenda. The EU leadership must acknowledge these future objectives of all parties in order to maintain some level of calm. It is evident that many EU nations are relatively satisfied with the current leadership while others are transitioning into more centrist leadership. The next 4+ years will be full of further transition in the EU.
China is another global issue that is relatively unsettled. We’ve been doing some research with regards to China and the potential future political and economic pathways that may become evident in the near-term future. Our biggest concern is that China has been inflating their economic levels for decades and the true scope of the Chinese economy may be much weaker than everyone expects. If our suspicions are correct and China has been inflating economic levels for many years, then the transition to a consumer/services-driven economy may be dramatically over-inflated and the US/China trade issues could be biting much harder than the Chinese want to admit.
The “Sell in May and go away” market saying may become absolute truth in 2019. Our expectations are still suggesting that an attempt at new market highs may take place before August 2019, but the current market rotation (lower) is setting up a very strong potential for further downside price action at the moment. Our proprietary Fibonacci price modeling system is suggesting the $7294 level in the NQ is key support. Below this level, the NQ could break much lower and potentially target $6850 or lower.
The YM is setting up a similar price pattern with resistance near 25,840. We believe this resistance will push prices lower as we move further into early June. The potential for some type of surprise economic data or Fed/Global market move after this weekend is somewhat higher than expected. There is a lot of shifting taking place throughout the globe and we believe this turbulence will reflect in the US market soon enough.
As of right now, our expectations are that a brief upside price rally will take place over the next 4~7+ days before a continued downside price trend may become evident. Pay attention to the news cycles for key elements that could drive the US stock market lower. We will continue to update you with regards to our proprietary research and expectations. The next 7+ days will likely be nothing but sideways price rotation within a Pennant/Flag formation.
Read our research to understand how this setup coincides with the GOLD price setup and why it is important to understand why July 2019 is so important. Please take a minute to review these recent research posts that focus more on the US Dollar and Gold, and also the July turning point for US Stocks.
4 DAYS LEFT TO GET YOUR FREE SILVER ROUNDS WITH SUBSCRIPTION!
We continue to see money flow into the safe-haven assets like the Utility sector, bonds, and most importantly precious metals. I anticipated this and our XLU utilities ETF taken with members for 4.4% already, and our VIX ETF trade we closed for a 25% last week.
For May I am going to give away and ship out silver rounds to anyone who buys a 1-year, or 2-year subscription to my Wealth Trading Newsletter. You can upgrade to this longer-term subscription or if you are new, join one of these two plans listed below, and you will receive:
https://thegoldandoilguy.com/wp-content/uploads/2019/05/27.png368700adminhttp://www.thegoldandoilguy.com/wp-content/uploads/2014/11/tgaoglogo.pngadmin2019-05-27 14:58:242019-05-27 14:58:24US Memorial Day Weekend Market Analysis
Our research team, at www.TheTechnicalTraders.com, have been pouring over the charts and data to identify what is likely to happen over the next 60+ days in terms of global stock market volatility vs. the US stock market expectations. Recently, we posted a research article highlighting our Adaptive Dynamic Learning (ADL) predictive modeling system on the Transportation Index (https://www.thetechnicaltraders.com/markets-rally-hard-is-the-volatility-move-over/). This research suggests we are still going to experience increased price volatility over the next 30 to 60+ days and that price rotation may become somewhat of a normal expectation throughout the rest of 2019.
We believe the key to understanding price volatility over the next 30+ days lies in understanding the potential causes of uncertainty and capital shifts that are taking place around the globe.
Next week, On May 23~26, 2019, the European Elections take place (https://www.telegraph.co.uk/politics/0/european-elections-2019-uk-vote-date-results/). This voting encompasses all 26 EU nations where all 753 European Parliament seats may come into question. The biggest issues are BREXIT and continue EU leadership and economic opportunities for members. The contentious pre and post-election rancor could drive wild price swings in the global markets over the next 10+ days.
A tough stance between both nations, the United States and China, have left trade talks completely unresolved (https://www.reuters.com/article/us-usa-trade-china/chinas-tough-trade-rhetoric-leaves-talks-with-u-s-in-limbo-idUSKCN1SN207). At this point, the currency market is attempting to absorb much of the future expectations while the US/China stock markets react to immediate news events and perceived future economic outcomes. Overall, until this issue is resolved for both nations, the news cycles will likely drive increased price volatility across the global markets.
The US 2020 Presidential Elections are ramping up with over 24 Democratic potentials attempting to unseat President Trump. The current new from DC regarding the continued DOJ investigations and political posturing regarding Barr, Nadler and a host of other DC actors is setting up for a “cliff hanger” outcome over the next 12+ months. This will likely become one of the most hotly contested US Presidential election events in decades. The news of investigations, political corruption, and a potential US political “coup” attempt is certain to keep everyone guessing over the next 2+ years.
The markets are reacting to this volatility by attempting to adjust valuations expectations and future economic outcomes in multiple forms; currency price valuations (attempting to adjust to a shifting future economic landscape as well as to attempt to mitigate risk/capital/credit issues), Stock Market price valuations (attempting to further mitigate risk/capital and credit issues, and debt rates (attempting to effectively price risk and output expectations for the future).
Here is a map of the Currency Market over the past 12 months. We can see the dramatic shift that has taken place since the price peak in February 2018.
Overall, the US Dollar has continued to strengthen over the past 12+ months and is regaining the “King Dollar” status as the global uncertainty continue to plague foreign and EU markets. We don’t expect this to change in the near future.
Our continued research into the current price rotation in the US and global markets suggest that we are going to continue to experience moderately high price volatility across all markets over the next 30 to 60+ days – possibly well into the end of 2019. As we suggested, above, the uncertainty relating to the multiple election events and global trade/geopolitical events do not present a foundation of calm and collected future guidance. The only thing we can suggest regarding these future expectations is that the US and more mature global markets should be able to navigate these uncertain times much more effectively than emerging or “at risk” foreign markets.
Below, you will see a global Heat-Map spanning one week. Traders should take special notice that certain EU countries are surviving the recent global price rotation quite well (France, Netherlands, Switzerland, Ireland, Germany, and others). We believe this is the result of the fact that these economies are rather mature and consistent in their output and expectations. Pay attention to the South American, Asian and Caribbean nations. It would appear that a fairly strong price contraction is taking place throughout much of these nations as the focus shifts towards the more mature markets.
The following One Month global Heat-Map highlights a slightly different economic picture for some nations, yet confirms the shorter-term (weekly) trends for many others. Bermuda, Cayman, Germany, and Switzerland appear to be the Bullish Leaders over the past 30 days while the rest of the globe appears to be slipping into Bearish price trends. Canada and the UK appear moderately mixed with some green showing on the heat-map – which would be expected as both of these nations are considered mature global economies with strong economic ties to the US.
We believe the next 10~30+ days are going to be filled with moderate price volatility and we expect a setup in the global markets, near the end of June 2019, where a massive price volatility explosion may take place. This could be correlated with some trade issue, some fallout of the EU elections or some breakdown in credit/debt risks taking place between now and September 2019. We’ll go into more detail in Part II of this research post.
This is proving to be an incredible trading year for traders who follow our trade alerts newsletter.
For active swing traders, you are going to love our daily trading analysis. On May 1st we talked about the old saying goes, “Sell in May and Go Away!” and that is exactly what is happening now right on queue. In fact, we closed out our SDS position on Thursday for a quick 3.9% profit and our other new trade started Thursday is up 18% already.
Second, my birthday is only three days away and I think its time I open the doors for a once a year opportunity for everyone to get a gift that could have some considerable value in the future.
Right now I am going to give away and shipping out silver rounds to anyone who buys a 1-year, or 2-year subscription to my Wealth Trading Newsletter. I only have a few more left as they are going fast so be sure to upgrade your membership to a longer-term subscription or if you are new, join one of these two plans, and you will receive:
1-Year Subscription Gets One 1oz Silver Round FREE
(Could be worth hundreds of dollars)
2-Year Subscription Gets TWO 1oz Silver Rounds FREE
(Could be worth a lot in the future)
I only have a few more silver rounds I’m giving away
so upgrade or join now before its too late!
https://thegoldandoilguy.com/wp-content/uploads/2019/05/7.png359700adminhttp://www.thegoldandoilguy.com/wp-content/uploads/2014/11/tgaoglogo.pngadmin2019-05-20 10:07:242019-05-20 10:07:24US vs. Global Sector Rotation – What Next? Part 1
Many traders are watching the recent 3-day rally thinking “this is the end of the downside price move” and targeting new entry positions for the eventual upside price breakout. We’re here to warn you that our ADL predictive modeling system is suggesting we could see more volatility over the next 45+ days before a price breakout sets up.
Our Adaptive Dynamic Learning (ADL) predictive modeling system is something we like to keep away from public view for the most part. It is not something we share with the public often because it tends to show quite a bit of information about the future to skilled eyes. Today, you are going to get a glimpse of the ADL system on Weekly and Monthly TRAN charts to help you understand what to expect over the next 45+ days.
The ADL predictive modeling system is capable of learning from past price action and modeling “price DNA markers” based on a custom inference engine we created for this utility. That means it is capable of learning from any chart, any interval, any price data and any type of price activity while mapping the price data, technical data and corresponding future price activity into what we call and DNA price chain. After that mapping process is complete, we are able to ask it to show us what it has found and how current price bars align with the DNA mapping to show us what is likely for the future.
This Monthly TRAN ADL chart shows two ADL DNA Marker data points. The first data point, April 2018, consisted of 12 unique ADL price instances and suggests a moderate upside price bias may continue until near the end of July or early August 2019. August 2019 appears to be a “price anomaly” setup with a target price level near 10,000 for that month. Thus, August 2019, or any time +/- 30 days from that month, could be very volatile. The second data point originates from June 2018 and consists of 4 unique ADL price instances. The lack of ADL price instances (4 vs 12) is not as important as the predicted outcome of this DNA marker. ADL instances with small numbers of matching instances tend to be unique price data – something that is not seen in price that often and somewhat rare. This ADL data point is predicting a moderate upside price bias until June/July 2019, then the DNA marker is telling us that a downward price bias should start and that these future predictions do not have a strong probable outcome. This means August through November 2019 could be very volatile and result in unexpected price actions.
This next chart is a Weekly TRAN ADL chart that suggests 2 or 3 more weeks of moderate upside price bias before a big decline in prices headed into June 2019. If we follow the DASH lines on this chart and count the weeks going forward, it appears June 2019 will result in a moderate price decline toward the recent lows – possibly a bit lower. Then it appears the TRAN will stall near 10,200 – possibly moving a bit higher near the middle/end of July. After that, the ADL predictive modeling system is suggesting that the TRAN will break down below the 10,200 level and potentially head much lower – towards the 9,600.
The timing of this is interesting because it suggests the current US/China trade issues will not result in more price decline for the next 30+ days. Yes, we’ll like to see more price rotation, but the potential for a massive price decline over this span of time is rather muted. We may see a retest of the 10,200 level near Mid-June, but price should find support at that time and recover towards the 10,400 to 10,500 level near early July. Mid to End July looks very weak – where price may break aggressively lower, below 10,200 and attempt to target the 9,600 level.
This next chart is a Weekly TRAN chart showing our Adaptive Fibonacci price modeling system. The Fibonacci price modeling system is one of our standard analysis tools. This utility is suggesting that price weakness may set up a Descending Flag formation over the next few weeks/months. This type of pattern suggests that a breakout move will result after the apex is reached. The YELLOW trend line on this chart may become a downside price target if our ADL predictions are correct and the TRAN price breaks down toward the 9,600 level or lower.
Take another look at the end of the first, Monthly ADL chart. See those YELLOW upside ADL arrows on the right side of the chart? Those are the current ADL predictions for October, November, December 2019. This prediction suggests that the Apex Breakout move at the end of the Descending Flag formation will be an upside price breakout sometime near the end of 2019.
Be prepared for another increase in volatility in Early June and Early/Mid July. Our predictive modeling systems are suggesting a breakdown in price will happen near these dates and this downside move should result in increased VIX/Volatility when the breakdown happens.
This does not appear to be the BIG CRASH that everyone is talking about. It appears to be a normal price pattern setup as weakness settles in and the TRAN appears to retest the 10,000 level (support) with the potential of moving slightly below this level.
We’ve just highlighted what our predictive modeling system is currently proposing will happen over the next 6+ months in the TRAN. If you know anything about the TRAN, you should be able to translate this into a trading road-map for the next 6+ months in the US markets. What is the value of having something like the ADL – being able to look into the future and see what is likely to happen 4 to 6+ months into the future? Visit www.TheTechnicalTraders.com to learn how we deploy these proprietary tools for our members to help them find and execute better trades.
This is proving to be an incredible trading year for traders who follow our trade alerts newsletter.
For active swing traders, you are going to love our daily trading analysis. On May 1st we talked about the old saying goes, “Sell in May and Go Away!” and that is exactly what is happening now right on queue. In fact, we closed out our SDS position on Thursday for a quick 3.9% profit and our other new trade started Thursday is up 20% already.
Second, my birthday is only three days away and I think its time I open the doors for a once a year opportunity for everyone to get a gift that could have some considerable value in the future.
Right now I am going to give away and shipping out silver rounds to anyone who buys a 1-year, or 2-year subscription to my Wealth Trading Newsletter. I only have a few left as they are going fast so be sure to upgrade your membership to a longer-term subscription or if you are new, join one of these two plans, and you will receive:
1-Year Subscription Gets One 1oz Silver Round FREE
(Could be worth hundreds of dollars)
2-Year Subscription Gets TWO 1oz Silver Rounds FREE
(Could be worth a lot in the future)
I only have a few more silver rounds I’m giving away
so upgrade or join now before its too late!
https://thegoldandoilguy.com/wp-content/uploads/2019/05/2.png387700adminhttp://www.thegoldandoilguy.com/wp-content/uploads/2014/11/tgaoglogo.pngadmin2019-05-16 21:09:122019-05-16 21:09:12Markets Rally Hard – Is The Volatility Move Over?
Chris Vermeulen. Founder of The Technical Traders joins me to share his thoughts on the recent flow of money into safe haven assets. During the selloff, yesterday in US markets money moved into bonds, gold, and back into the USD. We discuss just how long this run could last and which sectors Chris is the most bullish on.
This is proving to be an incredible trading year for traders who follow our trade alerts newsletter.
For active swing traders, you are going to love our daily trading analysis. On May 1st we talked about the old saying goes, “Sell in May and Go Away!” and that is exactly what is happening now right on queue. In fact, we closed out our SDS position on Thursday for a quick 3.9% profit and our other new trade started Thursday is up 18% already.
Second, my birthday is only three days away and I think its time I open the doors for a once a year opportunity for everyone to get a gift that could have some considerable value in the future.
Right now I am going to give away and shipping out silver rounds to anyone who buys a 1-year, or 2-year subscription to my Wealth Trading Newsletter. I only have 3 left as they are going fast so be sure to upgrade your membership to a longer-term subscription or if you are new, join one of these two plans, and you will receive:
1-Year Subscription Gets One 1oz Silver Round FREE
(Could be worth hundreds of dollars)
2-Year Subscription Gets TWO 1oz Silver Rounds FREE
(Could be worth a lot in the future)
I only have 3 more silver rounds I’m giving away
so upgrade or join now before its too late!
https://thegoldandoilguy.com/wp-content/uploads/2019/05/chart17.jpeg450600adminhttp://www.thegoldandoilguy.com/wp-content/uploads/2014/11/tgaoglogo.pngadmin2019-05-15 17:48:222019-05-15 17:48:22How Sustainable Is The Move Into Safe Havens?
Over the past 6+ months, we’ve been covering the price rotations in precious metals very closely. We’ve issued a number of amazing calls regarding Gold and Silver over the past few months. Two of the biggest calls we’ve made were the late 2018 research post that suggested Gold would rally to above $1300, then stall. The other amazing call was our research team’s suggestion that April 21~24 would see Gold setup an Ultimate Base, or what we were calling a “Momentum Base”, near $1250 to $1275.
We issued both of these markets calls many months in advance of these dates/price levels targeting these moves. In both cases, we issued these market calls well over 60 days prior to the move actually taking place. The accuracy of these calls can be attributed to our proprietary price modeling solutions as well as the skill and techniques of our research team. Don’t mind us while we take a few seconds to take credit for some truly amazing precious metals calls over the past 6+ months.
This Weekly Gold chart highlights just about everything we have been suggesting would happen over the past 12+ months. The rally in Gold from below $1200 to almost $1350 setup an upside price leg that we believe is still just beginning. The rotation lower, after the February 2019 highs, setup the Momentum Base near April 24 – RIGHT ON TARGET. Now, the upside price advance that we’ve been predicting should launch Gold well above the $1400 price level appears to be setting up.
Our Adaptive Dynamic Learning price modeling system, as well as our Adaptive Fibonacci Price modeling system, have been key elements to unlocking these early calls. You can read more about our earlier Gold and Silver calls by reading this article: https://www.thetechnicaltraders.com/adl-predictions-for-price-of-gold/
The next leg higher for Gold will see a price peak near $1450 before another brief sideways/stalling pattern sets up. After that, our research suggests a rally will quickly drive Gold prices above $1550 (or much higher).
As we’ve been suggesting, Silver will likely lag behind Gold by about 20+ days. We believe Silver is going to see an incredible upside price move – even bigger than Gold in percentage terms. Our belief is that Silver will be trading above $26 to $28 per ounce – almost DOUBLE the recent low price level, when Gold will be trading just above $2000 per ounce. The reason for this is the relationship between the Gold/Silver/US Dollar pricing levels – called the Gold/Silver Ratio. The chart is below
When the ratio is above 0.80, we consider this to be a “Moderate Peak” zone for Gold. Where the price of Gold (per ounce) represents more than 80 ounces of Silver. The ratio of the price of Gold to the price of Silver is a fairly common measure to determine when Silver is very undervalued compared to Gold. When the ratio typically falls above 0.80, then the price of Silver is very cheap compared to the price of Gold. When this ration move above 0.90, these levels are Extreme Peaks in the disparity of pricing between Gold and Silver. These are the areas where both Gold and Silver rally back to restore a ratio level closer to 0.60 or 0.65 (or lower).
This would indicate that the price of Silver will rally much faster than the price of Gold and in order for this ratio to move back to the 0.06 level, Silver would have to rally at a rate of 1.35:1 or 1.45:1 compared to Gold.
This Weekly Silver chart highlights the levels we are watching for the upside breakout in Silver to begin – $15.40 or higher and we believe the upside price move in Silver till accelerate well above $18 per ounce very quickly. Again, the move in Silver will likely lag behind Gold by at least 20+ days. So now if the time to buy Silver in physical form (or any form) as we prepare for this move. Once it starts, we can promise you that the rally will be impressive and quick.
Watch how Gold and Oil react over the next few weeks as Fear re-enters the global markets. Our belief is that Oil will fall while Gold initiates the first leg higher, towards $1400 to $1450 before stalling. Once this happens, we can be certain a new upside price advance is beginning in Gold and this could be a fairly strong indicator that the markets are weakening and there is increased global fear.
This is proving to be an incredible trading year for traders who follow our trade alerts newsletter.
For active swing traders, you are going to love our daily trading analysis. On May 1st we talked about the old saying goes, “Sell in May and Go Away!” and that is exactly what is happening now right on queue. In fact, we closed out our SDS position on Thursday for a quick 3.9% profit and our other new trade started Thursday is up 18% already.
Second, my birthday is only three days away and I think its time I open the doors for a once a year opportunity for everyone to get a gift that could have some considerable value in the future.
Right now I am going to give away and shipping out silver rounds to anyone who buys a 1-year, or 2-year subscription to my Wealth Trading Newsletter. I only have 4 left as they are going fast so be sure to upgrade your membership to a longer-term subscription or if you are new, join one of these two plans, and you will receive:
1-Year Subscription Gets One 1oz Silver Round FREE
(Could be worth hundreds of dollars)
2-Year Subscription Gets TWO 1oz Silver Rounds FREE
(Could be worth a lot in the future)
I only have 4 more silver rounds I’m giving away
so upgrade or join now before its too late!
In PART I of this report we talked about and showed you the charts of the Hang Seng and DAX index charts and what is likely to unfold. In today’s report here we touch on the US markets. As we’ve suggested within our earlier research posts this year, US election cycles tend to prompt massive price rotations when the election cycles are intense. For example, the 2000 election of George W. Bush prompted a very mild price rotation in 1999~2000. This was likely because the transition from Clinton to Bush II was not overly contentious. The 2008 election of Barrack Obama was a moderately contested election cycle and happened at the time of the biggest credit market collapse in modern history – thus, the markets were well on their way lower 12+ months before the elections. The 2012 election cycle showed moderate price rotation as it was a highly contested election event in the US. The 2015-16 election event was highly contested as well and the price rotation near this time appears longer and deeper than the 2012 event.
Now, in 2020, we have one of the biggest, most highly contested US election cycles in recent history unfolding and we have already begun to see a price range /rotation over the past 12+ months that suggests we could see even bigger price rotation. If we add into this mix the US/China trade issues, global market concerns, US political rhetoric, and other issues, we have a recipe for A BIG MOVE setting up.
Our analysis still suggests that we are poised for an attempt at fresh new all-time highs before any massive price rotation takes place (near the upper trend line). Yet, we believe the downside price rotation is an eventual component of the next 16+ months of the US election cycle and the future price advance that should take place in the near future. In other words, we believe the markets are setting up for a bigger shake-out throughout this election cycle/trade issue event that will prompt lower prices before the end of 2019. We do believe the markets will settle and resume an upward trend bias after this downside price rotation – yet we don’t know exactly when that will happen.
To the best of our ability to predict the future, we can state this at the moment. It appears the end of 2019 will be filled with large price rotation – likely to the downside as trade issues and election/political issues cause a “shock-wave” in the markets. We believe early 2020 will see a relief rally that may setup a bigger price move throughout the remainder of 2020. Right now, traders need to be prepared for an incredible increase in volatility and price rotation. It is very likely that we will see a VIX level above 40 at some point before the end of 2019. This is a time for skilled traders to get in, get profits and get out. Position trading over the next 12+ months will be very difficult.
For active swing traders, you are going to love our daily trading analysis. On May 1st we talked about the old saying goes, “Sell in May and Go Away!” and that is exactly what is happening now right on queue. In fact, we closed out our SDS position on Thursday for a quick 3.9% profit and our other new trade started Thursday is up 18% already.
Second, my birthday is only three days away and I think its time I open the doors for a once a year opportunity for everyone to get a gift that could have some considerable value in the future.
Right now I am going to give away and shipping out silver rounds to anyone who buys a 1-year, or 2-year subscription to my Wealth Trading Newsletter. I only have 5 left as they are going fast so be sure to upgrade your membership to a longer-term subscription or if you are new, join one of these two plans, and you will receive:
1-Year Subscription Gets One 1oz Silver Round FREE
(Could be worth hundreds of dollars)
2-Year Subscription Gets TWO 1oz Silver Rounds FREE
(Could be worth a lot in the future)
I only have 5 more silver rounds I’m giving away
so upgrade or join now before its too late!
https://thegoldandoilguy.com/wp-content/uploads/2019/05/chart15.png427700adminhttp://www.thegoldandoilguy.com/wp-content/uploads/2014/11/tgaoglogo.pngadmin2019-05-14 11:25:002019-05-14 11:25:00Trade Issues Will Drive Market Trends – PART II
This is a delayed video sample of what I share with members to my Wealth Trading Newsletter each and every morning
before the market opens. Learn, Be Alerted, and Profit!
https://thegoldandoilguy.com/wp-content/uploads/2019/05/chart13-1.png6821024adminhttp://www.thegoldandoilguy.com/wp-content/uploads/2014/11/tgaoglogo.pngadmin2019-05-13 11:25:202019-05-13 11:25:20How To Trade The Current Market Volatility/Crash/Recovery
It is becoming evident that the US/Chinese trade issues are going to become a point of contention for the markets going forward. We’ve been review as much news as possible in an attempt to build a consensus for the future of the US markets and global markets. As of last week, it appears any potential trade deal with China has reset back to square one. The news we are reading suggests that China wants to reset their commitments with the US, remove all tariffs and wants the US to commit to buying certain levels of Chinese goods in the future. Additionally, China has yet to commit to stopping the IP/Technology theft from US companies – which is a very big contention for the US.
This suggests the past 6+ months of trade talks have completely broken down and that this trade issue will likely become a market driver over the next 12+ months. The global markets had anticipated a deal to be reached by the end of March 2019. At that time, Trump announced that he was extending talks with China without installing any new tariffs. The intent was to show commitment with China to reach a deal at that time – quickly.
It appears that China had different plans – the intention to delay and ignore US requests. It is very likely that China has worked to secure some type of “plan B” type of scenario over the past 6+ months and they may feel they are negotiating from a position of power at this time. Our assumption is that both the US and China feel their interests are best served by holding their cards close to their chests while pushing the other side to breakdown through prolonged negotiations.
Our observations are that an economic shift is continuing to take place throughout the globe that may see these US/China trade issues become the forefront issue over the next 12 to 24 months – possibly lasting well past the November 2020 US Presidential election cycle. It seems obvious that China is digging in for a prolonged negotiation process while attempting to hold off another round of tariffs from the US. Additionally, China is dealing with an internal process of trying to shift away from “shadow banking” to eliminate the risks associated with unreported corporate and private debt issues.
The limited, yet still valid, resources we have from within China are suggesting that layoffs are very common right now and that companies are not hiring as they were just a few months ago. One of our friends/sources suggested the company he worked for has been laying off employees for over 30 days now and he just found out he was laid-off last week. He works in the financial field.
We believe the long term complications resulting from a prolonged US/China trade war may create a foundational shift within the global markets over the next 16 to 24+ months headed into the November 2020 US Elections. We’ve already authored articles about how the prior 24 months headed into major US elections tend to be filled with price rotation while an initial downside price move is common within about 16+ months of a major US election event. This year may turn out to prompt an even bigger price rotation.
US Stock Market volatility just spiked to levels well above 20 – levels not seen since October/November 2018, when the markets fell nearly 20% before the end of 2018. The potential for increased price volatility over the next 12+ months seems rather high with all of the foreign positioning and expectations that are milling around. It seems like the next 16+ months could be filled with incredibly high volatility, price rotation and opportunity for skilled traders.
Our primary concern is that the continued trade war between the US and China spills over into other global markets as a constricted price range based trading environment. Most of the rest of the world is still trying to spark some increased levels of economic growth after the 2008-09 market crisis. The current market environment does not settle well for investor confidence, growth, and future success. The combination of a highly contested US Presidential election, US/China trade issues, a struggling general foreign market, currency fluctuations attempting to mitigate capital risks and other issues, it seems the global stock markets are poised for a very big increase in volatility and price rotation over the next 2 years or so.
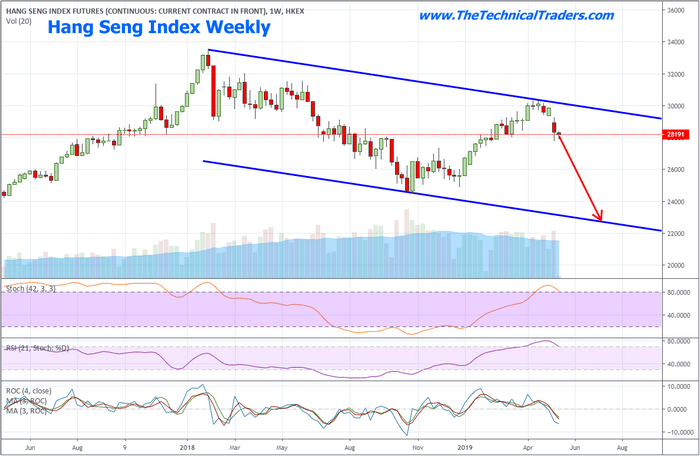
Our first focus is on the Hang Seng Index. This Weekly chart shows just how dramatic the current price rotation has been over the past few weeks and how a defined price channel could be setting up in the HSI to prompt a much larger downside objective. Should continue trade issues persist and should China, through the course of negotiating with the US, expose any element of risk perceived by the rest of the world, the potential for further price contraction is very real. China is walking a very fine line right now as Trump is pushing issues (trade issues and IP/Technology issues) to the forefront of the trade negotiations. In our opinion, the very last thing China wants is their dirty laundry, shady deals and political leadership strewn across the global news cycles over the next 24+ months.
The DAX Weekly Index is showing a similar price pattern. A very clear upper price trend channel which translates into a very clear downside price objective is price continues lower. Although the DAX is not related directly to the US/China trade negotiations, the global markets are far more interconnected now than ever before. Any rotation lower in China will likely result in a moderate price decrease in many of the major global market indexes.
As we’ve suggested within our earlier research posts, US election cycles tend to prompt massive price rotations when the election cycles are intense. In our next post PART II of this report, we talk about what happened in the past election cycles reviewing the monthly charts and weekly SP500 index charts which are very telling in what could be about to happen next for the stock market from an investors standpoint.
For active swing traders, you are going to love our daily trading analysis. On May 1st we talked about the old saying goes, “Sell in May and Go Away!” and that is excactly what is happening now right on queue. In fact, we closed out our SDS position on Thursday for a quick 3.9% profit and our other new trade started Thursday is up 18% already.
Second, my birthday is only three days away and I think its time I open the doors for a once a year opportunity for everyone to get a gift that could have some considerable value in the future.
Right now I am going to give away and shipping out silver rounds to anyone who buys a 1-year, or 2-year subscription to my Wealth Trading Newsletter. I only have 7 left as they are going fast so be sure to upgrade your membership to a longer-term subscription or if you are new, join one of these two plans, and you will receive:
1-Year Subscription Gets One 1oz Silver Round FREE
(Could be worth hundreds of dollars)
2-Year Subscription Gets TWO 1oz Silver Rounds FREE
(Could be worth a lot in the future)
I only have 13 more silver rounds I’m giving away
so upgrade or join now before its too late!
https://thegoldandoilguy.com/wp-content/uploads/2019/05/chart11.png429700adminhttp://www.thegoldandoilguy.com/wp-content/uploads/2014/11/tgaoglogo.pngadmin2019-05-13 10:42:202019-05-13 10:42:20How Chinese Trade Issues Will Drive Market Trends
Today, the US increased tariffs on $200B of Chinese goods as the US/China trade deal breaks down. China has vowed to retaliate for the move. The past week has seen the global markets shocked by two items: Iran sanctions and US/China trade breakdown. The markets had been expecting a US/China trade deal to be reached and optimism was quite high – hence the rally in the Chinese stock market and the rally in the US stock market. What next?
Well, we believe this news, as well as future news that will likely hit the markets over the next 3+ months, will continue to prompt the Shake-Out we have been warning about. Depending on how severe these news events are, the rotation in the markets could be quite severe as well.
Our recent analysis suggests that recent lows in the US stock market may be near-term support and that the US stock market may attempt to form a bottom near these lows. Our research shows the Transportation Index is leading this move. We believe the ORANGE Moving Average level, as well as the RED and GREY Fibonacci projection points, will act as a temporary price floor this week and next. The YM could move lower by 100 to 200 points today, retesting these low levels, before recovering near the end of the day.
Gold is showing signs of a potential upside price leg in the early stages, just as we had been suggesting. Our April 21~24 momentum base call from months ago appears to be incredibly accurate. At this point, we are just waiting for the upside price swing to begin. When it starts, the momentum behind this upside move will increase as it will catch the attention of many gold traders and solidify the “fear” aspect of this move.
Silver is still lagging behind Gold – as usual. We continue to believe the real opportunity for a great trade lies in Silver. The potential for a $22 o ~$28 upside price swing on a market breakdown or fear play is still very solid. Headed into the 2020 US election cycle and with all the uncertainty in the global markets, we believe this is the “sleeper trade” of the next 16+ months. When Gold begins to breakout to the upside, Silver should follow about 20 days later.
These new US trade tariffs puts pressure on China to come to the table and develop and honest deal. This is not the old way of slow negotiations with no real consequences. For China, the lack of access to the US market could be devastating in both the short and long run. Skilled traders should not be overly optimistic throughout this weekend. Protect your longs and prepare for more news over the next few weeks. This is the type of market that will make or break many traders.
UNIQUE OPPORTUNITY ONLY IN MAY
On May 1st we talked about the old saying goes, “Sell in May and Go Away!” and that is excactly what is happening now right on queue. In fact, we closed out our SDS position on Thursday for a quick 3.9% profit and our other new trade started Thursday is up 18% already.
Second, my birthday is only a few days away and I think its time I open the doors for a once a year opportunity for everyone to get a gift that could have some considerable value in the future.
Right now I am going to give away and shipping out silver rounds to anyone who buys a 1-year, or 2-year subscription to my Wealth Trading Newsletter. I only have 11 left as they are going fast so be sure to upgrade your membership to a longer-term subscription or if you are new, join one of these two plans, and you will receive:
1-Year Subscription Gets One 1oz Silver Round FREE
(Could be worth hundreds of dollars)
2-Year Subscription Gets TWO 1oz Silver Rounds FREE
(Could be worth a lot in the future)
I only have 13 more silver rounds I’m giving away
so upgrade or join now before its too late!
https://thegoldandoilguy.com/wp-content/uploads/2019/05/chart7.png387700adminhttp://www.thegoldandoilguy.com/wp-content/uploads/2014/11/tgaoglogo.pngadmin2019-05-13 10:09:532019-05-13 10:09:53US Increases Trade Tariffs Against China – Markets, Gold, and Silver