Posts

March 14, 2010
Last weeks price action unfolded just as we expected. Money poured into stocks with the focus being on small cap, banks and technology stocks. The fact that these sectors are showing strength while utilities, health care and consumer staples lag is a good sign that investors are once again taking risks in the market.

Because investors and traders are bullish on the stock market again the money flow into the safe havens like Gold and Silver decrease. I believe this is the reason stocks moved up last week while precious metals drifted lower.

Below are three charts (Dollar, Gold and Silver) showing what I think is most likely to happen in the coming week or two.

.

US Dollar Index – Daily Chart

The US Dollar has put in a very nice bounce/rally since the low in November 2009. Last month the dollar finally reached a key resistance level of 81. I have been talking about this major resistance level since January as the Dollar would find it difficult to break above this level.

Take a look at the daily chart below. You can see a head & shoulders pattern and a neckline which appears to have broken late Friday afternoon. There is a strong chance we could see 78 reached which is the measured move down. If we get follow through selling this week then I would expect 78 to be touched within 5-10 days.

.

GLD & SLV ETF Trading Charts

Precious metals have been moving very well for us recently. From looking at the charts using technical analysis we were able to catch the Feb. 5th low and also the Feb. 25th low on a several ETF’s.

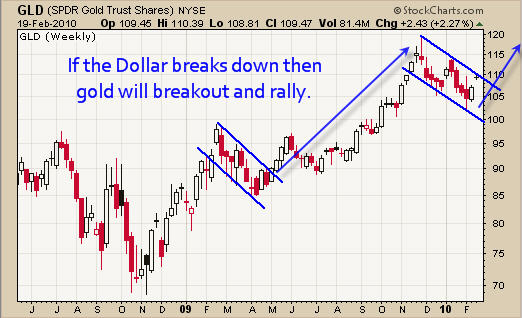
As you can see from the GLD and SLV charts, both metals are now in an uptrend showing bullish chart patterns and trading at support. If we see the US Dollar break down next week then be ready to go long gold, silver and stocks.

.

Precious Metals, Stocks and the Dollar Trading Conclusion:

As a technical analyst the above charts are pointing to higher prices in the coming day’s which is exciting for us all. BUT when things are this perfect looking we must be very cautious as the market has way to suck people into setups like this and spit them out a couple days later for a nasty loss.

Understanding how the market moves is crucial for avoiding and/or minimizing losses when trades go against us. That is why I continue to wait for my signature low risk setup before putting any money to work.

My focus is to take the least amount of trades possible each year, only focusing on the best of the best setups. My low risk setups require downside risk to be under 3% for the investment of choice when the broad market shows signs of strength, as well. I use several different types of analysis to confirm if a setup has a high probability of winning and those which do are the trades I take along with my subscribers.

It is very important to wait for the market to confirm a move higher before taking a position with this type of setup. The market could go either way quickly and jumping the gun is not a safe bet.

Get My Precious Metals and Index ETF Trading Alerts: www.TheGoldAndOilGuy.com

Chris Vermeulen

Feb 21 2010
Last week was strong with stocks and commodities moving up sharply. As nice as it was to see a rally, I still have my doubts whether this move has legs behind it. As prices moved higher throughout the week we saw volume become thinner and thinner.

Basic technical analysis of the recent price action, when looking at the hourly charts is pointing to a sharp pullback. The indexes, gold and silver have both rallied (drifted) higher on declining volume as they near resistance.

Let’s take a quick look at the US Dollar and Gold Charts
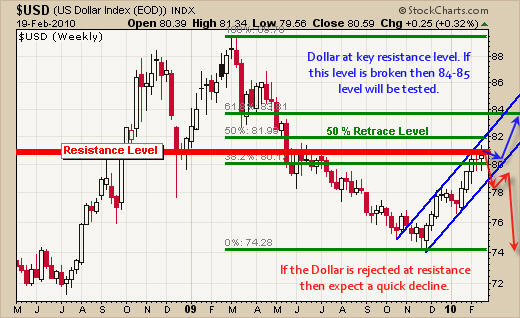
The US Dollar has been in a strong rally since the last week of December. The once easy money trade (short the Dollar) has been over for a couple of months but it may be another good trade if gold is rejected here at the 50% retracement level.

The next month or so will be interesting to see whether the dollar will continue to rally or drop like a rock as traders sell Dollars for another easy short trade. There is not much we can do here other than wait for a setup on the daily and hourly charts to form.

US Dollar – Weekly Chart


GLD – Gold Daily Chart

Gold still looks very bullish. Actually, the more gold pulls back the more I like the chart. This daily chart shows a very nice bull flag. The price is currently testing the upper trend channel line and this is what makes me think we are going to see a pop in gold prices or a sharp drop.

I would like to see gold pullback one more time and make a new multi-week low before heading higher. We did see extreme fear in the market 2 weeks ago which is when we took some long positions, but the lighter volume rally is not giving me comfort in adding more positions at this time.

Weekend Trading Conclusion:
In short, we nailed the market bottom on February 5th taking some long positions in US and Canadian ETF’s. I tightened our protective stops for these positions a couple days later making sure to protect our hard earned money. The Canadian trades have performed extremely well for us.

Now we just wait for another low risk entry point which could happen this week depending on what the market does.

If you would like to receive my free weekly gold newsletter, please visit my website:

Chris Vermeulen
www.GoldAndOilGuy.com

Last week ended on a positive note with stocks and commodities pushing higher into Friday’s close. The market overall is looking very unstable here and this week I figure there will be some big price movement.

Below are the charts on the DIA, GLD, SLV, UNG and USO funds so you can get a feel for the trend and additionally what I am looking for this week with respect to prices.

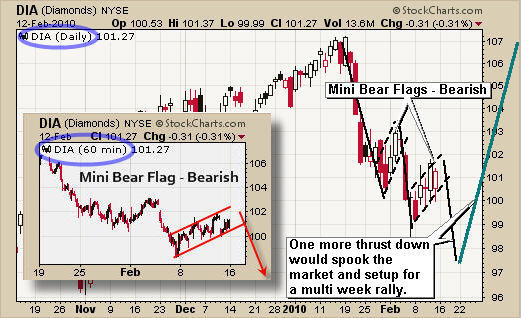
DIA – Daily & 60 Minute Chart
The Dow, along with the other indexes, has formed a bear flag and can be seen on the daily and 60 minute intraday charts below. This price pattern is a negative one and points to lower prices in the coming week.

If we get one more thrust down I figure it will spook the rest of the weak hands which in turn is a setup for a very nice multi week rally. If this flag turns into a rally then we will simply wait for a pullback and buy when there is a low risk setup.

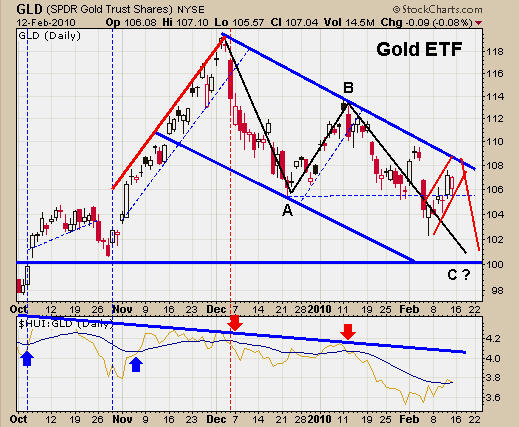
GLD – Daily Chart
Gold has been doing much the same as the over stock indexes and I feel the same will happen here. We could see price rise for another day or two as it tests our blue resistance level before heading lower.

SLV – Daily Silver Chart
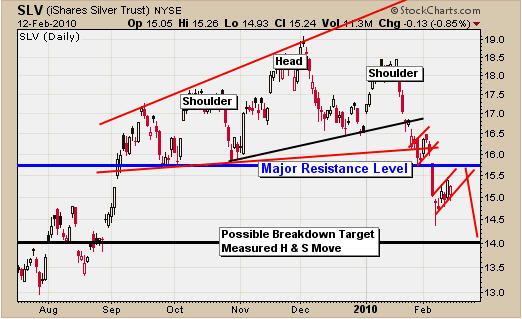
Silver has formed an interesting pattern the past few months and has now broken down. Silver’s chart continues to look weak as it drifts up to test resistance with a bear flag pattern that points to lower prices in the coming days, much the same as gold.

UNG – Daily Natural Gas Chart
Sorry for all the lines on this chart. It looks like a mess, I know, but it does show a possible trend change in UNG.

The trend has been down for over a year but now it looks as though it’s forming a reverse head & shoulders pattern and possible bull flag. These two patterns point to much higher prices in the coming months.

Natural Gas seasonally rallies in mid February into mid April. So this could be something we could catch for a multi month play. I may provide a stock to trade this rally in gas in addition to the ETF fund in the coming days or weeks, when ever this play unfolds.

USO – Daily Crude Oil Chart
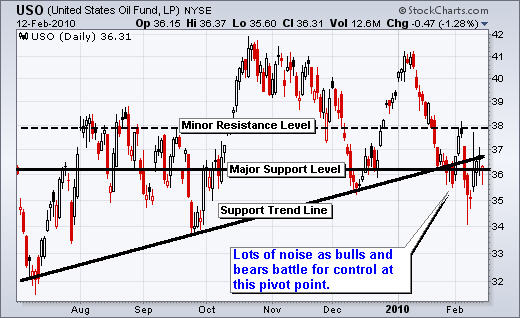
Oil has been selling down very strong for the past 6 weeks but it is now trading at a key pivot point. Oil looks as though it’s trying to bottom here and in the next 1-2 weeks I think the energy sector will provide some great trades.

Weekend Trading Conclusion:
Overall, the market and metals bottomed last week or they have another leg down which I expect would happen this week if that’s the case. The charts are pointing to lower prices still. If the market does rally then we will simply watch the breaking and buy the pullback in 1-2 weeks once there is a low risk setup.

I hope everyone had a great weekend and valentines day. My daughter Mirabelle was born this weekend on Feb 14th (Valentines Day). Everyone is healthy and happy!

You can get my weekly trading report sent via email to your inbox if you visit my website: www.TheGoldAndOilGuy.com

Chris Vermeulen

Jan 20th, 2010

For the past few weeks I have been expecting the market to correct. By looking at the price action on the weekly and daily charts we can see that there has not been any real pullback since November and that is important to note. Without regular market corrections stocks start to become over bought meaning everyone has/is buying them and no real sellers have jumped off the trend. So when the price in an over bought market starts to slide lower we generally see everyone rush to hit their sell buttons. This is what causes the high volume breakdowns similar to the GLD (Gold) breakdown last December.

Another way of getting a feel for the market to know if it is over bought is to look at market sentiment for bulls vs. bears (buyers vs. sellers). Currently almost everyone is bullish and with this high of a reading we must start protecting our positions by tightening stops and/or get ready to play the coming correction with a short term trading strategy.

We can add another level of analysis to assist our understanding of the market if we look at the 60 minute charts of the SPY & IBM.

The chart below of the SPY (SP500) clearly shows we are in choppy times. With the majority of investors buying up stocks left, right and center because they are bullish on both the economy and individual companies, we have continued to see the index crawl higher. This has been going on for almost 3 months now but the more recent price action in the SPY chart clearly shows there are some BIG sellers unloading positions into this buying pressure. When the big sellers slow their selling we see the price drift back up until selling kicks back in. This is a warning signal for lower prices in the coming days.

The IBM chart shows a perfect example of the ‘Buy on the Rumor – Sell on the News’ saying we all know. The share price of IBM ran up into their earning news as traders know IBM is great for beating estimates. Once the great news came out which actually beat the estimates, the price sold off. This is happening everywhere with stocks.

In short, the market looks top heavy and has also rallied into earning season. These two points really have me on edge for taking a long trade at the moment.
SPY Index Trend

Gold Stocks and the Dollar

The HUI (Gold Stock Index) has been on fire the past 10 months. Both gold and gold stocks have been leading the market higher. But the past month we have seen gold stocks under perform the SP500 and as of today are testing a key support level. Only time will tell if it bounces or breaks, so keep a close eye on your positions.

I use the UUP etf of the US Dollar to show the price action of today’s price move. The US Dollar is now above a key resistance level and has started to move higher. If the Dollar continues higher commodities across the board will have downward pressure. This could trigger a large sell off in the gold and gold stocks which I think are still over bought using a short term time frame.
HUI Gold Stock Trading

Gold & Oil Futures Trends

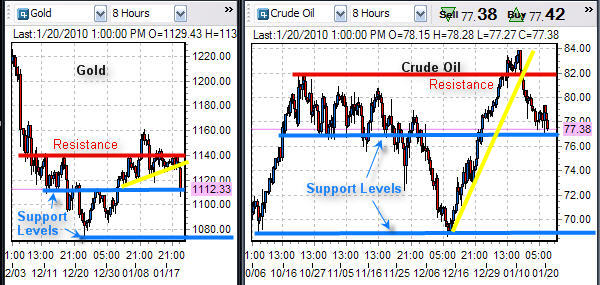
The trend of gold and oil has been down the past few days. Gold broke down in the past 24 hours in overnight trading which triggered a wave of selling when the US market opened.

Gold and oil are currently trading between key support and resistance levels. I am looking for gold to drift back up to the $1130 level where I will look for a short setup as the current price action is not bearish on the intraday charts.

Oil is still bullish so I am not really looking to short it at this time. I will wait for another low risk buy signal.
Crude Oil and Gold Futures Trading

Commodity Trading Conclusion:

I feel the broad market could be ready for a large correction ranging from 5-10%. I am calling it a correction as I want to stay positive thinking. But it could be the start of a major market top. Market tops tend to be a process and take several months to roll over. So let’s focus on protecting our money and wait for a pullback that will allow us to load up with some great positions in the coming weeks.

Patience is how money is made in the market. Waiting for the market to come to you is vital for success. Also having the patience to let winners run by scaling out (selling a portion) of a position when the price reaches a support or resistance level makes it easier to let them run. Each time you sell some of a position you are locking in a profit and lowering your risk for the balance of that trade.

If you would like to receive my Free Weekly Gold Reports please visit my website:

Chris Vermeulen
www.GoldAndOilGuy.com