Closing out the first week in June 2019, the US stock market rallied hard from recent lows and prompted many traders/investors to rethink their future plans. At the same time, Gold and Silver began a decent price rally of their own while Oil found support just above $50. It certainly has been an interesting week for traders. One that was full of incredible opportunity as many symbols rotated 6 to 12% or more over the past 10+ days.
The fact that Oil is finding support above $50 while Gold and Silver continue to rally suggests that fear may be entering the metals market while Oil may have found a temporary price bottom near $50 to $51. Weakness in the US Dollar is also helping both Oil and Metals to push higher. Our recent research suggests that the US Dollar will find support near $95 indicates the US Dollar may fall a bit further – pushing Oil and Metals a bit higher.
The strength in the US stock market near the end of the week suggests fear of any US collapse or future economic concerns appears to be abated. It is very unlikely the US major indexes would rally as they have on any extreme fear of any major US calamity or economic concerns. A slightly weakening US Dollar and moderately strong US economic data continues to suggest the US stock market may continue to be the repository of funds for foreign investors for many years to come – or until something dramatic changes in the US.
It is rather simple to understand the capital process that is at work in the global economy at the moment; until foreign market valuations and expectations appear to be opportunistic for future returns, the US Dollar and the US stock market are the most likely targets for foreign investment and safety. Weakening currencies, weakening global economies and weakening commodity prices will push capital away from foreign markets and into safety. Safety will be found in the US markets, precious metals and possibly Crypto currencies. Anything that avoids deflationary risks and credit/debt risks.
This YM Weekly chart highlighting our Fibonacci price modeling system shows how dramatic the upside price reversal was by the end of last week. The closing candles created an Engulfing Bullish candlestick pattern which is typically quite bullish. The fact that price closed above the GREEN Fibonacci trigger level is further indication that a renewed price rally may begin soon. Support near $24,000 appears to be quite strong and any further downside price risk must first break this level. As long as support holds and price continues an upside bias, there is a very strong potential for a move to above $28,000 in the works.
This NQ chart highlights a similar price pattern and suggests the NQ needs to climb above $7600 before a true rally can begin. Ultimately, the upside targets for this move are near $8500 or higher based on current price rotation. Support near $6800 is critical – so price must stay above this level for any future rally to continue.
We authored a VIX/Volatility article just a few days ago that highlighted our believe that the VIX would trade lower, within a sideways price channel till near the end of July or August 2019 – then begin another VIX Spike move upward. This coincides with the current research we are seeing where the US stock market will likely continue to push higher, very possibly setting new all-time highs again, before any real risk of any downside price collapse happens.
Follow our research and don’t miss these opportunities. We’ve been warning our followers for months that 2019 and 2020 are going to be incredible years for skilled traders. These recent 10 to 20% moves in Gold, Silver, Oil and many ETFs are just the beginning. Our research team and trading team are ready to help you find and execute for better success.
Chris Vermeulen
www.TheTechnicalTraders.com
https://thegoldandoilguy.com/wp-content/uploads/2019/06/21.png387700adminhttp://www.thegoldandoilguy.com/wp-content/uploads/2014/11/tgaoglogo.pngadmin2019-06-10 10:26:172019-06-10 10:26:17US Markets Rally Hard – Could Another Big Upside Leg Begin?
We asked our researchers a question recently, “Could Gold rally above $3750 before the end of 2019?”. We wanted to see what type of research they would bring to the table that could support a move like this of nearly 200% from current levels. We wanted to hear what they thought it would take for a move like this to happen and if they could support their conclusions with factual conjecture.
Now we ask you to review these findings and ask yourself the same question. What would it take for Gold to rally above $3750 (over 200% from current levels) and why do you believe it is possible?
Our research team came to two primary conclusions in support of a Gold price move above $3750 :
A) The US Presidential election cycle/political environment could prompt a vicious global economic contraction cycle of fear and protectionist consumer and corporate activity that propels the global economy into a deflationary (mini-crisis) event.
B) The global trade wars could complicated item A (the US Presidential election cycle) and create an accelerating component to this global political event. The result is the mini-crisis could turn into “
a bit more” than a mini-crisis if the global trade wars prompt further economic contraction and disrupt global economic activities further.
Our research team suggested the following as key elements to watch out for in terms of “setting up the perfect storm” in the global markets.
A) The US Dollar falls below $94 and continues to push a bit lower. This would show signs that the US Dollar is losing strength around the world
B) The Transportation Index falls below $4350 and begins a bigger breakdown in price trend – targeting the $3000 level. This would indicate that global trade and transportation is collapsing back to 2007-08 levels.
C) Oil collapses below $45 would be a certain sign that global Oil demand has completely collapsed and the sub-$40 level would very quickly come into perspective as a target.
D) Global Financial stability is threatened by Debt/Credit issues while any of the above are taking place. Should any of the A, B or C items begin to take form over the next few weeks or months while some type of extended debt or credit crisis event is unfolding, it would add a tremendous increase of fear into the metals markets.
Our researchers believe the US Dollar is safe above the $91 level throughout the end of 2019 and that any downside risk to the US Dollar would come in brief price rotations as deflationary aspects of the global economy are identified. In other words, at this time, we don’t believe the US Dollar will come under any severe downside pricing pressures throughout the end of 2019. We do believe a downside price move in the US Dollar may be setting up between now and early July 2019, but we strongly believe the $91 to $93 level is strong support for the long term.
The Gold Spot price / the US Dollar price chart highlights the incredible upside price move in Gold after 2001-02. It was almost a perfect storm of events that took place after this time to prompt a move like this to the upside. Not only did we have multiple US based economic crisis events, we also had a series of global economic “shifts” taking place where capital and assets were migrating all across the globe searching for superior returns. Could this happen again?? Of course it could. Although, we believe the next move in precious metals will be met with a completely different set of circumstances – very likely targeting foreign nations and not the US economy.
This SPDR GLD chart shows a moderately safer play for investors and traders. The potential for a 20%+ upside price move over the next 60+ days is quite likely and our belief is that traders should be able to trade GLD throughout many of the upside and downside price rotations over the next few weeks and months. Ultimately, if you are skilled enough to pick proper entries, a decent trader could focus on GLD and pick up 65% to 120% ROI over a 7 to 12 month span of time.
–Our Last Gold Forecast From October 2018 Unfolding Perfectly –
Pay attention to where the opportunities are for your level of skill and capital. As we’ve been saying for many months, 2019 and 2020 will be fantastic years for active traders. Stick with what you can execute and trade well because there will be dozens of trades available to most traders over the next 16+ months.
Overall, our research team believes that precious metals have just begun to move higher on a WAVE C impulse move. We authored a research post suggesting that Gold and Silver were currently 20 to 30% undervalued back in late May 2019. The current upside move in Gold and Silver may be just the beginning of a much bigger move.
Ideally, we believe this initial impulse move will end above $1650. From these current levels, that reflects a 25% to 30% upside move in GLD. If any of the fear-inducing items, listed above, begin to take shape over the next 12+ months, we could certainly see Gold above $2100 before too long. $3750 may seem like “shooting for the stars”, but all it takes is a combination of fear and deflation/inflation to drive investors into a gold-hoarding mode just like we saw after 2003-2004 – and that move prompted a 500% price rally from the $300 base level. That same move today would put the current price of Gold near $7800. It might seem like it could never happen – but it could.
Bottom line, we forecast the markets and share some extreme analysis like this to open your eyes to some potential opportunities. But, you cannot just jump into gold or miners after reading this and think you are set for success. The markets are never that simple. You must actively adjust and trade with the market and our daily video analysis is what will keep you on the right side of the market more times than not. This week, we locked in some profits on our long gold ETF, and gold miners ETF, why? because our analysis says both of these are at resistance and could pullback before heading higher. We don’t buy, hope and hold, we enter positions, lock-in profits, rinse, and repeat over and over again.
Get my daily video analysis and trade alerts today by subscribing to the Wealth Building Newsletter.
Chris Vermeulen
www.TheTechnicalTraders.com
https://thegoldandoilguy.com/wp-content/uploads/2019/06/17.png398700adminhttp://www.thegoldandoilguy.com/wp-content/uploads/2014/11/tgaoglogo.pngadmin2019-06-07 16:43:402019-06-07 16:43:40Could Gold Rally Above $3750 Before December 2019?
The continued upside price move in Gold is a very clear sign that fear is starting to enter the global markets again. We read an article last night that suggested many professional fund managers are preparing for a bigger downside price move as well as expecting the US Fed to potentially decreased interest rates over the next 12 to 24 months as the expected downside price move takes place. We understand this concern by many industry professionals and share some of their same concerns, yet we believe these individual are far too early in shifting their stance in the markets right now.
As you may be aware, our research does not show any major downside risks until later in July 2019 or August 2019. Even then, the price of the Dow Jones Index would have to fall over 18% before the December 2018 lows become threatened. The current upside price recovery, with the Dow Jones up over 400 pts from the lows on Monday, June 3, suggests the US market and the Capital Shift that has been taking place over the past 24+ months is still rather strong with investor buying dips. We told our followers this bounce was about to happen the day before it bottomed here.
It seems that everyone is trying to pick a top or call the big crash right now. Back in November 2018, it seemed like every professional trader we knew was advising their client “This is the BIG ONE” and suggesting the US markets could never recover from a deep sell-off like the one we experienced in late 2018. Yet, here we are, after reaching near all-time highs again, rotating a bit lower and the same voices seem to be stating “This is the BIG ONE” again.
Allow us to help clear up what is likely to happen based on our research and proprietary modeling tools.
This first chart of the VIX (Volatility Index) shows what we believe to be the most likely outcome over the next 30+ days. After a spike in the VIX in early may which our followers profited over 25% in a few days, we believe a downward pricing channel will set up where the VIX will continue to drift lower – eventually settling back below 14 again for another setup. It is very likely that this volatility consolidation coincides with a US stock market price recovery over the same span of time. We’ll get into more detail in the following charts.
Eventually, sometime in mid-July or mid-August, we expect the VIX to spike well above 20 to 22 as a broader US stock market price collapse takes place.
Throughout our expectations, we expect the US Dollar to enter a similar type of price pattern – setting up a Pennant formation after a moderately deep price correction nearing the $95 level. We believe the US Dollar will continue to move lower, driving precious metals higher, where the $95 support level is the key target. Once this level is reached, we believe the US Dollar will rotate higher and attempt a move above $97.50 again – possibly attempting new price highs. These new highs are likely to happen in early to mid July 2019.
Our last chart highlights what we believe will happen in the Dow Jones Index (as a general market example of what will likely happen in the ES, NQ and YM). As you can see, we believe the downside price swing that has currently taken price nearly -7.25% lower should be very close to completion. We believe the $24,300 to $24,600 level will act as strong support for this move and prompt another upside price leg over the next 7 to 14 days. We believe this upside price leg will push the DJI price level back towards the $26,000 level by late July or early August 2019.
We are suggesting that the early move into a protectionist stance by professional traders may be about to experience some extreme pressures. Should the US/China trade issue or the Mexico trade issue lessen or be resolved over the next 60+ days, the US stock markets could rally towards new highs fairly quickly. If things stay the same as they are now, we expect price to move exactly as we have highlighted on these charts.
Near the end of July or sometime in August 2019, we expect a bigger top formation to setup where a moderate price collapse may take place. Everything must setup perfectly for this to happen and we still have 40 to 60+ days of trading before this setup gets closer. Lots of things can happen over this span of time, so pay attention to our continued research to stay ahead of these moves.
One thing you can do to prepare for any future price volatility or rotation is to accumulate Gold and Silver positions near recent lows. If you like precious metals see my forecasting signals here This increase in volatility means that precious metals should continue to push higher as fear becomes more rooted across the globe.
We’ve now shown you two different price setups using Fibonacci price theory and the only thing we have to do is wait for a technical price confirmation before finding our entry trade. We’ll see how this plays out over the next few days and weeks. Remember, we are not proposing these as “major price bottoms”. They are “upside pullback trades” (bounces) at this point. A bullish price pullback in a downtrend.
With global equities taking the plunge, bond market turmoil, talk of negative interest rates and a bullish COT Silver Report, the future for Gold and precious metals just keeps getting brighter.
Add to that the threat of Mexican tariffs and the push for a Gold-backed currency in Malaysia and you have the makings of an exciting Weekly Wrap Up.
Eric cheers on the Raptors, chimes in on Gold and answers some of your questions this week on the Sprott Money Weekly Wrap Up.
https://thegoldandoilguy.com/wp-content/uploads/2019/06/EricWeekly.jpg300710adminhttp://www.thegoldandoilguy.com/wp-content/uploads/2014/11/tgaoglogo.pngadmin2019-06-04 14:29:102019-06-04 14:29:10When you contemplate negative interest rates, I would rather own Gold…
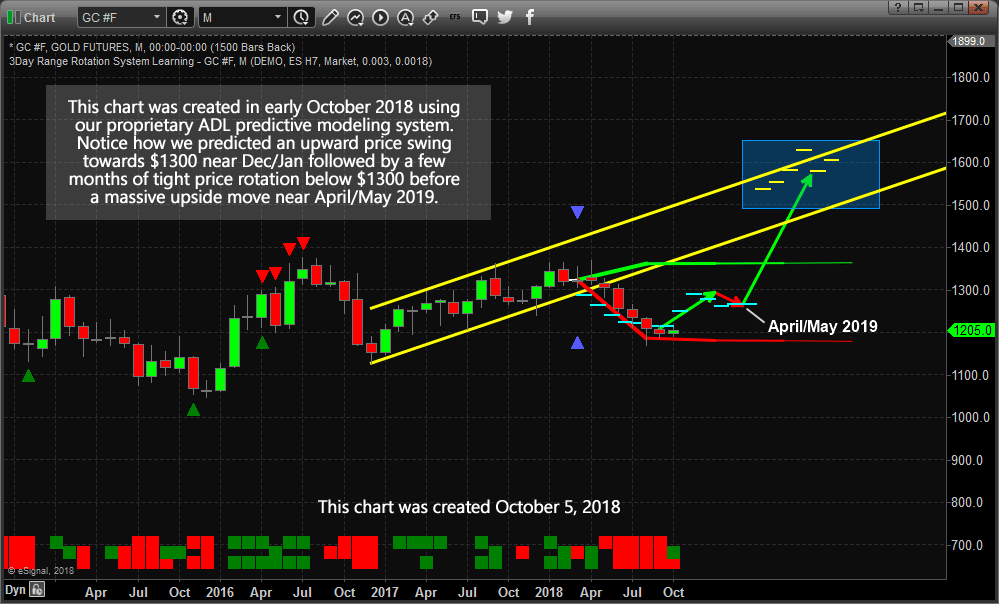
Our research team believes Silver could be the Sleeper Rally setup of a lifetime for investors if the global economic cards continue to get scattered and crumpled over the next 10+ years. The recent rally in Gold got a lot of attention last Friday (the end of May 2019). We had been warning about this move for the past 8+ months and generated an incredible research post in early October 2018 that clearly highlighted our belief that Gold would peak above $1300 early in 2019, then stall and move toward $1270 near April/May 2019, then begin an incredible upside price rally in June/July/Aug 2019. We couldn’t have been more clear about this prediction and we posted it publically in October 2018. See This Previous Gold Forecast Snapshot
Now, our research team is going to share with you some incredible insights into what may become the most incredible trade setup we’ve seen in the past 12+ years – the Sleeper Silver Setup.
Going all the way back to the early 1970s, when the Hunt Brothers ran most of the metals markets, we can see the incredible price rally in Silver from $1.28 per ounce to nearly $41.50 in late 1979. This move setup with a very simple pattern – a high price breakout in 1973 that broke a sideways price channel and initiated a nearly 6+ year rally resulting in an incredible 3142% price increase from the lows.
Could it happen again?
Well, after this incredible price peak, the price of Silver languished and moved lower, eventually bottoming in 1991 near $3.50. After that bottom setup, the price of Silver setup another sideways price channel and traded within this range until a 2004 High Price Breakout happened AGAIN. It seemed inconsequential at the time – a rogue high price near $8.50. Maybe that was it and maybe price would just rotate lower back to near the $4.00 range??
This High Price Breakout setup an incredible price rally that resulted in a continue price advance over the same 6+ year span of time. This rally was not as big as the 1974 to 1979 price rally in percentage terms, but it was much bigger in terms of price valuation. The 1979 price peak ended at $41.50 and resulted in a $40.25 price increase whereas the 2011 price peak resulted in a $46.32 price increase.
Will it happen again in our lifetime?
As incredible as it might seem, we believe Silver is setting up another High Price Breakout pattern that should conclude within the next 2 to 4 months with a price high near $22.50 to $24.00 (see our proprietary Fibonacci price modeling projections below). After this peak is reached, hold on to your hat because we believe the upside price rally could mimic past rallies and attempt to immediately move the price of Silver to well above $85 per ounce. Ultimately, we can only guess as to where the top of this move may end – but we can safely estimate it will likely top somewhere between $90 and $550. This, of course, will require some type of major bear market is other asset classes and possibly some global crisis but we believe it is very possible in due time. Our predictive modeling systems will help us determine where the actual price peak will be as this unfolds over time.
And there you have it – one of the most incredible trade setups you’ll ever see in your lifetime. Yes, it may happen twice in your life or more, but we believe this setup in Silver is just weeks or months from initiating the next upside price leg (the High Price Breakout) and we are alerting you now to be prepared.
UNIQUE PHYSICAL SILVER OPPORTUNITY:
We should start to see money flow into the safe-haven assets like the Utility sector, bonds, and most importantly precious metals. I anticipated this and our XLU utilities ETF taken with members was a quick 3.11% winner. Our VIX ETF trade also hit our 25% profit target within a few days of entry.
Now, I have a few silver rounds here at my desk I am going to give away and ship out to anyone who buys a 1-year, or 2-year subscription to my Wealth Trading Newsletter. You can upgrade to this longer-term subscription or if you are new, join one of these two plans listed below, and you will receive:
1-Year Subscription Gets One 1oz Silver Round FREE
(Could be worth hundreds of dollars)
2-Year Subscription Gets TWO 1oz Silver Rounds FREE
(Could be worth a lot in the future)
I only have few silver rounds I’m giving away
so upgrade or join now before its too late!
SUBSCRIBE TO MY TRADE ALERTS AND GET YOUR FREE SILVER ROUNDS!
Chris Vermeulen
https://thegoldandoilguy.com/wp-content/uploads/2019/06/4.png368700adminhttp://www.thegoldandoilguy.com/wp-content/uploads/2014/11/tgaoglogo.pngadmin2019-06-03 13:44:352019-06-03 13:44:35Is Silver The Sleeper Rally Setup Of A Lifetime?
We’ve been trying to alert all of our followers of the setup in precious metals for well over 6 months. Here is our research post from February 6, 2019 (nearly 4 months ago) that highlights our prediction of an April 21~24 momentum base and our earlier calls predicting a move above $1300, then a stall and move lower towards the base in April, then the next leg higher.
I have been pouring over the longer term charts as we’ve started to see Oil and Gold move in directions that would indicate increased fear throughout the global markets while a contraction in economic activity/oil prices appears to be setting up for another big move. The objective is to attempt to identify longer-term volatility expectations and price targets. To accomplish this task, we use our Adaptive Fibonacci predictive modeling utility on 3 Week charts because they provide a unique look at price activity and are a bit more reactive to shorter-term price activity than Monthly price bars.
We found some very interesting components by reviewing these charts of the ES, NQ, YM, and CL. We believe we are setting up a 2~4+ week sideways price rotation in the US stock market as price attempts to consolidate within this range before a broader breakout/breakdown move could happen. Just as we predicted many months ago, the July 2019 price peak we suggested could form appears to be setting up with a sideways pennant/flag formation as investors digest the economic and global trade war news data.
Eventually, the price will make a move in an attempt to break this sideways price channel and our predictive modeling solutions can help us to understand how these price setups will playing out. Let’s get into the charts and research.
As we start to pull apart the data from these charts, we urge you to pay attention to two things – the range of the current Bullish & Bearish Fibonacci Price Trigger levels and current price rotations of price peaks and troughs over the past 40 to 60 bars. It is very important to understand and attempt to use the “new price high” and “new price low” Fibonacci price theory that we keep talking about in our articles.
This first chart is the ES 3-Week chart highlighting the range between the Fibonacci Bullish and Bearish Price Trigger Levels (highlighted in light-CYAN). It is important to understand why the current bearish price trigger level is so far below current price levels. The Adaptive Fibonacci modeling system adjusts trigger levels based on recent price activity and price volatility to attempt to identify when the price is congesting in a sideways price trend or trending upward or downward. When price congests in a sideways form, the Adaptive Fibonacci modeling tool identifies this and determines that price would need to move to new levels in order to qualify for a new bullish or bearish price trigger. In this case, it is suggesting that price would need to fall below $2014 before this 3-Week chart would qualify the move as a “new bearish trend”.
That is a big move from current levels. It totals more than -750 points – a -27.5% price decline.
Currently, as long as the ES price stays above the $2633 level, the Fibonacci predictive modeling system is still suggesting the Bullish trend is intact and should continue.
This NQ 3-Week chart is setup in a similar manner to the ES chart. Although the Fibonacci volatility range on the NQ chart is much more narrow than the ES chart, the Fibonacci modeling system is still suggesting that the current trend is still Bullish and the key levels for the triggers are $6792 for the Bearish Trigger level and $6556 for the Bullish Trigger level.
Because of the narrow volatility range and because the Bearish trigger level is above the Bullish trigger level, we believe a price rotation where the price stays above $6800 is very likely over the next few weeks. Obviously, should price break below the Bearish Trigger level, then we would begin to become concerned that a broader downside trend is being established and start to look at the Fibonacci downside price targets (near $5815 & $3900). Until that happens, expect sideways price rotation with a 250 to 500 point range on average (about 2x the Fibonacci volatility range).
The YM is really the key to understanding just how the markets are going to play out over the next few weeks and months. The extremely large Fibonacci volatility range on the YM chart highlights the potential for the wild sideways price rotation that we are expecting over the next few weeks and months. Remember, our analysis from many months ago suggests a price peak will likely form in July/August 2019 and prompt a broader downside price move after this peak completes. Our expectation that a current sideways price channel is setting up leads us to believe the apex of this sideways price channel may result in a very brief price rally (pushing prices back towards recent highs) before rolling over and starting a new downside price move to coincide with our July/Aug 2019 predictions.
One way or another, it appears the DOW/YM will be leading the way in terms of price volatility and rotation. The wide range between the Bullish and Bearish Fibonacci Price Trigger Levels is suggesting that price volatility is increasing and that the YM would have to move to levels above $29,750 or to levels below $18,875 before establishing any new price trends. The past Fibonacci trigger levels help us to understand key price levels as this future move takes place.
Past Fibonacci Trigger Price levels are $26,025 for a Bearish Price Trigger level and $24,770 for a Bullish Price Trigger Level. This means if the price is below $26,025 – we should expect a bearish price trend to continue and if the price is above $24,770 – we should expect a bullish price trend to continue. Yet, price is current BETWEEN both of these levels, so what should we expect right now? When the price is in between these levels, like now, we typically look for the last price rotation (peak or valley) and for the last level that was crossed (in this case the $26,025 Bearish level) and would conclude:
The trend is currently Bearish and the $26,025 level is key to maintaining this bearish price direction. Should price move back above this level and close above this Bearish Price Trigger Level, then we would consider the trend “moderately bullish” while we wait for a new Price Trigger Level Breach to setup.
Lastly, Crude Oil. We’ve been writing to all of our followers that we felt Oil was setting up for a price rotation many weeks ago. We warned that the $65 price level may be the end of the move and that the $55 to $50 levels are the likely downside targets. The volatility range is somewhat narrow and the last Trigger Level that was breached was the Bearish Trigger Level near $68.75. Therefore, we believe the recent downside price move, below the $60 Bullish Trigger level, results in a new Bearish price trend with immediate targets near or below $50. Ultimately, the $42.40 level may be the longer term downside price target – which would coincide with a broader commodities slowdown and global economic activity contraction.
So here is what you need to know to go into this weekend and for the next 4+ weeks.
Expect the US stock market to trade in a moderately volatile sideways price channel for the next 4+ weeks.
Expect the end of this price channel to result in a “false rally” move that may push prices towards recent highs before faltering and rotating back to the downside.
Expect this END of the sideways price channel to happen sometime near mid-July or early August 2019.
Expect Gold and Oil to continue to react as “fear measures” over the next few weeks/months as global traders reposition their assets throughout this rotation.
Expect a bigger price move near late July through September~October 2019 as this volatility move really begins to take root with equities.
Follow our research and learn how we can help you stay well ahead of these price moves. We’ve just highlighted what is likely to happen over the next 30 to 60 days in this research post. Want to know how we are going to trade these moves? Join our other members to see how we create success and keep our members ahead of these big moves. Also, if you wanted me to ship you free silver rounds with a subscription to this Wealth Trading Newsletter you better join today as this offer expires June 1st.
https://thegoldandoilguy.com/wp-content/uploads/2019/05/33.png368700adminhttp://www.thegoldandoilguy.com/wp-content/uploads/2014/11/tgaoglogo.pngadmin2019-05-31 23:47:412019-05-31 23:47:41Adaptive Price Modeling Suggests Big Rotation In US Dow Stocks
UNIQUE OPPORTUNITY: First, we typically see stocks sell-off and as the old saying goes, “Sell in May and Go Away!” which is what has been happening.
So what does this mean? It means we should start to see money flow into the safe-haven assets like the Utility sector, bonds, and most importantly precious metals. I anticipated this and our XLU utilities ETF taken with members has already hit our first profit target, and our VIX ETF trade also hit out 15% profit target and we the balance of it is still up 25% as of yesterday.
Second, my birthday was this month, and I think its time I open the doors for a once a year opportunity for everyone to get a gift that could have some considerable value in the future.
For May I am going to give away and ship out silver rounds to anyone who buys a 1-year, or 2-year subscription to my Wealth Trading Newsletter. You can upgrade to this longer-term subscription or if you are new, join one of these two plans listed below, and you will receive:
1-Year Subscription Gets One 1oz Silver Round FREE
(Could be worth hundreds of dollars)
2-Year Subscription Gets TWO 1oz Silver Rounds FREE
(Could be worth a lot in the future)
I only have few silver rounds I’m giving away
so upgrade or join now before its too late!
Here we go again.. We’ve been nailing the Precious Metals moves for many months and we’ve heard from many of our followers and members about our research. Some of you might remember our November 24, 2018 prediction that Gold would rally above $1300, then stall and set up a “Momentum Base pattern near April 21~24, 2019“. We find it incredible that we can make a prediction about Gold nearly 6+ months ahead of the move using our proprietary predictive modeling tools and then sit back and wait for it to happen just as we predicted.
On March 28, 2019, we posted this research article regarding the “Final Buying Opportunity for Gold”. Our researchers believe this current double-bottom setup is the last time you’ll see Gold prices below $1300 for quite some time in the future. Again, we were warning our followers that the opportunity to position their gold trades was setting up and this low price setup may be the last time we see Gold near these lows.
Our current research suggests the bottoming is over and the new price leg should begin to prompt a Gold price rally over the next 5~7+ weeks targeting a level well above $1375 initially.
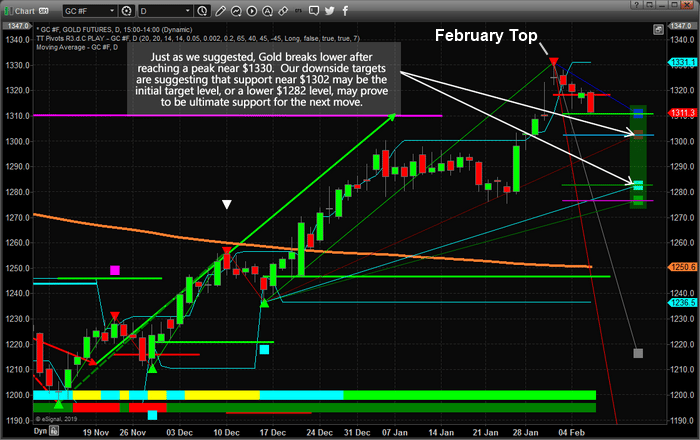
This Daily Gold chart highlights the price rotation and the Double-Bottom that has currently set up in Gold. Our proprietary Fibonacci price modeling system is suggesting an upside price leg targeting at least $1330 (on this Daily chart) will become the initial upside price leg. Remember, the Daily Fibonacci modeling system is predicting price moves over 10~30+ days.
This Weekly Gold chart is highlighting the same Fibonacci predictive price modeling system on long term data – weekly data. You can see how we’ve highlighted the price rotation peaks and valleys as well as how the Fibonacci modeling system is predicting a broader upside price move with a target near $1425 or higher.
If you pay attention to the MAGENTA price rotations we’ve highlighted throughout the initial upside price move, you’ll see there are a total of FIVE (5) rotations within that first price leg. A perfect 5 wave rotation upward. Then, the following downside price move consisted of a THREE (3) wave downside price move – resulting in a DOUBLE-BOTTOM price formation. Should this next wave, wave C, rally in equal form to Wave A, the upside price target for the move would be $1450. We believe this next price advance will be bigger than Wave A and likely result in a price target range well above $1650.
As we’ve been saying for many months, get ready and here we go. Once the protectionist moves into Cryptos have waned and traders realize the magnitude of this potential precious metals rally (as well as the fact that Cryptos will not provide the same level of protection as precious metals), the hunt for the shiny metals will be on. It would be very wise to stay well ahead of this move and prepare for this upside leg now.
We have been trying to tell you about this move for over 6+ months. We hope you’ve been paying attention and understand that even with a 4% to 8% price risk (or more) in your accumulation of Gold/Miners and precious metals positions, this trade is for the longer-term objective – not the short-term 8 to 12%. This next upside price move could target the $2100 to $2400 level if it extends into a complex advancement wave. That would mean Wave C could end well above $2100 and that Wave E could target the $5000 level or much higher.
We’ll keep you informed of this move, but you better start planning for this upside move before you miss this bottom. And just because we like to hear it – remember, we called this move back in November 2018 – over 6 months ago.
UNIQUE OPPORTUNITY: First, we typically see stocks sell-off and as the old saying goes, “Sell in May and Go Away!” which is what has been happening.
So what does this mean? It means we should start to see money flow into the safe-haven assets like the Utility sector, bonds, and most importantly precious metals. I anticipated this and our XLU utilities ETF taken with members has already hit our first profit target, and our VIX ETF trade also hit out 15% profit target and we the balance of it is still up 25% as of yesterday.
Second, my birthday was this month, and I think its time I open the doors for a once a year opportunity for everyone to get a gift that could have some considerable value in the future.
For May I am going to give away and ship out silver rounds to anyone who buys a 1-year, or 2-year subscription to my Wealth Trading Newsletter. You can upgrade to this longer-term subscription or if you are new, join one of these two plans listed below, and you will receive:
1-Year Subscription Gets One 1oz Silver Round FREE
(Could be worth hundreds of dollars)
2-Year Subscription Gets TWO 1oz Silver Rounds FREE
(Could be worth a lot in the future)
I only have few silver rounds I’m giving away
so upgrade or join now before its too late!
https://thegoldandoilguy.com/wp-content/uploads/2019/05/29.png368700adminhttp://www.thegoldandoilguy.com/wp-content/uploads/2014/11/tgaoglogo.pngadmin2019-05-29 21:04:452019-05-29 21:04:45Extended Gold Mega Base Could Prompt An Incredible Rally
The US Memorial Day weekend is set up to become a very interesting time for investors. The EU voting is complete and the change in EU leadership may move the markets a bit. China appears to be playing a waiting game – attempting to hold the US/Trump at bay until after the 2020 US elections. This week is certain to be very interesting for traders/investors.
The European stocks moved higher in trading on Monday as the relief from the EU election event and support for auto shares pushed the markets higher. The transition in the EU over the next few months will solidify into a political and social agenda. The EU leadership must acknowledge these future objectives of all parties in order to maintain some level of calm. It is evident that many EU nations are relatively satisfied with the current leadership while others are transitioning into more centrist leadership. The next 4+ years will be full of further transition in the EU.
China is another global issue that is relatively unsettled. We’ve been doing some research with regards to China and the potential future political and economic pathways that may become evident in the near-term future. Our biggest concern is that China has been inflating their economic levels for decades and the true scope of the Chinese economy may be much weaker than everyone expects. If our suspicions are correct and China has been inflating economic levels for many years, then the transition to a consumer/services-driven economy may be dramatically over-inflated and the US/China trade issues could be biting much harder than the Chinese want to admit.
The “Sell in May and go away” market saying may become absolute truth in 2019. Our expectations are still suggesting that an attempt at new market highs may take place before August 2019, but the current market rotation (lower) is setting up a very strong potential for further downside price action at the moment. Our proprietary Fibonacci price modeling system is suggesting the $7294 level in the NQ is key support. Below this level, the NQ could break much lower and potentially target $6850 or lower.
The YM is setting up a similar price pattern with resistance near 25,840. We believe this resistance will push prices lower as we move further into early June. The potential for some type of surprise economic data or Fed/Global market move after this weekend is somewhat higher than expected. There is a lot of shifting taking place throughout the globe and we believe this turbulence will reflect in the US market soon enough.
As of right now, our expectations are that a brief upside price rally will take place over the next 4~7+ days before a continued downside price trend may become evident. Pay attention to the news cycles for key elements that could drive the US stock market lower. We will continue to update you with regards to our proprietary research and expectations. The next 7+ days will likely be nothing but sideways price rotation within a Pennant/Flag formation.
Read our research to understand how this setup coincides with the GOLD price setup and why it is important to understand why July 2019 is so important. Please take a minute to review these recent research posts that focus more on the US Dollar and Gold, and also the July turning point for US Stocks.
4 DAYS LEFT TO GET YOUR FREE SILVER ROUNDS WITH SUBSCRIPTION!
We continue to see money flow into the safe-haven assets like the Utility sector, bonds, and most importantly precious metals. I anticipated this and our XLU utilities ETF taken with members for 4.4% already, and our VIX ETF trade we closed for a 25% last week.
For May I am going to give away and ship out silver rounds to anyone who buys a 1-year, or 2-year subscription to my Wealth Trading Newsletter. You can upgrade to this longer-term subscription or if you are new, join one of these two plans listed below, and you will receive:
https://thegoldandoilguy.com/wp-content/uploads/2019/05/27.png368700adminhttp://www.thegoldandoilguy.com/wp-content/uploads/2014/11/tgaoglogo.pngadmin2019-05-27 14:58:242019-05-27 14:58:24US Memorial Day Weekend Market Analysis