There should be an inverse relationship between gold (NYSEARCA: GLD) and copper (NYSEARCA: JJC).
Most of gold is used for investment purposes. As a result, it rises when there is economic weakness and investors lose confidence in the fiat currency of a country. Most of copper is used for industrial purposes. Therefore, the price of The Red Metal should increase when economies are booming, as there is a greater demand for it from the factories operating at full throttle and for the buildings being constructed.
Gold Bullion Prices
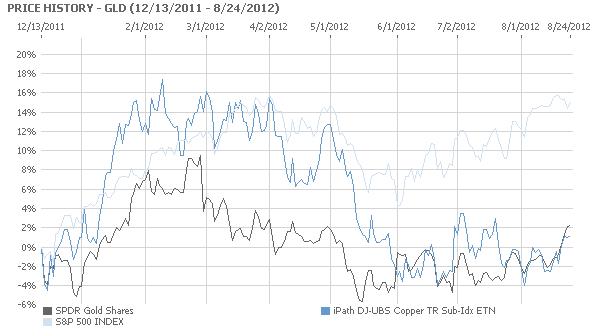
As the chart below evinces, the inverse relationship between the exchange traded for gold, SPDR Gold Shares, and the exchange traded fund for copper, iPath Copper, has broken down due to traders positioning themselves for the introduction of Quantitative Easing 3 when Federal Reserve Chairman Ben Bernanke speaks at Jackson Hole this Friday.
Continuing economic weakness in the United States will almost certainly lead the Federal Reserve to act in way that is more powerful than Operation Twist, the selling of short term securities to buy those with a longer term. Based on the most recent data, economic growth in the United States is falling as the unemployment rate is rising. A recent statement by the Federal Reserve was unusually clear in calling for greater action.
Both the JJC and the GLD have risen together as traders expect more economic stimulus from the United States Government. This will weaken the US Dollar and raise the price of commodities, as happened with Quantitative Easing 2. During the period of Quantitative Easing 2, from November 2010 to June 11, the US Dollar fell in value and the GLD and the JJC soared, along with other commodity prices, particularly oil. This pattern is being repeated as traders are preparing for the initiation of Quantitative Easing 3 when Bernanke speaks Friday, or at the next Federal Open Market Committee meeting.
Gold Spot Price Chart
TheTechnicalTraders Analysis & Trade Idea Delivered To Your INBOX!
http://www.thegoldandoilguy.com/wp-content/uploads/2014/11/tgaoglogo.png00adminhttp://www.thegoldandoilguy.com/wp-content/uploads/2014/11/tgaoglogo.pngadmin2012-08-27 08:23:092014-03-06 07:44:53Gold and Copper Rising Due to QE3 Hopes
GLD Gold ETF – Taking advantage of the gold market using the GLD exchange traded fund to generate consistent profits in any market condition.
As I mentioned before, the past 5 months have been very frustrating for most traders as we are stuck in this sideways price action. I also noted that August to December is generally the stronger months for gold. Although gold has been under selling pressure during the last 4 weeks I think there is light at the end of the tunnel. It’s usually the darkest before dawn, but there are some hurtles for gold to over come before we are in the clear which I explain below.
Chart 1 – The Gold Mining Stocks Index
This is a 10 year chart with a cup and handle pattern complete with a breakout. As you can see in the chart below gold mining stocks have continued to collapse below their support level. This does not mean gold is going to follow but it is a red flag which needs to be noted for future long entry points. Gold mining stocks in general are seen as volatile and high risk types of investments so I understand why investors are unloading their positions to lock in profits.
Gold Mining Stocks Index
Gold mining stocks are pushed below long term support level.
Chart 2 – Gold Stocks Index
This is an 8yr chart of the price action of gold stocks and you can see that they are currently testing long term support levels. If this monthly bar closes below this trend line then long term investors should be sitting in cash until we have a new opportunity to enter long or short. The HUI generally makes the move before the price of gold so I follow the HUI in all time frames.
Gold Stocks Index
The HUI is testing long term support.
Chart 3 – Performance Chart (Gold Stocks vs Price of Gold)
The past 2 years from 2006 to present gold stocks have slowly been underperforming the price of gold. This is generally not a good thing to see if we want higher prices for gold. But the good news is that gold stocks appear to be reaching levels at which new rallies have started.
Gold Stocks vs Gold Spot Price
Gold stocks under performing the price of gold but near support.
Chart 4 – Daily HUI Chart
I follow the HUI like a hawk as it fine tunes my entry and exit point for trading GLD, DGP and DZZ funds. Last month the HUI made a lower high and a lower low which is a red flag. While I don’t predict prices I am thinking these lower prices for gold stocks are just panic sellers over extending a sell off. I would really like to see an August rally kick into place.
HUI Gold Stocks Index
The HUI makes a lower high and lower low on the daily chart.
Chart 5 – GLD Gold ETF Chart
While gold stocks have been selling down, gold has so far been able to hold some ground. As you can see in the chart below the last three months gold has made higher highs, and higher lows. Currently gold is testing Major Support at the 200 EMA.
GLD Gold ETF Trading
Gold ETF GLD at long term support still holding its ground.
Conclusion:
My analysis of gold using the charts provided above shows that gold stocks and indexes are oversold and are at major support levels. Thus an August rally is not out of the picture and we could have some favorable setups in the near future. I would prefer higher prices, but in the end movement is movement and we can profit in either direction evenly.
GLD gold etf trading for me is the most accurate trading vehicle I have come across. I have been using my proven trading model which avoids the price gaps and keeps risk under 3% for each trade. GLD makes it simple to profit from the markets using a proven trading model for trading long and short term gold setups in all market conditions (bull, bear, and sideways).
My focus for short term trading is simple. Wait for a breakout which satisfies my trading model, enter the trade and then exit 50% of position on the first sign of weakness. Exit second half on a trend line break. My goal for GLD ETF is 2-5% and we are in trades for 2-10 days unless prices continue to run. I generally have 10-20 trades per year with gold.
Chris Vermeulen is Founder of the popular trading site TheGoldAndOilGuy.com. There he shares his highly successful, low-risk trading method. For 6 years Chris has been a leader in teaching others to skillfully trade in gold, oil, and silver in both bull and bear markets. Subscribers to his service depend on Chris’ uniquely consistent investment opportunities that carry exceptionally low risk and high return.