Despite the decline this past week, gold seems to be regaining favor with global investors, as just a week earlier it had been flirting with the $1,800 an ounce mark. Quite a change from the sentiment in early summer when some investors were questioning whether the yellow metal’s decade-long bull run was coming to a close.
The rebound in investor sentiment toward gold, of course, coincided with the launching of open-ended QE3 (or QE infinity) by the Federal Reserve. Since then gold has “barely paused for breath. It has, as discussed previously, touched all-time highs in terms of euros or Swiss francs.
QE3 certainly seemed to worry some investors. These people moving into gold are concerned about things such as competitive devaluations and the debasement of currencies in an attempt to pay back enormous debt loads with a cheaper currency. This road – currency debasement – eventually leads to inflation most believe.
So it is really is not surprising that, according to UBS, investors in exchange traded funds raised their holdings by 158 tons since the beginning of August to a record 2,681 tons of bullion recently.
Many of the world’s best investors are in agreement with the average person putting his or her money into gold. The list of names is impressive: George Soros, John Paulson, Ray Dalio and Bill Gross.
Ray Dalio, founder and chief investment officer of Bridgewater Associates – the world’s largest macro hedge fund, told CNBC viewers recently: “Gold should be part of everybody’s portfolio. We have a situation now when you have too much debt. Too much debt leads to the printing of money to make it easier to service. All of those things mean that some portion [of a portfolio] should be in gold.”
Dalio’s conclusion? “Only gold and real assets would survive.”
All of this positive macro news about gold has managed to influence the gold chart too. According to asset manager Blackrock, “the gold chart has turned decidedly bullish.” Blackrock was speaking about the so-called “golden cross”. That occurs when the 50-day moving average moves above the 200-day moving average.
Blackrock noted that the last time gold’s chart looked so good was shortly after the Federal Reserve announced QE1, the first round of money printing. It said that if gold does the same thing it did back then, the price of the precious metal will hit $2,400 an ounce by next summer. Of course, macro factors like Chinese and Indian demand for physical gold will play a major role in whether we reach those lofty levels.
While I am bullish on gold longer term the chart patterns, volume and sentiment for both gold and silver are overwhelmingly bearish looking for the next couple weeks. I sharp pullback is likely to unfold before they take another run at resistance and breakout to new highs.
Chris Vermeulen
http://www.thegoldandoilguy.com/wp-content/uploads/2014/11/tgaoglogo.png00adminhttp://www.thegoldandoilguy.com/wp-content/uploads/2014/11/tgaoglogo.pngadmin2012-10-18 08:59:392014-03-04 13:32:45Gold Is Not Back In Favor Yet…
It is an endless debate for investors interested in gold. Should they buy a direct play on the gold price, either gold bullion itself or even so-called paper gold with an ETF such as the SPDR Gold Shares (NYSEArca: GLD)? Or should they invest into gold equities, particularly the larger, higher quality gold mining companies?
Recent history suggests the answer is gold itself. According to Citigroup, physical gold has outperformed global gold equities 120% percent of the time over the past 5 years. Stocks of the bigger gold mining firms seem to react adversely to bad news (which is normal), but the problem is they react with no more than a yawn to good news. These type of stocks are contained in the Market Vectors Gold Miners ETF (NYSEArca: GDX).
Gold Mining Stocks ETF - GDX
Evidence of this trend can been see in the latest news to hit the industry…the slowdown in expansion as recently signaled by the world’s largest gold producer, Barrick Gold (NYSE: ABX). The company’s stock has fallen by more than 30 percent over the last year due to cost overruns at major projects. The latest blowup in costs of up to $3 billion occurred in its estimate for development of its flagship Pascua-Lama project on the border of Chile and Argentina. The project may now cost up to $8 billion.
In addition, Barrick decided to shelve the $6 billion Cerro Casale in Chile and the $6.7 billion Donlin Gold project in Alaska. Barrick is not alone in its thinking among the major gold producers. The CEO of Agnico-Eagle Mines (NYSE: AEM), Sean Boyd, recently said “The era of gold mega-projects may be fading. The industry is moving into an era of cash flow generation, yields and capital discipline.”
Fair enough. But are gold mining companies’ management walking the walk about yields or just talking the talk? Last year, many of the larger miners made major announcements that they would be focusing on boosting their dividends to shareholders in attempt to attract new stockholders away from exchange traded vehicles such as GLD, which have siphoned demand away from gold equities. Barrick, for example, did boost its dividend payout by a quarter from the previous level. Newmont Mining (NYSE: NEM), which has also cut back on expansion plans, has pledged to link its dividend payout to the price of gold bullion.
So in effect, the managements at the bigger gold mining companies (which are having difficulties growing) are trying to move away from attracting growth-only investors to enticing investors that may be interested in high dividend yields. This is a logical move.
But rising costs at mining projects may put a crimp into the plans of gold mining companies’ as they may not have the cash to raise dividends much. And they have done a poor job of raising dividends for their shareholders to date. In 2011 the dividend yields for gold producers globally was less than half the average for the mining sector as a whole at a mere 1.3 percent. Their yields are below that of the base metal mining sector and the energy sector.
It seems like management for these precious metal companies have the similar emotional response shareholders have when they are in a winning position. When the investor’s brain has experienced a winning streak and is happy it automatically goes into preservation/protection mode. What does this mean? It means management is going to tight up their spending to stay cash rich as they do not want to give back the gains during a time of increased uncertainty. Smaller bets/investments are what the investor’s brain is hard wired to do which is not always the right thing to do…
Looks like there is still a lot work to be done by gold mining companies’ to improve returns to their shareholders. But with all that set aside it is important to realize that when physical gold truly starts another major rally. These gold stocks will outperform the price of gold bullion drastically for first few months.
Gold Stock Rally
Gold Miner Trading Conclusion:
In short, last weeks special report on gold about how gold has been forming a major launch pad for higher prices over the past year. Gold bullion has held up well while gold miner stocks have given up over 30% of their gains. If/when gold starts another rally I do feel gold miner stocks will be the main play for quick big gains during the first month or two of a breakout. The increased price in gold could and value of the mining companies reserves could be enough to get management to start paying their investors a decent dividend which in turn would fuel gold miner shares higher.
Both gold and silver bullion prices remain in a down trend on the daily chart but are trying to form a base to rally from which may start any day now. Keep your eye on precious metals going into year end.
If you would like to get my weekly analysis on precious metals and the board market be sure to join my free newsletter at www.TheGoldAndOilGuy.com
Chris Vermeulen
http://www.thegoldandoilguy.com/wp-content/uploads/2014/11/tgaoglogo.png00adminhttp://www.thegoldandoilguy.com/wp-content/uploads/2014/11/tgaoglogo.pngadmin2012-08-13 20:35:502014-03-06 08:05:03Gold Mining Stocks Continue to Disappoint But Not For Long
“No State shall enter into any Treaty, Alliance, or Confederation; grant Letters of Marque and Reprisal; coin Money; emit Bills of Credit; make any Thing but gold and silver Coin a Tender in Payment of Debts; pass any Bill of Attainder, ex post facto Law, or Law impairing the Obligation of Contracts, or grant any Title of Nobility.”
~ United States Constitution, Excerpt from Article 1, Section 10 ~
A quick glance at most of the headlines over the weekend and the primary focus seemed to be either calling a near term top in domestic equity indices or a focus on the Greek debt situation. Why is anyone even paying attention to what is going on over there? Until the ISDA declares a default where the underlying Credit Default Swaps (CDS) are triggered, it is all just noise.
The ECB has broken the rule of law by placing itself as the senior creditor ahead of private creditors, the Greek government is trying to pass retroactive legislation to trap private sector creditors holding out of the PSI, and the leader of Greece was not even elected by the people of Greece – how much more manipulation and insanity do we need to monitor?
Similar to the price action since 2008, central banks around the world control everything from financial markets to the ascent of political leaders. These same political leaders help central bankers and planners control policy and decision making at the highest government levels in Europe and around the world. It would seem that the United States should change the motto from “We the People” to “We the Bankers.”
However, there is one particular asset class that even the central bankers have a hard time controlling. While they can impact short term price action through direct currency manipulation initiatives, in the longer-term gold is likely to move in only one direction – higher.
The price action on Tuesday reminded market participants that actions such as the Greek bailout come at a cost. Quantitative easing and/or printing money (depending on what one wishes to call the practice of producing fiat currency out of thin air) has a direct impact on the price of gold.
Many financial pundits argue that gold has no utility, but what they fail to recognize is that gold is the senior currency to all other fiat currencies. Silver is also a form of currency and is senior to all other fiat currencies as well. While one can draw the utility of gold into question, the idea that gold is the senior most currency to all other fiat currencies is not new.
The Constitution of the United States of America, which is over 200 years old, refers to gold and silver as forms of payment. Looking back thousands of years the Romans used gold coins as a form of currency. The idea that gold and silver are currencies is certainly not a grandiose thought or a stretch of historical concept. Trying to depict gold as a worthless asset depends on your view and consideration of fiat currency.
There are those that would argue that the Federal Reserve of the United States is not actively manipulating economic conditions domestically or abroad. For those that view gold as a poor investment or hedge against currency devaluation need to consider the charts illustrated below. The chart below was produced by Thomas Gresham of Gresham’s Law.
Total Asset Growth of the Federal Reserve System – 1915 – 2012
It is rather obvious by looking at this chart that the Federal Reserve has actively sought to enter domestic and foreign financial markets. The surge in balance sheet assets serves to prove how far the Federal Reserve Bank is willing to go to maintain markets which seemingly are only allowed to move higher over time.
This chart is bearish for nearly any form of paper backed assets. The above referenced chart is long-term bearish for the Dollar and Treasuries and long-term bullish for physical gold and silver. As the Federal Reserve continues to debase the U.S. Dollar in concert with other central banks’ monetary easing programs, gold and silver prices over time are destined to move higher in virtually every form of fiat currency.
During the same time frame that the Federal Reserve has seen its balance sheet grow exponentially, the rapid rise of M2 money supply is staggering. The long term chart of M2 is compared to gold futures in the charts presented below.
M2 Money Stock
Gold Futures Monthly Chart
It is rather obvious what has happened to the price of gold as the M2 money supply has grown. The idea that the Federal Reserve has not already destroyed a significant amount of the purchasing power of the Dollar can easily be refuted by the two charts shown above.
In the short-term, gold and silver could suffer from a pullback, but in the intermediate to longer term it is unlikely that we have seen the highs of this bull market for either metal. As long as central banks around the world continue to print money and expand their balance sheets gold and silver will remain in a long-term bull market. The daily chart of gold futures is presented below.
Gold Futures Daily Chart
As can be seen above, it is not out of the question that we could see gold pullback to test one of the key moving averages in coming days/weeks. However, I expect the key support area to hold in the event of a sharp selloff. Ultimately, I expect to see a breakout over the resistance zone in the days/weeks ahead. However, I would not be surprised to see gold consolidate or work marginally lower from current prices before breaking out to the upside. Right now the primary threat in this fledgling gold rally is a short-term spike higher in the U.S. Dollar. The primary catalyst which could drive a flight to the Dollar involves the sovereign debt situation in Greece and the Eurozone as a whole.
While the short-term price action may be bearish, the intermediate to longer term time frames are quite bullish for metals as central banks will continue to race to debase their currencies. Quantitative easing in the U.S. and around the world will become pervasive and gold prices could potentially soar in value. The data from the Federal Reserve Bank itself suggests that they are indeed increasing the money supply. As time has passed, the money supply and gold have seemingly grown in lockstep with one another. Surely inquiring minds do not consider this mutual relationship between gold and the money supply to be purely coincidental.
As further evidence that the Federal Reserve continues to use quantitative easing to manipulate asset prices through direct entry into financial markets, a chart of the velocity of M2 clearly depicts that the velocity of money is declining. I am not an expert regarding macroeconomic data, but if the velocity of money is declining to 1960’s levels would it be a stretch to say that we may be going through a period of stagflation? The chart below illustrates the Velocity of M2 Money Stock courtesy of the St. Louis Federal Reserve Bank.
Velocity of M2 Money Stock
For those unfamiliar with the term velocity of money, it is simply the rate of turnover in the overall money supply. The velocity of M2 is expressed as the number of times that a Dollar is used to purchase final goods or services which are included in the total gross domestic product.
Conclusion
The short term technical picture in gold is a bit suspect due to overhead resistance and recent U.S. Dollar strength. However, the longer term macro factors that impact the value of the U.S. Dollar and precious metals are all telling us the same thing.
As time wears on and central banks do even more to prop up the broader economy and failing financial institutions, it is without question in my mind that gold and silver will both benefit handsomely from these decisions being made by central bankers from around the world.
Ultimately, I am very bullish of gold and silver in the intermediate to longer-term, but in the immediate short-term frame gold could consolidate or pullback before breaking out to the upside.
This material should not be considered investment advice. J.W. Jones is not a registered investment advisor. Under no circumstances should any content from this article or the OptionsTradingSignals.com website be used or interpreted as a recommendation to buy or sell any type of security or commodity contract. This material is not a solicitation for a trading approach to financial markets. Any investment decisions must in all cases be made by the reader or by his or her registered investment advisor. This information is for educational purposes only.
http://www.thegoldandoilguy.com/wp-content/uploads/2014/11/tgaoglogo.png00adminhttp://www.thegoldandoilguy.com/wp-content/uploads/2014/11/tgaoglogo.pngadmin2012-02-21 20:21:262014-03-06 12:19:16The Long-Term Fundamental Case for Gold
The stock markets had a very solid session. Most charts shot higher after Apple beat estimates Tuesday night surging over 10%. This set the tone for stocks Wednesday. Also the FOMC said they would keep interest rates low until mid 2014 and projected a 2% inflation rate which took the market by surprise. Looking at the 10 minute intraday charts of gold, silver, oil, and the SP500 you would think it was the 4rth of July with everything shooting higher.
My gut feeling before the FOMC meeting was that there would be no QE3 announced. This I figured would trigger the dollar to rise which in turn would put pressure on stocks and commodities. But the low interest rates until mid 2014 was the wild card trumping that scenario.
Trading around FOMC meetings always brings a heightened level of uncertainty to traders and investors. The news is unpredictable making that much more of beast to try and out smart. I personally do not trade on any news because of the added risk involved.
Let’s take a quick look at gold and silver…
The Weekly Gold Chart:
Gold has started to break out of its down trend and if it can hold up into Friday’s close then it will be a very positive sign for the shiny metal. It is still mid week and a lot can happen, so let’s see how it holds up and go from there.
The Weekly Silver Chart:
Silver has some work to do before it’s back in an uptrend on the weekly chart. I would not be surprised to see it catch up with gold and run toward the $35 resistance level in the next couple days.
Mid-Week Trend Conclusion:
In short, gold is on the move and in the next few weeks I figure we will be getting involved. Silver I think will unfold a little different from a chart pattern point of view, but I do feel there will be a buying opportunity soon also.
Looking more broad based we are seeing the stock market continue to make new highs with solid volume behind it while Crude oil continues to tread water.
Over the past five months gold has fallen sharply and is no longer headline news which it once dominated back in 2011 when it was making new highs every day. The shiny metal has been under pressure because traders and investors started to pull some money off the table to lock in gains. Gold prices had surged so fast most advanced traders knew that final high volume surge was not sustainable. But the main reason gold topped out in my opinion was because the US Dollar index had put in a bottom and started to build a base. As we all know a rising dollar typically means lower stocks and commodity prices.
I have posted some charts below covering gold in detail using multiple time frames. The weekly which is long term, daily which is the intermediate trend and the 4 hour chart which shows gold momentum and intraday action. At the very bottom I talk about the US Dollar and what is happening with that.
Gold Weekly Long Term Trend Analysis
The weekly chart is not the most exciting time frame to follow as you will grow old watching it. That being said it is crucial for understanding the long term trend, price and volume analysis.
Below you can see that gold’s recent pullback has been a 3 wave correction, which is a normal pullback for any investment. But taking into account the rally from 2008 – 2011 I feel this pullback will have one more low put in before bottoming out. This would make for a 5 wave correction much like what happened in 2008.
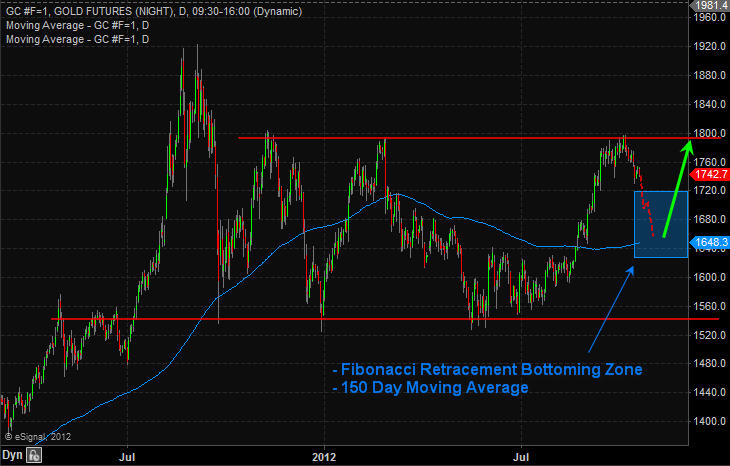
Daily Chart of Gold Showing the Intermediate Trend
The daily chart allows us to see gold intra-week price action and use the 150 moving average which is my preferred daily moving average. As you can see we are getting a similar pullback as 2008 with gold now trading under the 150 MA.
I would like to see gold make another lower low in the next 2-3 months. If that happens I feel it complete the correction and trigger a strong multi month or multiyear rally in gold.
4 Hour Intraday Chart of Gold
The 4 hour chart of gold allows us to see all the intraday price action which would normally not be seen with a daily chart. It also gives us enough data to build our analysis upon.
My preferred setup for gold which I feel if happens will trigger major buying in the yellow metal. If/when we get a rally in gold would also likely mean some more economic uncertainty has entered the market either from within the USA, Europe or China…
Weekly Dollar Index Long Term Analysis
The dollar has the potential to rally to the 87 – 88 level before putting in a major top. For this to happen we will need to see the Euro crumble (both currency and countries divide) in my opinion.
If you look at the weekly chart of gold and this chart of the dollar index you will notice that gold topped when the dollar bottomed. Over the past couple year’s gold and the dollar have had an inverse relationship to each other.
With all kinds of crap about to hit the fan overseas I think it’s very possible gold will rally with the dollar. Reason being there is way more people overseas who want to unload their euro’s and with all the negative talk and doubt with the US Dollar individuals will naturally want to buy more gold.
Weekend Trend Trading Conclusion:
In short, I expect a bumpy ride for both stocks and commodities in the first quarter of 2012. With any luck gold will pull back into my price zone shaking the majority of short term traders out just before it bottoms. And we will be positioning ourselves for a strong rally buying into their panic selling.
To just touch base on the general stock market quickly. I have a very bearish outlook for stocks. If the dollar continues to rise it is very likely the stock market will fall into a bear market. So I am VERY cautious with stock at this time.
If you would like to receive my Weekly reports, updates and trading education videos each week join my free newsletter here: www.GoldAndOilGuy.com
Chris Vermeulen
http://www.thegoldandoilguy.com/wp-content/uploads/2014/11/tgaoglogo.png00adminhttp://www.thegoldandoilguy.com/wp-content/uploads/2014/11/tgaoglogo.pngadmin2012-01-15 23:11:002014-03-06 12:26:36Gold Trend Forecast for 1st Quarter of 2012
So far in 2011 the equities market has made some sizable whip saw type moves that even veteran traders have had difficulty being on the right side of the price action. The year started out with equities being very overbought and extended making is virtually impossible for a low risk trader to buy on pullbacks. This was primarily due to the fact that there were no real pullbacks other than for a day or two which was immediately followed by prices continuing to grind higher.
In March, we finally had the pullback everyone was waiting for which we caught 4% of the sell off using an inverse ETF. Then we saw the bottom a few days later and caught a 3% gain from near the lows during a rally higher. So as you can see there have been three trends in the SP500 so far this year and we are about to see another sizable move unfold in the coming week.
In the past 8 sessions we have seen the market pullback slightly and the big question everyone is asking is do we get long or do we short here? Below are my thoughts and analysis….
US Dollar Index – Daily Chart
The dollar is still in a very strong down trend. As long as it continues to fall we should see higher stock and commodity prices. I do feel as though there is more downside for the dollar but its nearing an end. Stepping back and looking at the longer term chart of the dollar is very clear that it is getting oversold and sizable bounce should take place. If we see the dollar breakout of this falling wedge and start to rally you will want to be short stocks and commodities.
SPY ETF (SP500 Index Fund) Daily Chart
When comparing the Dow Jones Industrial Average and the Russell 2K indexes it is rather obvious that both have performed well this year and have broken above the February highs. The DOW was strong because it has it is exposed to energy stocks and with oil rocketing higher, it has helped those energy based stocks lift the index higher. The Russell 2K consists of small cap stocks and with the general public still being so bullish on the equity markets and investors are buying volatile, high risk small cap stocks to help boost their gains.
Now, looking at the SP500 it has yet to break the February high and this is because it holds several large tech stocks and financial stocks which have been lagging the overall market so far this year. Tech stocks and financials tend to lead the market and the fact that they are not is of great concern to me.
So going back to the US Dollar, I feel as though it has a little more downward motion left which will help get the SP500 to a new yearly high. Once the dollar rally starts, it will crush stock and commodity prices for several months.
Weekend Trend Conclusion:
In short, I favor the long side for both stocks and commodities, but that can change on a dime once the dollar starts to rally. There are many negative factors coming together that give me a negative outlook on stocks and commodities for the next 2-4 months and they are:
1. Quantitative Easing is now done = rising dollar
2. Investor sentiment is at an extreme bullish level = typically a bearish sign for stocks
3. The Sell In May and Go Away is almost here…
4. Earning season is here and that is typically a time when stocks get sold into = lower stock prices
My final thought is to keep positions small and be ready to flip positions from long to short and vise versa depending on what you trade…
http://www.thegoldandoilguy.com/wp-content/uploads/2014/11/tgaoglogo.png00adminhttp://www.thegoldandoilguy.com/wp-content/uploads/2014/11/tgaoglogo.pngadmin2011-04-17 22:27:402014-03-10 06:41:55Equities Don’t Follow the Dollar Index So Hold On!
I was starting to put on my bullish hat on Friday morning when out of the blue an ugly close has forced me to rethink my position. After viewing a few hundred charts, I have determined that while I am still leaning into higher prices at this point in time, I will not totally rule out a rollover on the S&P 500. In coming days the news flow will be extreme and headline risk will be everywhere we look. The S&P 500 has been able to deflect worry for quite some time now and in every case the resiliency is unquestionable.
However, we are nearing the beginning of another earnings season which will start in just a few weeks’ time. First quarter earnings for 2011 are going to be quite interesting and most analysts’ estimates are relatively challenging. Will the rubber hit the road into earnings? Are we about to see a double top play out into earnings, or is there going to be a breakout which will take us to the SPX 1,400 – 1,415 price level?
I know, I ask a lot of questions but quite frankly that is what is running through my head. The SPX is not out of the woods yet, and the price action on Friday indicated that there is some serious supply overhead and two key resistance levels to break through before the SPX gets back to clear blue skies overhead. That being said Chris Vermeulen has caught a nice part of the recent bounce with his subscribers. He does feel the market is about to get choppy but his analysis is pointing to overall higher prices in the coming weeks.
SPX illustrates the two key price levels:
In addition to the uncertainty that earnings season can bring, the primary reason why I am still leaning into a bullish move in the S&P 500 is the recent price action in the U.S. Dollar Index futures. The U.S. Dollar is scheduled to make its 3 year cycle low sometime this spring and the recent price action is indicative that the recent lows may not be the cycle lows. If the U.S. Dollar Index breaks down below recent lows, I would expect to see a nasty sell off.
The U.S. Dollar Index futures daily chart is shown below:
Whether readers believe that we are going to be in an inflationary environment or a deflationary environment is a topic for a different time, but the chart above is undeniable that recently the U.S. Dollar has declined in value and is exhibiting weak price action. Friday morning it looked as though the U.S. Dollar was going to rip higher, but by the end of the day sellers had stepped in and forced the U.S. Dollar into the red for the session. The price action on Friday highlighted the weakness in the U.S. Dollar and the high levels of overhead supply.
If the U.S. Dollar continues to weaken, in the short run I would view this as a positive for the S&P 500, crude oil, and precious metals. If the dollar breaks down to new lows, it should help buoy the S&P 500 and gold prices. Gold has been consolidating for nearly 6 months and a breakout higher from current price levels would make a trip to $1,500 an ounce very likely. I would not be surprised to see gold work even higher than $1,500 an ounce depending on how violent the selloff in the U.S. Dollar might be.
The weekly chart of gold futures is listed below:
I would think that most investors are aware that crude oil futures have been trading higher recently. On Friday oil prices climbed above recent resistance around the $107/barrel price level and reached new recent highs. Members that belong to my paid service enjoyed a relatively low risk options trade that we put on several weeks ago which involved selling cash secured naked puts on $USO. The trade was closed on Friday for a total gain of 85% of the premium that was sold. For long time readers, my stance on energy has been pretty obvious. In the longer term, energy prices almost have to go up as the world’s demand for energy increases while supplies remain flat.
I will likely get involved in another oil trade at some point in the future, but for right now I’m going to wait for a more prudent entry. Based on current price action, it would not surprise me to see crude oil futures test the $110 – $112 per barrel price range in the near future. If the $112/barrel price level is breached to the upside, a test of the $120/barrel price level will be likely.
The weekly chart of oil futures is listed below:
Weekend Trend Conclusion:
The S&P 500 is in an interesting place as far as the price action is concerned. With earnings season rapidly approaching and a possible break down in the U.S. Dollar Index likely, future price action is uncertain. I am leaning into the bullish camp at this point, but that could change rather quickly based on the price action later this week in both the S&P 500 and the U.S. Dollar Index. One thing worth mentioning is that if the U.S. Dollar Index were to bottom around these levels and a bounce higher transpired, it would put negative price pressure on most asset classes. The fact that price action in the U.S. Dollar Index has been weak lately makes me believe a break down is likely, but as most readers know Mr. Market offers few guarantees.
Assuming the U.S. Dollar breaks down, we should see the S&P 500, precious metals, and oil continue to work higher. My eyes are going to be watching the U.S. Dollar Index closely in coming days/weeks. If a breakdown transpires, the potential upside in precious metals and oil could be intense. Ultimately, I remain slightly bullish on stocks and extremely bullish on oil and precious metals. However, my entire thesis could change if the U.S. Dollar Index starts to firm up and begins to work higher. There are simply too many question marks surrounding price action to take on significant amounts of risk at this point in time.
http://www.thegoldandoilguy.com/wp-content/uploads/2014/11/tgaoglogo.png00adminhttp://www.thegoldandoilguy.com/wp-content/uploads/2014/11/tgaoglogo.pngadmin2011-04-03 21:58:042014-03-10 06:49:23The U.S. Dollar’s Impact on Price Action in the S&P 500, Gold, & Oil
Equities and Precious Metals are on the edge of another rally and it could start as early as tomorrow.
On March 13th I posted some of my analysis online showing how the market was trading at a key pivot point and that a sharp price movement was about to unfold. I also provided everyone with the direction in favor which played out perfectly catching a 4.5% in three days.
As of today we are getting the same setup I saw on March 13th, but this time it’s pointing to higher prices. Take a quick look at the charts I was looking at for both the SP500 and gold and you will notice that the SP500 and gold both moved to the support levels before starting to bounce: http://www.thegoldandoilguy.com/articles/it%E2%80%99s-do-or-die-week-for-equities-and-gold/
While we caught the move down on the SP500 playing the SDS Double leveraged inverse fund we did not take part in falling gold prices. Reason being, there is so much fear in the market and the amount of surprise news popping up each week I don’t think shorting precious metals is a safe call. Rather I am looking for a pullback to cleanse the holders of the commodity then I will buy once price confirms the continuation pattern has completed.
Now, stepping forward to this week’s price action
SPY Daily Chart
We can see in the chart below that price is currently testing a key resistance level. Before the week is over we could see some big price movement equities. I need to see what happens tomorrow but I have a feeling we could see a breakout to the upside for a long position.
Gold Miners Fund Daily Chart Gold stocks have be under performing the price of bullion for a few months but it looks as though they could be starting a sizable rally. If gold stocks continue to move sharply higher out of this pattern, then it’s a positive sign that gold and silver bullion will both continue to move up.
Gold Daily Chart Gold is testing a key resistance level and if it breaks above this pattern then expect much higher prices. I can see GLD moving up $5 from this level and gold futures moving up $60 per ounce fairly quickly.
Mid-Week Trend Report: In short, stocks and commodities may have shaken the weak positions out of the market during the recent pullback in price. Things could be ready to start another multi month rally and trade setups. Keep your eyes on the charts…
http://www.thegoldandoilguy.com/wp-content/uploads/2014/11/tgaoglogo.png00adminhttp://www.thegoldandoilguy.com/wp-content/uploads/2014/11/tgaoglogo.pngadmin2011-03-23 22:14:382014-03-10 06:59:06Another Do or Die Point for Equities & Gold – Get Ready!
It has been a roller coaster week thus far as stocks and precious metals plunged on heavy selling volume on the back of a rising dollar, only to make a strong rebound Wednesday. While there has been significant intraday price movement, it was no surprise to us as we have been anticipating this pullback since discussing it in my Sunday Gold Newsletter.
Let’s take a quick look at the charts…
US Dollar Daily Trading Chart
The past couple weeks the dollar has traded in a choppy fashion, and last week I mentioned to subscribers to keep any new positions small. The dollar looked ready to make a bounce and if it reverses we will see stocks and commodities correct rather sharply.
Last week we trimmed some profits on our gold and SP500 trading positions in anticipation of a rising dollar/lower equity and metals prices. The dollar is currently in a down trend so we are still trading with the trend, but the next couple sessions could potentially change that.
As you can see on the chart a similar pattern to what we saw during the May/June top earlier this year has now formed in reverse this month. It’s a simple pattern I call a drop-n-wash. It is like dropping a knife – you panic, then take action (move foot, then wash the kife). That is typically how the market reacts to this type of price pattern after an extended trend has taking place for a long period of time.
The dollar made an obvious breakdown which the entire world witnessed, causing traders who recently went long to panic and sell their positions. Those who like to short the dollar would have taken a short position, only to see the market reverse and head straight back up again. This pattern has yet to confirm, but through the use of the shorter time frame charts (5 Min, 10 Min, 30 Min), I have a feeling the dollar may continue to rise. However, until the dollar shows considerable strength I am still playing the long equities / long gold side of the equation.
SPY – SP500 ETF Trading Fund
The SP500 made a nice move up last week and we trimmed our position back to lock in more gains as I anticipated this pullback and possible gap fill. As you can see on the chart the moving averages are all heading up and that’s the direction we are still focusing on playing (buying dips).
The morning dip on Wednesday the market sentiment started to shift to become extremely bearish on the short term time frame (10 minute charts). If the market drops down to fill the rest of that gap, I have a feeling the majority of traders will panic out of their position giving us an extreme sentiment buy signal. Also a gap fill will bring the price down to the key moving averages which will act as a support level. I will notify members to add more to my SP500 long position if that happens.
GLD – Gold ETF Trading Fund
Gold has much of the same story as the SP500 but with a couple twists. Gold has huge global demand from banks, investors and traders adding more buying power to this investment than stocks right now. We could see gold hold up above its gap that formed last week. That being said, a pullback to the key moving averages would not only act as a major support level but also fill the gap. We currently have our long positions, but trimmed some profits near the highs and are sitting tight letting the market work it’s self out.
My trading partner J.W. Jones posted a great gold play yesterday which had a nice payout already. Read about his gold options trade here.
Mid-Week ETF Trading Conclusion:
In short, the focus should be kept on trading with the underlying trends until a trend change has been confirmed. So that means short the dollar, long equities, metals and oil.
That being said, because things are starting to look unstable it is crucial to trade smaller position sizes during times of uncertainty like this. Anticipating major market tops is very difficult and generally costly play, just ask everyone who has been trying to pick a top for the past 2 months… Anticipate trend changes, but don’t trade them until the price/volume action confirms the new trend.
Get My Daily Pre-Market Trading Videos, Daily Updates & Trade Alerts Here: www.GoldAndOilGuy.com
Last week was volatile thanks to China raising their interest rates a quarter basis point. This rate hike caused the Dollar to spike in value which in turn forced equities and metals to sell off sharply. This one day event caused equities to break below a short term support level causing a large number of protective stops to be triggered. This added more selling pressure causing the market to be down nearly 2.5% at one point but a late day bounce recouped a good chunk of the drop.
Wednesday & Thursday the market had a nice rally making back all of losses and then some. But Thursday afternoon we saw the market slip below a key short term support level and triggered another wave of stops. The market continues to resilience because it recovered into the close saving the day.
After Thursday’s end of day rally, we had expected a typical light volume session which typically chops around in a sideways or slow grind higher.
SPY – SP500 ETF 10 Minute Intraday Chart
I have put together a short video covering last weeks price action along with that I feel is likely to unfold this week.
http://www.thegoldandoilguy.com/wp-content/uploads/2014/11/tgaoglogo.png00adminhttp://www.thegoldandoilguy.com/wp-content/uploads/2014/11/tgaoglogo.pngadmin2010-10-24 19:47:542014-03-10 08:59:54Weekend SPX, Dollar, Oil and Gold Analysis and Video