Posts

My trading partner JW and I had a great talk the other day which spurred to the creation of this interesting and educational gold futures trading article we wanted to share with you.

Throughout most of 2013, gold futures have been under major selling pressure. Gold opened the year trading around $1,675 per ounce. As of the 12/02/13 close, gold futures were trading around $1,220 per ounce which would mean that thus far in 2013, gold futures have lost more than 27% of their value.

Looking back to September of 2011, gold’s all time high came in around $1,923 per ounce. In a little more than 2 years, gold prices have dropped around $700 per ounce representing a total loss of more than 36% based on the 12/02/13 closing price. I would say most analysts would agree that gold has been in a bear market over the past two years.

Before we begin looking at a few ways to use the gold etf GLD option structures to take advantage of higher future prices in the yellow metal, I thought I would focus readers’ attention on some bullish fundamental data for gold. Let us begin with a chart of the Federal Reserve’s Total Assets which is shown below.

Chart1 (4)

The data shown above comes directly from the Federal Reserve’s public database itself. Essentially, this is the Fed’s balance sheet and its obvious that the money printing has gone parabolic. The Federal Reserve prints money to purchase Treasuries and mortgage backed securities which end up on the Federal Reserve’s balance sheet.

Interestingly enough, the chart above illustrates the amount of money the Federal Reserve has been printing since the beginning of 2011. The chart below illustrates the price of gold futures during the same period.

Chart2 (3)

Gold futures have moved lower in price while the Federal Reserve has printed an unprecedented amount of money through the quantitative easing program. It has been pointed out that the flow of liquidity is more important than the total money stock, but these two charts when viewed together are rather odd at the very least. However, we must all continue to remind ourselves that there is no manipulation of any kind going on . . .

Another odd situation has developed regarding the gold miners and the price of gold relative to production costs. The gold spot price has essentially moved down below the average 2013 cash cost of $1,250 – $1,300 per ounce. Price action in gold futures is rapidly approaching the marginal cost to produce gold which is around $1,125. The chart of the various gold production costs is shown below.

Chart3 (1)
Chart Courtesy of zerohedge.com

Gold prices closed on 12/02/2013 at $1,218 per ounce. Based on the closing price, gold futures are less than $100 per ounce away from the marginal cost to produce gold. If the yellow metal’s price moves below the cash and marginal cost of production gold mining volumes world wide will begin to decline.

The gold miners have likely already started lowering their production levels at current prices. The production slow down would only accelerate should prices move down below the marginal cost of production. I believe that these production costs will help put a floor underneath gold prices in the longer-term.

It is widely known that there is strong current demand for physical gold coming from Russia, India, and China. If the gold miners began to slow production levels considerably it is likely that physical gold prices could explode to the upside.

Should production levels decline while demand remains at the same level all of the manipulation in the world could not stop gold prices from arriving at their natural market based price. I think most readers and analysts would agree that the natural market based price is higher, not lower from the marginal and cash costs of production.

As many readers know, my primary focus as a trader is in the world of options where I focus primarily on implied volatility and probabilities to formulate new positions. Unfortunately options on gold futures are fairly limited and are not actively traded. However, the options on the gold ETF GLD are very liquid.

With the longer term fundamentals intact, I thought I would post a few possible trading ideas using GLD options to get long GLD while giving the trader some duration to allow for the time needed for the trade to work.

A fairly cheap way to construct a longer-term bullish position in GLD would be to look at a June 2014 Call Debit Spread or a June 2014 Broken-Wing Call Butterfly Spread.

These trade structures use multi-legged constructions and would essentially allow traders to get long GLD.

Due to the inherent leverage built into options, these positions would not require near as much capital as buying an equity stake in GLD or being long gold futures. The trade structures mentioned above would also mitigate Theta risk, also known as time decay so the passage of time would not have a significant impact on the trade’s overall profitability.

In fact, both of these trade structures would actually benefit from the passage of time in terms of profitability down the road. There are a variety of other trade structures that could be used to benefit from higher prices in GLD while simultaneously capitalizing on the passage of time as a profitability engine. Each trade construction carries a variety of different potential risks as well as required capital outlay or margin encumbrance.

I want to be clear in stating that these trade structures are purely for educational purposes and should not be considered a solicitation or investment advice. Whether we are discussing gold futures, GLD, or GLD options these are all paper investments and they should not be viewed as a substitute for physical gold holdings. Physical gold would likely benefit the most from any supply shock in the future.

In closing, I believe that the fundamental picture for gold is improving by the day. While more downside is likely in the near-term, the longer-term picture for higher gold prices in 2014 and beyond seems quite likely.

In a world where central banks are printing fiat currency at record rates, at some point in the future physical gold prices will no longer be able to be held back from true price discovery.

To learn more about probability based option trading, consider becoming a member of www.OptionsTradingSignals.com for a totally different view of the markets and how to trade options for consistent profitability over the longer-term.

By: JW Jones & Chris Vermeulen


This material should not be considered investment advice. J.W. Jones is not a registered investment advisor. Under no circumstances should any content from this article or the OptionsTradingSignals.com website be used or interpreted as a recommendation to buy or sell any type of security or commodity contract. This material is not a solicitation for a trading approach to financial markets. Any investment decisions must in all cases be made by the reader or by his or her registered investment advisor. This information is for educational purposes only. 

Jan 22, 2010
It’s been a crazy week for stock and futures traders as the market moved up and down like a yo-yo, finally closing down sharply on the week.

Earlier this week I posted a report showing the Volatility Index (VIX) and how it was then trading at an extreme low level which triggered the sharp market corrections. Since that post the VIX has now risen over 30% as traders start selling positions to lock in gains.

Take a quick look at the Volatility Index chart:


Chart of S&P500 Daily Price Action

Since the low in the volatility index a few days ago we have seen the S&P500 drop over 3.4%. This sharp sell off in equities and ES futures has happened in a very short period of time making the overall market oversold when looking at short time frame of the daily chart. With the market oversold and also trading near a support level I expect we could get a weak bounce lasting 1-5 days before rolling over for another wave of selling.

There are several reasons I feel this will happen:
1. Experience from seeing setups/patterns like this across many different indexes and investment vehicles leads me to believe distribution of shares are now starting to flood the market.

2. The market sentiment surveys are still extremely bullish. What does this mean? Well if almost everyone is bullish, then who is left to buy?

3. As the good old saying goes “Buy the Rumor, Sell the News”. With earning season starting I cannot help but think everyone (smart money) will be selling into the good earnings news as dumb money buys into stocks as they meet or beat earnings. This inflow of dumb money is exactly what the big guys need to unload massive amounts of shares at a premium. Also I would like to point out that earning estimates have been very low that past year which I think has been on purpose for the institutions. This makes it very easy for companies to beat estimates each quarter giving the warm cozy feeling to retail investors (us, the small guys)

4. Also Chares Biderman on Bloomberg pointed out the other day that the market looks to be manipulated by the feds as virtually all the gains have been produced after hours in the futures market.

Chares Biderman Video
The United States in my opinion is much more corrupt than most people think and I don’t really want to get into this rather large and interesting debate at the moment. But Charles Biderman has some very interesting points which fall in line with my thinking about how much of what is happening is really natural and what is completely manipulated in the past 10 months of rising market prices.

Must Watch 5 Minute Video

Quick Technical Chart Update on Gold
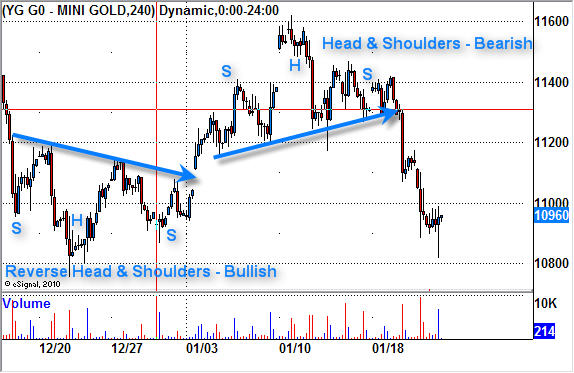
I thought this chart may be of interest to some of you as it shows two perfect textbook plays on the 4hr gold futures trading chart.

As you can see the first pattern is a reverse head & shoulders pattern. This is bullish and a breakout above the neckline would signal a buy point. Now if we use basic technical analysis with this pattern we can measure the potential move up by looking reverse head and shoulders pattern. You take the low of the upside down head $1075, and go straight up to the neckline at $1117. That is a total of $42. So if we add that $42 to the breakout point above the neckline then we can have a price target of $1117 + $42 = $1159.

As we can see the price of gold over the next couple days rallied to the $1160 level. Trading is not that easy but that is how it works in general. The hard part is knowing how to manage your trade and I scale out of positions as the price matures reaching short term resistance levels and by adjusting my stops accordingly to lock in maximum gains while minimizing downside risk.

A couple days later the same chart formed a regular Head & Shoulders and has since moved its potential measured move. I m not expecting a weak bounce in gold as with the overall stock market, but I am still not sure that the selling is over.
4 Hour Gold Trend

The “Weak’end Trading Conclusion:
In short, the market was turned upside down this week. Those who follow me should be in cash or mostly in cash as this drop was anticipated a few days ago.

Trading during fast moving markets is much tougher for swing traders as pivot points for indexes and commodities tend to happen during the intraday or during futures trading at night. High volatility like this is fantastic for active traders who focus on shorter time frames like the 4hr and 60minute charts, as opposed to trading just the daily chart and entering and exiting positions at the open and close each day.

I continue to watch the market and plan on providing some of these short term setups on the 4 hr chart using both the GLD etf gold fund and the YG Gold futures mini contract.

If you are interested in Trading Gold Futures and other contracts please join my Free Futures Trading Newsletter:

Chris Vermeulen

Welcome back everyone! It’s time to buckle up and get ready for another exciting year of trading.

When the market is moving on light volume I tend to focus on very short term plays to minimize my exposure to volatility. The past couple of weeks have been great for day traders and futures trades as we took advantage of the short term seasonal holiday rally in the broad market and also by shorting gold when bounces reached resistance levels.

This year I will be providing many more trades as I focus more on 60 minute trading charts to scalp the market with low risk quick reward setups. Also I will start providing futures trading analysis and signals for those who want to be more active and generate more income on a monthly basis.

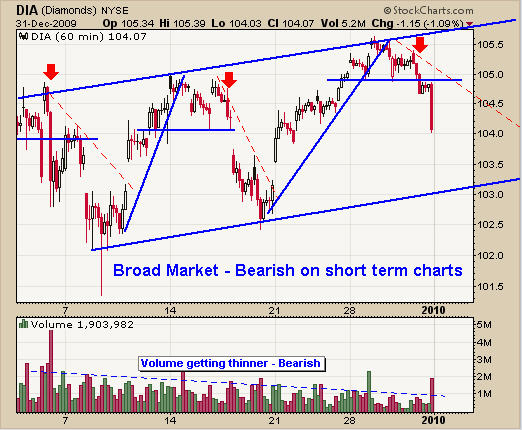
DIA – Dow Jones Exchange Traded Fund – 60 Minute Chart
The Dow has been trading in this range for a couple weeks providing some excellent short plays. Although I tell members not to short in a bull market, there are times when shorting in a bull market looks and feels right. The past month has been the perfect mix for shorting using the 60 minute charts.

Dow Jones Trend

Dow Jones Trend

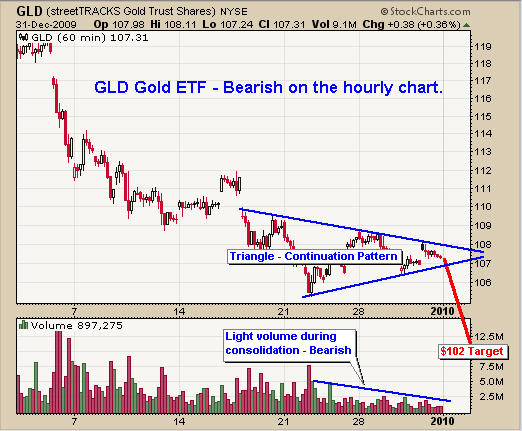
GLD – Gold Exchange Traded Fund – 60 Minute Chart
Gold is in a strong bull market but the short term charts have provided over 13 short trades in the past 2 weeks for futures traders playing the bounces to resistance levels. The triangle on the 60 minute chart with declining volume is a continuation pattern of the short term trend which is down.

Because gold is trading near a support level on the daily chart, I am waiting patiently for a perfect setup to go short, or long depending on what happens in the coming hours. I predict lower prices with $102 area for the next support level.

Gold ETF

Gold ETF

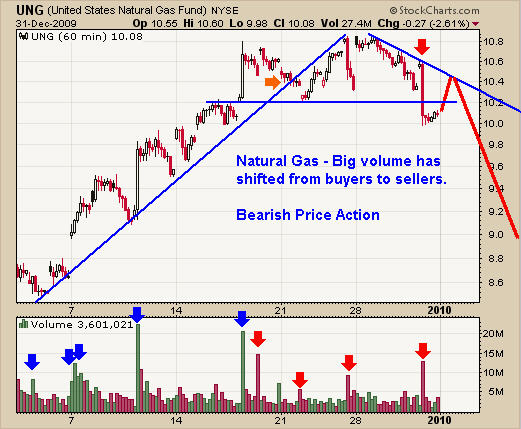
UNG – Natural Gas Fund – 60 Minute Chart
Natural gas is trading at resistance on the daily and weekly charts. This 60 minute chart allows us to take a closer look at the intraday momentum which clearly shows there are more sellers than buyers at this level. I see lower prices in the coming hours/days.

UNG not a good fund for holding positions more than 2 weeks, it does provide excellent trading opportunities for day traders and 60 minute chart setups.

Natural Gas Tends

Natural Gas Tends

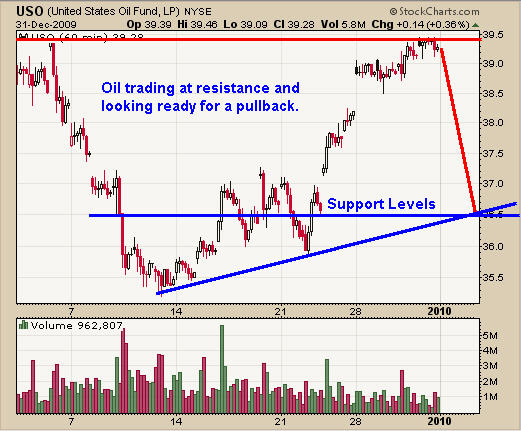
USO – Crude Oil Fund – 60 Minute Chart
Crude oil had a perfect bounce off of a support level on the weekly and daily charts back on the 14th. Oil is now trading at a short term resistance level and I feel it will head lower in the coming days. We still need more price action before taking a position. Let’s watch and wait.

Oil Trend Trading

Oil Trend Trading

Trends of Gold, Dow, Oil and Natural Gas Conclusion:
The broad market and commodities listed above seem to be trading at resistance levels with signs of rolling over. As a technical trader the charts do all the talking and they are pointing to lower prices in the near term which falls in line with my gut feeling that a sharp pullback across the board is lurking in January. Once the big money start getting pushed around again we will know who is in control, buyers or sellers.

Let’s continue to focus on these short term charts to take advantage of any low risk setups which come our way.

Get these Free Weekly Trend Trading Charts Emailed to you:

Chris Vermeulen
www.TheGoldAndoilGuy.com