There should be an inverse relationship between gold (NYSEARCA: GLD) and copper (NYSEARCA: JJC).
Most of gold is used for investment purposes. As a result, it rises when there is economic weakness and investors lose confidence in the fiat currency of a country. Most of copper is used for industrial purposes. Therefore, the price of The Red Metal should increase when economies are booming, as there is a greater demand for it from the factories operating at full throttle and for the buildings being constructed.
Gold Bullion Prices
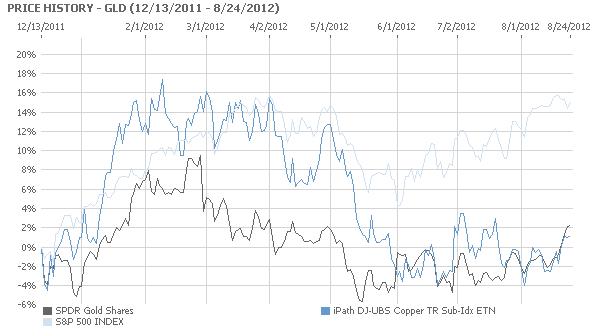
As the chart below evinces, the inverse relationship between the exchange traded for gold, SPDR Gold Shares, and the exchange traded fund for copper, iPath Copper, has broken down due to traders positioning themselves for the introduction of Quantitative Easing 3 when Federal Reserve Chairman Ben Bernanke speaks at Jackson Hole this Friday.
Continuing economic weakness in the United States will almost certainly lead the Federal Reserve to act in way that is more powerful than Operation Twist, the selling of short term securities to buy those with a longer term. Based on the most recent data, economic growth in the United States is falling as the unemployment rate is rising. A recent statement by the Federal Reserve was unusually clear in calling for greater action.
Both the JJC and the GLD have risen together as traders expect more economic stimulus from the United States Government. This will weaken the US Dollar and raise the price of commodities, as happened with Quantitative Easing 2. During the period of Quantitative Easing 2, from November 2010 to June 11, the US Dollar fell in value and the GLD and the JJC soared, along with other commodity prices, particularly oil. This pattern is being repeated as traders are preparing for the initiation of Quantitative Easing 3 when Bernanke speaks Friday, or at the next Federal Open Market Committee meeting.
Gold Spot Price Chart
TheTechnicalTraders Analysis & Trade Idea Delivered To Your INBOX!
http://www.thegoldandoilguy.com/wp-content/uploads/2014/11/tgaoglogo.png00adminhttp://www.thegoldandoilguy.com/wp-content/uploads/2014/11/tgaoglogo.pngadmin2012-08-27 08:23:092014-03-06 07:44:53Gold and Copper Rising Due to QE3 Hopes
It is an endless debate for investors interested in gold. Should they buy a direct play on the gold price, either gold bullion itself or even so-called paper gold with an ETF such as the SPDR Gold Shares (NYSEArca: GLD)? Or should they invest into gold equities, particularly the larger, higher quality gold mining companies?
Recent history suggests the answer is gold itself. According to Citigroup, physical gold has outperformed global gold equities 120% percent of the time over the past 5 years. Stocks of the bigger gold mining firms seem to react adversely to bad news (which is normal), but the problem is they react with no more than a yawn to good news. These type of stocks are contained in the Market Vectors Gold Miners ETF (NYSEArca: GDX).
Gold Mining Stocks ETF - GDX
Evidence of this trend can been see in the latest news to hit the industry…the slowdown in expansion as recently signaled by the world’s largest gold producer, Barrick Gold (NYSE: ABX). The company’s stock has fallen by more than 30 percent over the last year due to cost overruns at major projects. The latest blowup in costs of up to $3 billion occurred in its estimate for development of its flagship Pascua-Lama project on the border of Chile and Argentina. The project may now cost up to $8 billion.
In addition, Barrick decided to shelve the $6 billion Cerro Casale in Chile and the $6.7 billion Donlin Gold project in Alaska. Barrick is not alone in its thinking among the major gold producers. The CEO of Agnico-Eagle Mines (NYSE: AEM), Sean Boyd, recently said “The era of gold mega-projects may be fading. The industry is moving into an era of cash flow generation, yields and capital discipline.”
Fair enough. But are gold mining companies’ management walking the walk about yields or just talking the talk? Last year, many of the larger miners made major announcements that they would be focusing on boosting their dividends to shareholders in attempt to attract new stockholders away from exchange traded vehicles such as GLD, which have siphoned demand away from gold equities. Barrick, for example, did boost its dividend payout by a quarter from the previous level. Newmont Mining (NYSE: NEM), which has also cut back on expansion plans, has pledged to link its dividend payout to the price of gold bullion.
So in effect, the managements at the bigger gold mining companies (which are having difficulties growing) are trying to move away from attracting growth-only investors to enticing investors that may be interested in high dividend yields. This is a logical move.
But rising costs at mining projects may put a crimp into the plans of gold mining companies’ as they may not have the cash to raise dividends much. And they have done a poor job of raising dividends for their shareholders to date. In 2011 the dividend yields for gold producers globally was less than half the average for the mining sector as a whole at a mere 1.3 percent. Their yields are below that of the base metal mining sector and the energy sector.
It seems like management for these precious metal companies have the similar emotional response shareholders have when they are in a winning position. When the investor’s brain has experienced a winning streak and is happy it automatically goes into preservation/protection mode. What does this mean? It means management is going to tight up their spending to stay cash rich as they do not want to give back the gains during a time of increased uncertainty. Smaller bets/investments are what the investor’s brain is hard wired to do which is not always the right thing to do…
Looks like there is still a lot work to be done by gold mining companies’ to improve returns to their shareholders. But with all that set aside it is important to realize that when physical gold truly starts another major rally. These gold stocks will outperform the price of gold bullion drastically for first few months.
Gold Stock Rally
Gold Miner Trading Conclusion:
In short, last weeks special report on gold about how gold has been forming a major launch pad for higher prices over the past year. Gold bullion has held up well while gold miner stocks have given up over 30% of their gains. If/when gold starts another rally I do feel gold miner stocks will be the main play for quick big gains during the first month or two of a breakout. The increased price in gold could and value of the mining companies reserves could be enough to get management to start paying their investors a decent dividend which in turn would fuel gold miner shares higher.
Both gold and silver bullion prices remain in a down trend on the daily chart but are trying to form a base to rally from which may start any day now. Keep your eye on precious metals going into year end.
If you would like to get my weekly analysis on precious metals and the board market be sure to join my free newsletter at www.TheGoldAndOilGuy.com
Chris Vermeulen
http://www.thegoldandoilguy.com/wp-content/uploads/2014/11/tgaoglogo.png00adminhttp://www.thegoldandoilguy.com/wp-content/uploads/2014/11/tgaoglogo.pngadmin2012-08-13 20:35:502014-03-06 08:05:03Gold Mining Stocks Continue to Disappoint But Not For Long
“No State shall enter into any Treaty, Alliance, or Confederation; grant Letters of Marque and Reprisal; coin Money; emit Bills of Credit; make any Thing but gold and silver Coin a Tender in Payment of Debts; pass any Bill of Attainder, ex post facto Law, or Law impairing the Obligation of Contracts, or grant any Title of Nobility.”
~ United States Constitution, Excerpt from Article 1, Section 10 ~
A quick glance at most of the headlines over the weekend and the primary focus seemed to be either calling a near term top in domestic equity indices or a focus on the Greek debt situation. Why is anyone even paying attention to what is going on over there? Until the ISDA declares a default where the underlying Credit Default Swaps (CDS) are triggered, it is all just noise.
The ECB has broken the rule of law by placing itself as the senior creditor ahead of private creditors, the Greek government is trying to pass retroactive legislation to trap private sector creditors holding out of the PSI, and the leader of Greece was not even elected by the people of Greece – how much more manipulation and insanity do we need to monitor?
Similar to the price action since 2008, central banks around the world control everything from financial markets to the ascent of political leaders. These same political leaders help central bankers and planners control policy and decision making at the highest government levels in Europe and around the world. It would seem that the United States should change the motto from “We the People” to “We the Bankers.”
However, there is one particular asset class that even the central bankers have a hard time controlling. While they can impact short term price action through direct currency manipulation initiatives, in the longer-term gold is likely to move in only one direction – higher.
The price action on Tuesday reminded market participants that actions such as the Greek bailout come at a cost. Quantitative easing and/or printing money (depending on what one wishes to call the practice of producing fiat currency out of thin air) has a direct impact on the price of gold.
Many financial pundits argue that gold has no utility, but what they fail to recognize is that gold is the senior currency to all other fiat currencies. Silver is also a form of currency and is senior to all other fiat currencies as well. While one can draw the utility of gold into question, the idea that gold is the senior most currency to all other fiat currencies is not new.
The Constitution of the United States of America, which is over 200 years old, refers to gold and silver as forms of payment. Looking back thousands of years the Romans used gold coins as a form of currency. The idea that gold and silver are currencies is certainly not a grandiose thought or a stretch of historical concept. Trying to depict gold as a worthless asset depends on your view and consideration of fiat currency.
There are those that would argue that the Federal Reserve of the United States is not actively manipulating economic conditions domestically or abroad. For those that view gold as a poor investment or hedge against currency devaluation need to consider the charts illustrated below. The chart below was produced by Thomas Gresham of Gresham’s Law.
Total Asset Growth of the Federal Reserve System – 1915 – 2012
It is rather obvious by looking at this chart that the Federal Reserve has actively sought to enter domestic and foreign financial markets. The surge in balance sheet assets serves to prove how far the Federal Reserve Bank is willing to go to maintain markets which seemingly are only allowed to move higher over time.
This chart is bearish for nearly any form of paper backed assets. The above referenced chart is long-term bearish for the Dollar and Treasuries and long-term bullish for physical gold and silver. As the Federal Reserve continues to debase the U.S. Dollar in concert with other central banks’ monetary easing programs, gold and silver prices over time are destined to move higher in virtually every form of fiat currency.
During the same time frame that the Federal Reserve has seen its balance sheet grow exponentially, the rapid rise of M2 money supply is staggering. The long term chart of M2 is compared to gold futures in the charts presented below.
M2 Money Stock
Gold Futures Monthly Chart
It is rather obvious what has happened to the price of gold as the M2 money supply has grown. The idea that the Federal Reserve has not already destroyed a significant amount of the purchasing power of the Dollar can easily be refuted by the two charts shown above.
In the short-term, gold and silver could suffer from a pullback, but in the intermediate to longer term it is unlikely that we have seen the highs of this bull market for either metal. As long as central banks around the world continue to print money and expand their balance sheets gold and silver will remain in a long-term bull market. The daily chart of gold futures is presented below.
Gold Futures Daily Chart
As can be seen above, it is not out of the question that we could see gold pullback to test one of the key moving averages in coming days/weeks. However, I expect the key support area to hold in the event of a sharp selloff. Ultimately, I expect to see a breakout over the resistance zone in the days/weeks ahead. However, I would not be surprised to see gold consolidate or work marginally lower from current prices before breaking out to the upside. Right now the primary threat in this fledgling gold rally is a short-term spike higher in the U.S. Dollar. The primary catalyst which could drive a flight to the Dollar involves the sovereign debt situation in Greece and the Eurozone as a whole.
While the short-term price action may be bearish, the intermediate to longer term time frames are quite bullish for metals as central banks will continue to race to debase their currencies. Quantitative easing in the U.S. and around the world will become pervasive and gold prices could potentially soar in value. The data from the Federal Reserve Bank itself suggests that they are indeed increasing the money supply. As time has passed, the money supply and gold have seemingly grown in lockstep with one another. Surely inquiring minds do not consider this mutual relationship between gold and the money supply to be purely coincidental.
As further evidence that the Federal Reserve continues to use quantitative easing to manipulate asset prices through direct entry into financial markets, a chart of the velocity of M2 clearly depicts that the velocity of money is declining. I am not an expert regarding macroeconomic data, but if the velocity of money is declining to 1960’s levels would it be a stretch to say that we may be going through a period of stagflation? The chart below illustrates the Velocity of M2 Money Stock courtesy of the St. Louis Federal Reserve Bank.
Velocity of M2 Money Stock
For those unfamiliar with the term velocity of money, it is simply the rate of turnover in the overall money supply. The velocity of M2 is expressed as the number of times that a Dollar is used to purchase final goods or services which are included in the total gross domestic product.
Conclusion
The short term technical picture in gold is a bit suspect due to overhead resistance and recent U.S. Dollar strength. However, the longer term macro factors that impact the value of the U.S. Dollar and precious metals are all telling us the same thing.
As time wears on and central banks do even more to prop up the broader economy and failing financial institutions, it is without question in my mind that gold and silver will both benefit handsomely from these decisions being made by central bankers from around the world.
Ultimately, I am very bullish of gold and silver in the intermediate to longer-term, but in the immediate short-term frame gold could consolidate or pullback before breaking out to the upside.
This material should not be considered investment advice. J.W. Jones is not a registered investment advisor. Under no circumstances should any content from this article or the OptionsTradingSignals.com website be used or interpreted as a recommendation to buy or sell any type of security or commodity contract. This material is not a solicitation for a trading approach to financial markets. Any investment decisions must in all cases be made by the reader or by his or her registered investment advisor. This information is for educational purposes only.
http://www.thegoldandoilguy.com/wp-content/uploads/2014/11/tgaoglogo.png00adminhttp://www.thegoldandoilguy.com/wp-content/uploads/2014/11/tgaoglogo.pngadmin2012-02-21 20:21:262014-03-06 12:19:16The Long-Term Fundamental Case for Gold
The past few weeks traders and investors have been completely spooked from the surge of negative news and collapsing stock prices. This fear can be seen by looking at the volume on the GLD gold ETF fund. With gold being in the spot light for several years now and the fact that anyone can own gold simply through buying some GLD shares. It only makes sense that reading the volume on this chart gives us a good feel for what the masses are feeling emotionally.
If we step back to trading basics we know that fear is the strongest force in the financial market for moving prices. And that there are a few ways to read fear in the market and the more which line up at the same time means there is a higher probability of trend reversal in the near future.
The first thing I look for is a rising volatility index (VIX). This index rises when investors become fearful of stock prices falling be hedging positions or flat out buying put options to profit from a falling market.
Second, I look for a high selling volume ratio meaning at least 3:1 shares traded are from individuals hitting the sell button in a panic thinking that the market is about to collapse.
And last but not least… I look at the GLD gold etf volume and price action. A surge in GLD volume after a strong move up means everyone is scared and dumping their money into a safe haven.
Let’s take a look at some charts to get a better feel.
GLD Weekly Gold Chart:
As you can see there are sizable price movements which ended with strong volume surges. Those volume surges mean that the majority of investors have reached the same emotional level and bought gold for safety (GLD ETF). Keep in mind that the big money players and market makers can see this taking place and that is when they start selling into that surge of buying volume locking in maximum gains before there are no more buyers left to hold the price up. Tops generally take a few weeks to form so don’t expect a one day collapse.
The recent rally in gold has taken place when stocks have fallen sharply. Money has been pulled out of stocks and pushing into gold but I think that is about to change…
SPY Weekly SPX Chart:
The past month has been a blood bath for stocks. But from looking at the charts, volume and the fear in the market I can’t help but think we are going to see higher stock prices as investors see stocks moving higher, they will pull money out of gold and dump it back into stocks and likely high dividend paying stocks…
Mid-Week Trading Conclusion:
In short, everyone piled into gold sending it rocketing higher and I feel it has moved to far – to fast and is ready for a pullback (pause lasting 2-12 weeks). In association with gold’s pullback I feel investors are now realizing they sold their stocks at the bottom of this correction because fear took hold of their investing decisions. Now they are starting to think about getting long stocks but it still may be a bumpy ride for a few weeks yet…
Consider subscribing so that you will be consistently informed, have 24/7 Email access to me with questions, and also get Gold, Silver, SP500 and Oil Trend Analysis on a regular basis. Subscribe now http://www.thegoldandoilguy.com/trade-money-emotions.php
Chris Vermeulen
http://www.thegoldandoilguy.com/wp-content/uploads/2014/11/tgaoglogo.png00adminhttp://www.thegoldandoilguy.com/wp-content/uploads/2014/11/tgaoglogo.pngadmin2011-08-17 23:18:042014-03-07 11:45:15Gold & Stocks Are About To Move in Opposite Directions Get Ready!
Today was another one of those great days for trading the spot gold price using the free intraday charts by Kitco. I’m not sure if anyone watches the free Kitco 24 Hour Spot Gold Price Chart, which is shown below, but I watch it like a hawk. It doesn’t take long to get a feel for how gold moves through out the 24hr day. Once you get a feel for it and see the same things happen every week opportunities start to pop up on the radar.
The Kitco Spot Gold Price Chart, which is provided for free, is an amazing tool for observing gold prices over a 3 day time frame. What I’m going to show you is how it can provide opportunities for daytrading the spot gold price or the Gold GLD ETF.
Free Spot Gold Price Chart – By Kitco
Spot Gold Price Chart
This chart may not look like a quality trading tool but it provides very detailed information for daytrading gold and for swing traders as they get ready to enter or exit a position at the open or close of the trading session. As you look at the chart above you will notice that the price movement each day is very similar even though the price of spot gold is different. Often enough the movements are very similar allowing us to take advantage of daytrading the spot gold price.
Spot Gold Price Chart – Close Up
Spot Gold Intraday Prices
This picture does not look like much but it is North America’s standard market trading times 9:30am – 4:00pm ET. You can see the price action following the previous day’s movements. Blue is the previous trading day and Green is Current Trading day. When I see big price movements in gold during these hours I like to take advantage of it the following day. If you didn’t notice the Green line (Today) makes the move before the previous days move. Why? Looks to me like there are a lot of other traders out there like me, getting ready for these opportunities in the spot gold price move before the previous day’s action. Today the market was 20-30 ahead of the previous moves, which happens and should be factored into your trading if you notice this.
Intraday Spot Gold Price Chart
Spot Gold Price Charts
This shows the last 4 spot gold prices using the GLD ETF. As you can see the last for days had the same price movement although today had a larger range to take more profits. This is a 5 minute spot gold chart using GLD. I trade using the 1 minute price chart, as it allows the best timing to enter and exit the positions and keep the 5 minutes chart, which you see above running, as well to keep my head clear for the time and potential price movement.
Today’s Spot Gold Trading Chart
Spot Gold Trading
Above is the chart I use for trading GLD and my actual trades. I am a very conservative trader and I like to lock in profits. Sometimes I get out a little too early but I generally catch the middle trending moves, which are the safest times to trade in my opinion. I could have held the trade longer today but spooked myself out of the trade because of over thinking. This is the exact reason why I use the 5 minute chart to keep my head on straight but sometimes it’s till not enough and I take profits early.
When there are no swing trading setups I focus on finding these intraday daytrading gold patterns. To see some of my spot gold price trading charts using GLD visit this link: http://www.thegoldandoilguy.com/tag/gold-spot-price/ .
My main focus for trading is swing trading gold ETFs. I wait for a trend reversal or continuation pattern which satisfies my trading model, enter the trade and then exit 50% of position on the first sign of weakness. And exit the second half of the position on a trend line break. My swing trading goal for GLD ETF is 2-5% per trade which would last 2-10 days unless price continues to run. I generally have 10-20 trades per year with the GLD gold ETF.
FREE WEEKLY SPOT GOLD PRICE TRADING CHARTS AND TIPS
GLD Gold ETF – Taking advantage of the gold market using the GLD exchange traded fund to generate consistent profits in any market condition.
As I mentioned before, the past 5 months have been very frustrating for most traders as we are stuck in this sideways price action. I also noted that August to December is generally the stronger months for gold. Although gold has been under selling pressure during the last 4 weeks I think there is light at the end of the tunnel. It’s usually the darkest before dawn, but there are some hurtles for gold to over come before we are in the clear which I explain below.
Chart 1 – The Gold Mining Stocks Index
This is a 10 year chart with a cup and handle pattern complete with a breakout. As you can see in the chart below gold mining stocks have continued to collapse below their support level. This does not mean gold is going to follow but it is a red flag which needs to be noted for future long entry points. Gold mining stocks in general are seen as volatile and high risk types of investments so I understand why investors are unloading their positions to lock in profits.
Gold Mining Stocks Index
Gold mining stocks are pushed below long term support level.
Chart 2 – Gold Stocks Index
This is an 8yr chart of the price action of gold stocks and you can see that they are currently testing long term support levels. If this monthly bar closes below this trend line then long term investors should be sitting in cash until we have a new opportunity to enter long or short. The HUI generally makes the move before the price of gold so I follow the HUI in all time frames.
Gold Stocks Index
The HUI is testing long term support.
Chart 3 – Performance Chart (Gold Stocks vs Price of Gold)
The past 2 years from 2006 to present gold stocks have slowly been underperforming the price of gold. This is generally not a good thing to see if we want higher prices for gold. But the good news is that gold stocks appear to be reaching levels at which new rallies have started.
Gold Stocks vs Gold Spot Price
Gold stocks under performing the price of gold but near support.
Chart 4 – Daily HUI Chart
I follow the HUI like a hawk as it fine tunes my entry and exit point for trading GLD, DGP and DZZ funds. Last month the HUI made a lower high and a lower low which is a red flag. While I don’t predict prices I am thinking these lower prices for gold stocks are just panic sellers over extending a sell off. I would really like to see an August rally kick into place.
HUI Gold Stocks Index
The HUI makes a lower high and lower low on the daily chart.
Chart 5 – GLD Gold ETF Chart
While gold stocks have been selling down, gold has so far been able to hold some ground. As you can see in the chart below the last three months gold has made higher highs, and higher lows. Currently gold is testing Major Support at the 200 EMA.
GLD Gold ETF Trading
Gold ETF GLD at long term support still holding its ground.
Conclusion:
My analysis of gold using the charts provided above shows that gold stocks and indexes are oversold and are at major support levels. Thus an August rally is not out of the picture and we could have some favorable setups in the near future. I would prefer higher prices, but in the end movement is movement and we can profit in either direction evenly.
GLD gold etf trading for me is the most accurate trading vehicle I have come across. I have been using my proven trading model which avoids the price gaps and keeps risk under 3% for each trade. GLD makes it simple to profit from the markets using a proven trading model for trading long and short term gold setups in all market conditions (bull, bear, and sideways).
My focus for short term trading is simple. Wait for a breakout which satisfies my trading model, enter the trade and then exit 50% of position on the first sign of weakness. Exit second half on a trend line break. My goal for GLD ETF is 2-5% and we are in trades for 2-10 days unless prices continue to run. I generally have 10-20 trades per year with gold.
Chris Vermeulen is Founder of the popular trading site TheGoldAndOilGuy.com. There he shares his highly successful, low-risk trading method. For 6 years Chris has been a leader in teaching others to skillfully trade in gold, oil, and silver in both bull and bear markets. Subscribers to his service depend on Chris’ uniquely consistent investment opportunities that carry exceptionally low risk and high return.
The Secular Bull Market in Gold Investments corresponds directly to the Secular Bear Market in Financials. We explain why this trend will continue and why a short-term buying opportunity in Gold presents itself.
Central Banks are in all sorts of a pickle.
With overwhelming evidence that the global economy is slumping badly:
* UK Retail Sales see Worst Slump in 20 Years
* Business confidence in Germany is at lowest level in 2 years
* New Zealand’s central bank cutting interest rates saying slowing economic growth will curb inflation.
* Japanese exports decreasing YoY, and imports climbing on record Oil prices.
* US unemployment at 4-year highs
The knee jerk reaction by central banks is to man the printing presses and hit the accelerator. And whilst this medicine has worked well over the last 25 years, Central Banks are now hitting a brick wall that they haven’t encountered since pre-Keynesian 1930s.
Freshly minted fiat currency is falling into the hands of a crippled banking sector with little capital, ability or desire to carry out the multiplier effect and make loans to real people in the real economy. In a debt laden global economy with no reverse gear this headwind is possibly the biggest threat the Federal Reserve and its ilk aka the establishment have ever faced in carrying out monetary policy
Point #1 – Gold investors are well aware of the risks inherent in the current financial system.
The beauty of capitalism and the associated free movement of capital is that smaller more focused entities aka Hedge & Private Equity funds can and are rapidly moving into long held banking preserves.
* Direct lending to mid and small cap entities is now a well worn hedge fund territory.
* Extracting value through Shareholder activism.
* A much larger pool of capital available for short selling.
* Private Equity funds increase investment time horizons.
Highly secretive and operating out of non-transparent domiciles these entities are by and large out of the reach of the central banking system.
Point #2 – Hedge Funds and Private Equity Funds do not benefit from Fed handouts and would be better served by a currency that acts as a stable store of wealth – Gold !
The transfer of the financial system is akin to the explosion of information on the internet. The players that used to have a monopoly on information become less effective. There will be winners and there will be losers. But right now a bet on Gold Investments like Gold Stocks and Gold ETFs is a bet against the Establishment and the out-dated mega-banking system.
Slower growth will continue to cause problems for financials as bad debts soar, and as a result Gold investments will continue to propel higher in its multi-year Secular trend.
The above trend stretched too far technically over the last 3-months and there has had a rapid reversal over the last 2 weeks. This is a technical pullback only and the above fundamentals have not changed. There’s more to come in this fundamental story and Gold investments (we use GLD gold Exchange Traded Fund) and we could be getting close to another buying point for gold soon
Gold Chart For Investments
Gold Investment GLD – $85 is strong support as a confluence of lateral support (green) and the 50-week Moving Average converge. Its just a matter of time before we have another entry point to add to our positions and or make another profitable gold investment.
By Chris Vermeulen
chris (AT) thegoldandoilguy.com
Chris Vermeulen is Founder of the popular trading site TheGoldAndOilGuy.com. There he shares his highly successful, low-risk trading method. For 6 years Chris has been a leader in teaching others to skillfully trade in gold, oil, and silver in both bull and bear markets. Subscribers to his service depend on Chris’ uniquely consistent investment opportunities that carry exceptionally low risk and high return.
This article is intended solely for information purposes. The opinions are those of the author only. Please conduct further research and consult your financial advisor before making any investment/trading decision. No responsibility can be accepted for losses that may result as a consequence of trading on the basis of this analysis.
http://www.thegoldandoilguy.com/wp-content/uploads/2014/11/tgaoglogo.png00adminhttp://www.thegoldandoilguy.com/wp-content/uploads/2014/11/tgaoglogo.pngadmin2008-08-04 12:03:092014-03-10 09:43:15Gold Investment Fundamentals and the Transfer of Capital