Moe and I had a great call today as we both get into some details on the markets. Moe is a 40-year veteran of the markets and we see the markets in a similar way. We talk about how to trade, have a listen and our conversation starts at the 23minute mark if you want to fast track things.
If you want to improve your accuracy and opportunities for success, then we urge you to visit www.TheTechnicalTraders.com to learn how you can enjoy our research and our members-only trading triggers (see the first chart in this article). If you are managing your retirement account or 401k, then we urge you to visit www.TheTechnicalInvestor.com to learn how to protect your assets and grow your wealth using our proprietary longer-term modeling systems. Our goal is to help you find and create success – not to confuse you.
In closing, we would like to suggest that the next 5+ years are going to be incredible opportunities for skilled traders. Remember, we’ve already mapped out price trends 10+ years into the future that we expect based on our advanced predictive modeling tools. If our analysis is correct, skilled traders will be able to make a small fortune trading these trends and Metals will skyrocket. The only way you’ll know which trades to take or not is to become a member.
Chris Vermeulen
Chief Market Strategist
Founder of Technical Traders Ltd.
https://thegoldandoilguy.com/wp-content/uploads/2020/05/MarketWrap.png149336adminhttp://www.thegoldandoilguy.com/wp-content/uploads/2014/11/tgaoglogo.pngadmin2020-05-08 15:35:222020-05-08 15:35:22A Technical Look at the Markets with Analyst Moe Ansari & Chris Vermeulen
Both Gold and Silver Futures have been struggling to rally above recent high levels since the start of the global stock market collapse related to the COVID-19 virus event. Yet, the Junior Gold Miners appear to be telling us the Precious Metals market is boiling hot.
Gold, the bell-weather safe-haven asset, initially collapsed when the US stock market started the massive selloff in late February 2020, then recovered to higher price levels near $1785 recently. Since reaching these levels, Gold has stalled into a sideways price flag near major resistance.
Silver, on the other hand, is trading near $15.60 and has yet to really recover to anywhere near the levels it had achieved in early January 2020 (near $18.60).
Well, GDXJ, the Junior Gold Miners ETF, is suggesting a very strong price rally is taking place that may push both Gold and Silver substantially higher. Key resistance exists near $46.50. Once broken we believe a very strong price rally will take place pushing GDXJ price levels to $51 or $52. After that, a brief downside rotation will potentially retest the $47 to $48 levels before an even bigger upside rally takes place. What is even more important is that we believe this big breakout move could start as early as next week, May 12th or after.
This GDXJ Weekly chart highlights the same price pattern and shows why we believe the upside price breakout could be a massive new trend. The Deep price low setup because of the COVID-19 virus event creates a very big price range for any future price advancements. That $24 price range, if applied to price levels before the breakdown event near $41, may suggest GDXJ could rally to levels above $65 over the next few weeks or months.
GDXJ WEEKLY CHART
CONCLUDING THOUGHTS:
We believe the upside rally in both Gold and Silver recently is a very good indication that the sideways price channel that has plagued precious metals recently may be ending. If precious metals prices begin to rally, then GDXJ will break the upper $46.50 resistance level and begin a new upside price rally clearing the resistance setup before the virus event began.
Get ready, this could be a very big move higher for Junior Miners and it could align with our May 8th through May 12th global market inflection point prediction.
If you are using our free public research for your own trading decision-making and/or using it as an opportunity to find and execute successful trades, please remember you are the one ultimately making the decisions to trade based on our interpretation and free research posts. We, as technical traders, will continue to post new research articles and content that we believe is relevant to the current market setups.
If you want to improve your accuracy and opportunities for success, then we urge you to visit www.TheTechnicalTraders.com to learn how you can enjoy our research and our members-only trading triggers (see the first chart in this article). If you are managing your retirement account or 401k, then we urge you to visit www.TheTechnicalInvestor.com to learn how to protect your assets and grow your wealth using our proprietary longer-term modeling systems. Our goal is to help you find and create success – not to confuse you.
Our researchers will generate free research on just about any topic that interests them. As technical traders, we follow price, predict future price moves, tops, bottoms, and trends, and attempt to highlight incredible setups that exist on the charts. What you do with it is up to you. Visit www.TheTechnicalTraders.com/FreeResearch/ to review all of our detailed free research posts.
In closing, we would like to suggest that the next 5+ years are going to be incredible opportunities for skilled traders. Remember, we’ve already mapped out price trends 10+ years into the future that we expect based on our advanced predictive modeling tools. If our analysis is correct, skilled traders will be able to make a small fortune trading these trends and Metals will skyrocket. The only way you’ll know which trades to take or not is to become a member.
Chris Vermeulen
Chief Market Strategist
Founder of Technical Traders Ltd.
https://thegoldandoilguy.com/wp-content/uploads/2020/05/12.png574850adminhttp://www.thegoldandoilguy.com/wp-content/uploads/2014/11/tgaoglogo.pngadmin2020-05-08 08:21:152020-05-08 08:21:15Junior Gold Miners Ready To Run
These are crazy times and if you’re attempting to make some fiat via trading, you need all the help you can get. To that end, it was great to get acquainted today with Craig Hemke of TF Metals Report.
If you’re not familiar with Craig’s work and his service, you can find all that you need to know by visiting his website: TFMetalsReport.com
Over the course of this call, Craig and I discuss:
Methods and strategies for identifying trading opportunities
The discipline applied in finding a trade, sticking with it or taking profits
The current “Best Asset Now” and why
But there’s a whole lot in between, too, so please take time to give this podcast a thorough listen. You’re certain to learn something new.
Many thanks to Craig for sharing his valuable time today.
As a technical analyst and trader since 1997, I have been through a few bull/bear market cycles in stocks and commodities. I believe I have a good pulse on the market and timing key turning points for investing and short-term swing traders. 2020 is an incredible year for traders and investors. Don’t miss all the incredible trends and trade setups.
Subscribers of my Active ETF Swing Trading Newsletter had our trading accounts close at a new high watermark. We not only exited the equities market as it started to roll over in February, but we profited from the sell-off in a very controlled way with TLT bonds for a 20% gain. This week we closed out SPY ETF trade taking advantage of this bounce and entered a new trade with our account is at another all-time high value.
Ride my coattails as I navigate these financial markets and build wealth while others watch most of their retirement funds drop 35-65% during the rest of this financial crisis going into late 2020 and early 2021.
Just think of this for a minute. While most of us have active trading accounts, what is even more important are our long-term investment and retirement accounts. Why? Because they are, in most cases, our largest store of wealth other than our homes, and if they are not protected during the next bear market, you could lose 25-50% or more of your net worth. The good news is we can preserve and even grow our long term capital when things get ugly like they are now and ill show you how and one of the best trades is one your financial advisor will never let you do because they do not make money from the trade/position.
If you have any type of retirement account and are looking for signals when to own equities, bonds, or cash, be sure to become a member of my Passive Long-Term ETF Investing Signals which we issued a new signal for subscribers.
Chris Vermeulen
Chief Market Strategies
Founder of Technical Traders Ltd.
https://thegoldandoilguy.com/wp-content/uploads/2020/05/TFmetals.png284424adminhttp://www.thegoldandoilguy.com/wp-content/uploads/2014/11/tgaoglogo.pngadmin2020-05-07 07:11:122020-05-07 07:11:12Craig Hemke from TFMetalsReport.com and Chris Talk Metals & Markets
Cory Fleck from the Korelin Economics Report and Chris Vermeulen talked and provided some thoughts on the precious metals markets. The stocks are continuing to lead the sector and GDX is adding to the breakout. But not all precious metals sectors and stocks are in bull markets right now. We outline what’s still lagging. Also some comments on a Natural Gas trade at the end.
Overall, this has been an excellent trade. We got our members into this trade fairly early and are already pulling profits and trailing stops. It certainly helps to have the modeling systems and seasonal analysis tools we use to find these setups for our members – but you can do it too. All it takes is a bit of skill and understanding of how certain markets operate within seasonal trends and setups. Otherwise, if you don’t have the time to research every chart we can do it all for you and just send you the trades we are taking.
As a technical analyst and trader since 1997, I have been through a few bull/bear market cycles in stocks and commodities. I believe I have a good pulse on the market and timing key turning points for investing and short-term swing traders. 2020 is an incredible year for traders and investors. Don’t miss all the incredible trends and trade setups.
Subscribers of my Active ETF Swing Trading Newsletter had our trading accounts close at a new high watermark. We not only exited the equities market as it started to roll over in February, but we profited from the sell-off in a very controlled way with TLT bonds for a 20% gain. This week we closed out SPY ETF trade taking advantage of this bounce and entered a new trade with our account is at another all-time high value.
Ride my coattails as I navigate these financial markets and build wealth while others watch most of their retirement funds drop 35-65% during the rest of this financial crisis going into late 2020 and early 2021.
Just think of this for a minute. While most of us have active trading accounts, what is even more important are our long-term investment and retirement accounts. Why? Because they are, in most cases, our largest store of wealth other than our homes, and if they are not protected during the next bear market, you could lose 25-50% or more of your net worth. The good news is we can preserve and even grow our long term capital when things get ugly like they are now and ill show you how and one of the best trades is one your financial advisor will never let you do because they do not make money from the trade/position.
If you have any type of retirement account and are looking for signals when to own equities, bonds, or cash, be sure to become a member of my Passive Long-Term ETF Investing Signals which we issued a new signal for subscribers.
Chris Vermeulen
Chief Market Strategies
Founder of Technical Traders Ltd.
https://thegoldandoilguy.com/wp-content/uploads/2020/05/Chris-and-Korelin.png220266adminhttp://www.thegoldandoilguy.com/wp-content/uploads/2014/11/tgaoglogo.pngadmin2020-05-06 10:57:502020-05-06 10:57:50When It Comes To Precious Metals Markets, What’s In A Bull Market And What’s Not
Our recent research suggests the US stock market may be entering a period of volatility that may include a broad market rotation/reversion event. We believe this volatility event could begin to happen anytime over the next 10 to 30+ days. The rally in the US stock market ending 2019 and carrying into 2020 appears to be setting up a “rally to a peak” type of price pattern. Please take a minute to review the following articles we’ve posted recently about this topic and how it relates to opportunities in Metals/Miners.
The potential for a volatility spike resulting from a price peak formation (see the January 20, 2020 article above), could setup a moderately broad downside price reversion event that may prompt a 5% to 8%+ downside price correction. If that happens, as we expect, over the next 5 to 10+ trading days, then precious metals and miners should explode to the upside as a “risk-on” trade moves capital into the metals market.
We believe the Miners (both Gold and Silver) are setting up for an explosive upside price move over the next 60+ days. The reality of the global markets is that it appears to be setting up in a very similar manner to what happened in the late 1990s. The rally in Rhodium, Palladium and Platinum are similar to the rally that took place in the late 1990s – just before the real explosion in Gold and Silver began in 2003-04. The rally in Gold and Silver took place after a collapse event in 2000-2001 and setup a massive upside price event for Precious Metals and Miners. You can read more of our research below.
If we start with the shortest time frame analysis of the gold miners you can see a lot of measured moves based on technical analysis that has taken place in the last month of trading and it’s not far from over based on this chart.
DAILY GDXJ CHART
The setup in GDXJ is that Junior Gold Miners should move 15% to 25% higher over the next 30+ days on a price reversion event in the US stock market. We believe the upside target for GDXJ is $46 to $51 from the current levels near $41.50. After a brief pause near $50, GDXJ should attempt another rally to levels above $65 to $70 sometime near June~August 2020.
WEEKLY GDXJ CHART
This Weekly GDXJ chart highlights what we believe will happen over the next 6+ months. The opportunity for skilled traders at this level is incredible. Support near $35.50 has recently been retested and held. Any entry below the $40 level is an incredible opportunity to catch this upside price move.
CONCLUDING THOUGHTS:
We believe the US stock market will enter a period of volatility over the next 30~60+ days and that volatility will push metals and miners higher into this next wave of advancement. Be prepared for Silver and Silver Miners to rally more than Gold/Gold Miners (potentially). We’ve highlighted how Silver tends to rally a few months behind Gold when a Risk-On trade sets up.
As a technical analysis and trader since 1997 I have been through a few bull/bear market cycles, I have a good pulse on the market and timing key turning points for both short-term swing trading and long-term investment capital. The opportunities are massive/life-changing if handled properly.
2020 is going to be full of incredible trading opportunities for skilled traders. We’ve already set up a number of active trading triggers for our members to profit from the early moves in 2020. This Gold Miners trade is an incredible opportunity for anyone skilled enough to take advantage of it. Visit Technical Traders Ltd. to learn how we can help you find and execute better trades in 2020.
Join my Wealth Building Newsletter if you like what you read here and ride my coattails as I navigate these financial markets and build wealth while others lose nearly everything they own.
https://thegoldandoilguy.com/wp-content/uploads/2020/01/110.jpg6171024adminhttp://www.thegoldandoilguy.com/wp-content/uploads/2014/11/tgaoglogo.pngadmin2020-01-21 16:21:082020-01-21 16:21:08Junior Gold Miners Setting Up For Another Rally
I have just posted our most current trend charts for the stock market and gold miners. As you know money generally rotates between risk-on (stock market) to risk-off (metals, bonds) so it’s important to know when you should shift your money from one asset class to the next. These trends and swing trade charts which will update daily on our website are second to none (in my opinion), and they are only getting better with time.
GDXJ GOLD MINERS TEND & SIGNALS – SEPT 30
2019 has been a good year for those buying and holding GDXJ which is up 19% year to date, but with these signals for ur entry and exit points in the precious metals sector we are up over 42% alone just for the precious metals plays alone this year.
S&P 500 INDEX TREND & TRADE SIGNALS – SEPT 30
My ETF trading newsletter (Wealth Building Newsletter) is the best of all worlds in terms of analysis, forecasts, swing trades, and trend signals. Think of this Wealth Building Newsletter as a combination of VantagePoints market price prediction software allowing you to know what to expect today/tomorrow ($10,000+ value), PLUS the power of having trend and trade signals similar to VectorVest premium with real-time alerts ($1500 value). The best part is you get all this delivered each morning in one email, and a short 8 minute video telling you JUST what you need to know to profit from the next market move. No FluffNo Software to Install or LearnNo More Information Overload – Analysis Paralysis Get my special service limited time offer for only $62 a month when you join our 2yr subscription plan.
By subscribing now, you will save hundreds of dollar a year, plus you get a free gold bar shipped to you. If you wait, its going to cost you more.
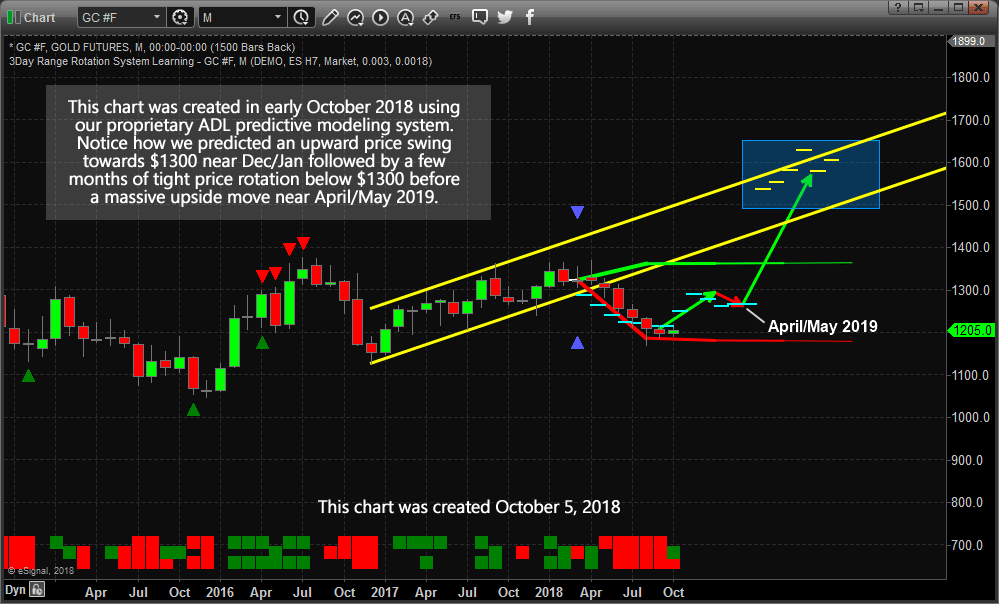
We’ve been trying to alert all of our followers of the setup in precious metals for well over 6 months. Here is our research post from February 6, 2019 (nearly 4 months ago) that highlights our prediction of an April 21~24 momentum base and our earlier calls predicting a move above $1300, then a stall and move lower towards the base in April, then the next leg higher.
One question that gold investors are asking now is, will 2017 be as spectacular for the yellow metal as it was in 2016? The short and sweet answer to this is YES.
The dollar, gold and the major U.S. stock exchanges will all see new highs. Gold is currently in a “complex corrective correction” while experiencing its’ last pullback, beforehand.
Both the short-term outlook and the long-term outlook for gold is BULLISH! Trumps’ victory win is a positive for gold bulls. Policy uncertainty and slowing growth, following a Trump win, will stoke the yellow metals’ price in 2017.
Gold prices have been under pressure since the Trump victory, but the long-term scenario for gold is that it is parabolic. The global economy is still in contraction. Global Center Bankers continue with monetary easing, leading to currency debasement. Interest rates continue to slide into negative territory in Europe and Asia. Gold’s investment appeal will encounter a period of time before it generates positive yields. Gold, as an investment, will once again be back in vogue. As prices rally, investment demand will only rise further, taking everyone by surprise.
The demand for gold jewelry has been declining within the large gold-consuming nations. The gold investors will call the shots in this new ‘bull’ market of gold. Current supply constraint has cushioned gold prices from the rally in the U. S. dollar.
This is the last great buying opportunity for gold before it makes its’ next historic run in 2017 and beyond.
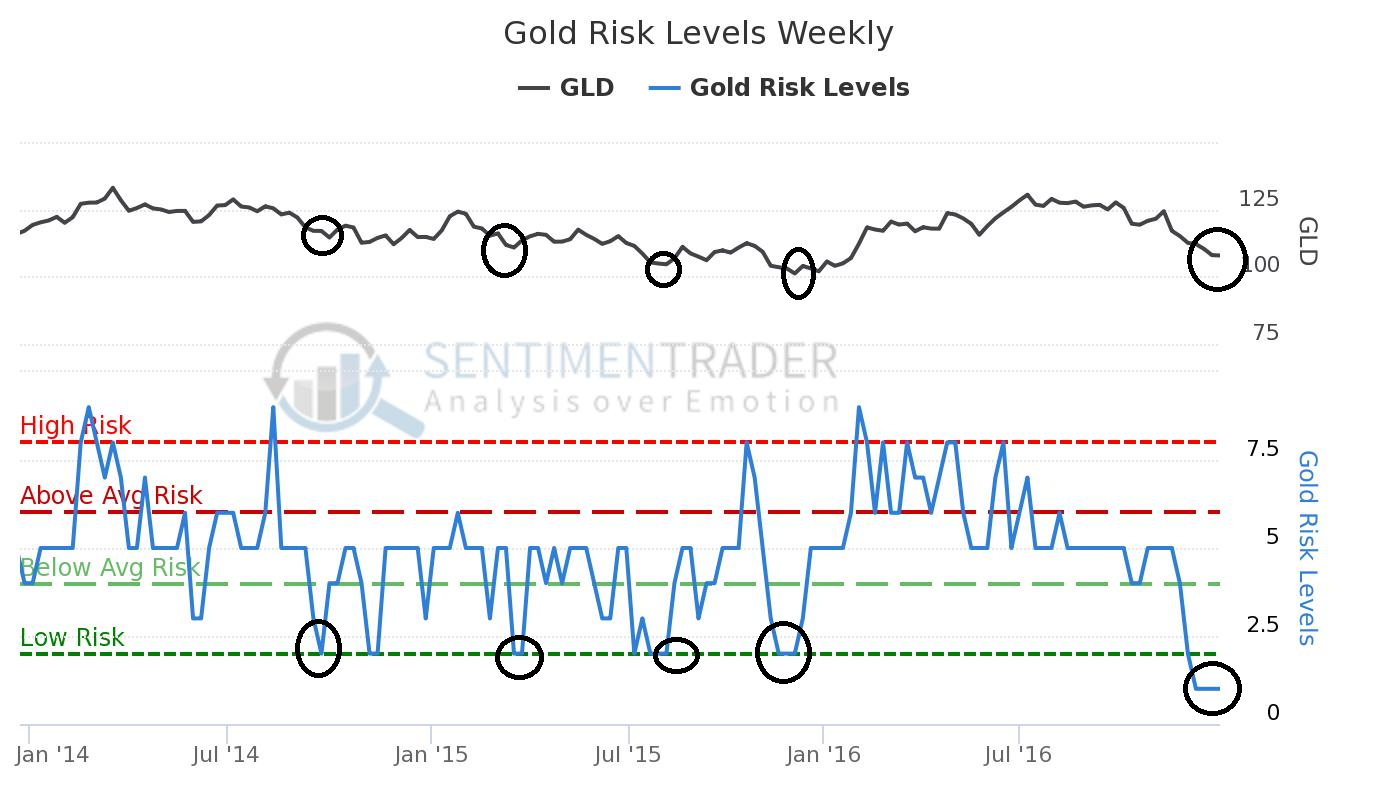
Excessive Pessimism: 2.0
THIS IS WHEN THE BEST OPPORTUNITY TO BUY GOLD IS PRESENTED
Latest Value(s):
– Last Reading: 1.0
– Extreme Values:
– Excessive Optimism: 8.0
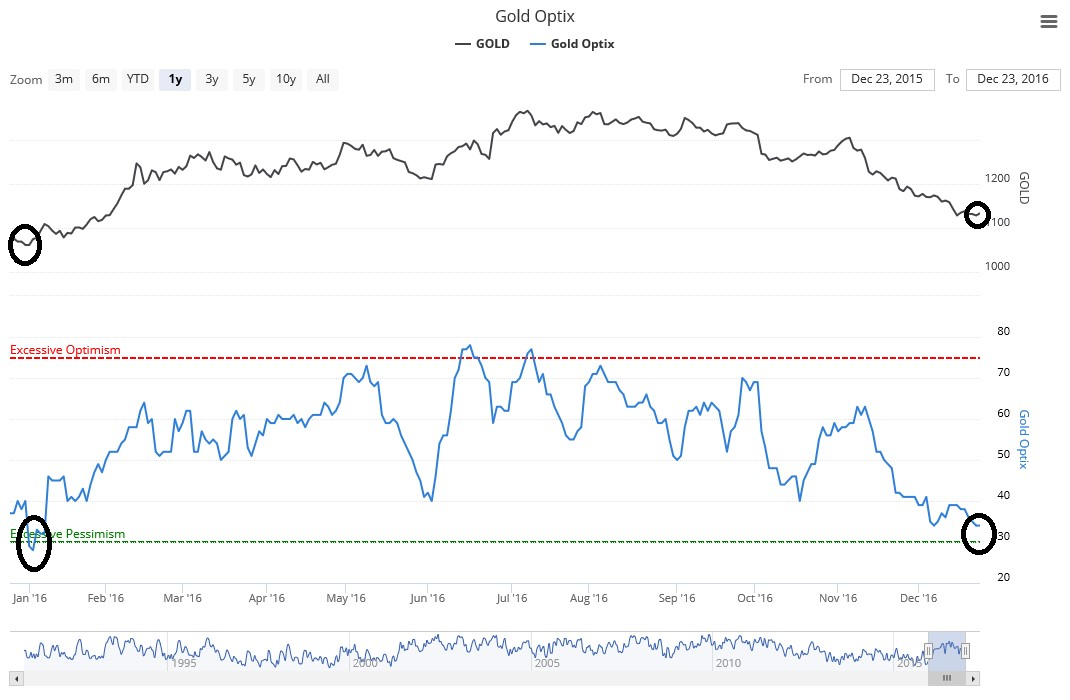
Excessive Pessimism: 30:
THIS IS WHEN THE BEST OPPORTUNITY TO BUY GOLD IS PRESENTED
Latest Value(s):
– Last Reading: 34.0
– Extreme Values:
– Excessive Optimism: 75.0
– Excessive Pessimism: 30.0
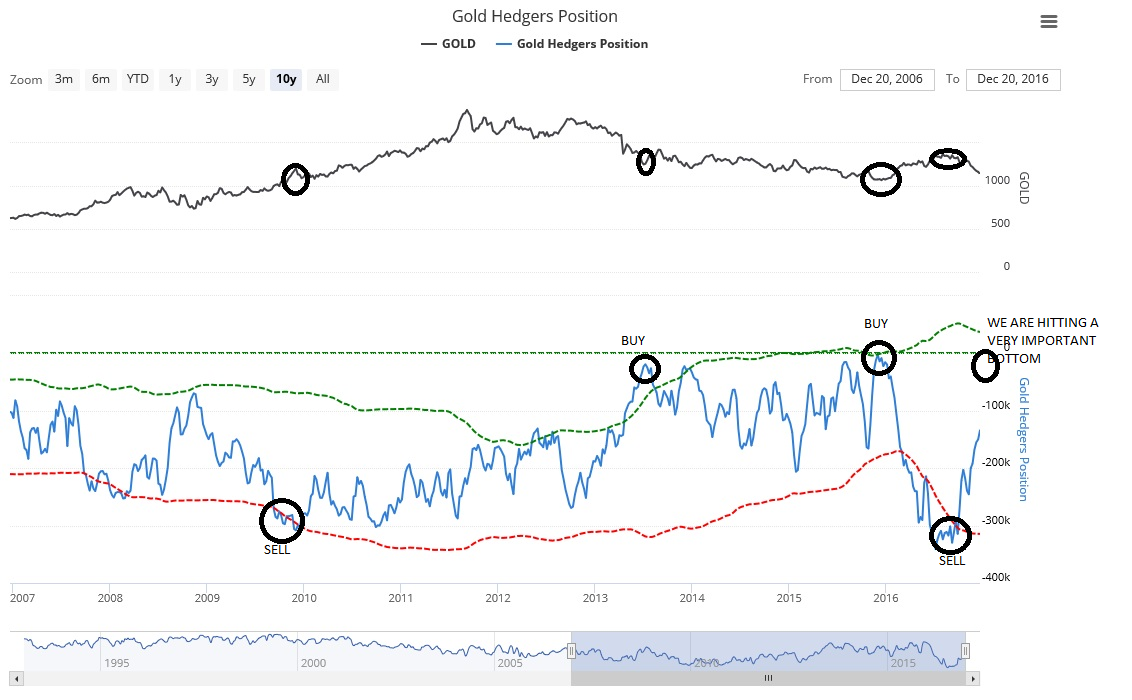
Gold Hedgers Positions
Latest Value(s):
– Last Reading: -134022.0
Extreme Values:
The green dotted line is 1 standard deviation above the 3-year average;
the red dotted line is 1 standard deviation below the 3-year average.
The Drivers!
A key factor that has driven investments in gold is the negative interest rate in Europe, Japan, Denmark, Sweden, and Switzerland. The sovereign debt of approximately one third of the developed countries traded with a negative yield while an additional 40% of the countries had yields below 1%.
Gold prices will be driven more by its’ value as an ‘investment asset class’. Gold will supersede investments in other ‘asset classes’ such as equity and bonds in due time.
The massive U.S. debt continues to spiral out of control. The Treasury Department’s printing presses are cranking out hundreds of billions of dollars in new money. European countries are imploding financially and the entire European Union is at risk of a collapse. These ‘geopolitical’ factors will be driving the demand for gold as a ‘safe haven”.
The global ‘retail’ investment market is well positioned for growth what with demand for gold in China, India, Germany and the U.S. for 2017.
Social media is a ‘key driver’ which is critical in both China and India. Financial advisors and financial websites are the key drivers in the U.S. markets. In Germany, banks play the most important influence; ‘Protect wealth against the system’. It has a competitive advantage compared to other investment options.
Jordan Eliseo, Chief Economist at precious-metals dealer ABC Bullion, says “Gold retreated about 18 percent from its year-to-date high. Afterward, it gained 26 percent in the first half of 2016. The decline so far, this year has been about 15 percent from its year-to-date high. Gold, is setting up for another rally in fashion like last year. The recent correction has already drawing in some investors to buy what they see as cheap metal.”
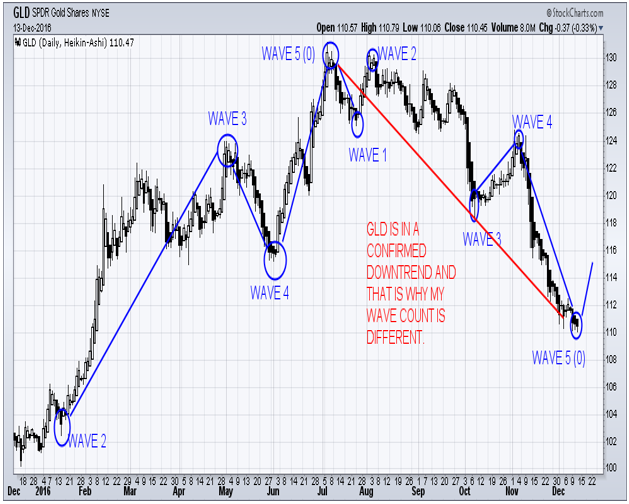
On December 14th my trading partner accurately forecasted the recent bottom in gold which you can see in this gold market forecast.
December 14th Forecast chart:
He then took things a step further and entered into a NUGT (3x long gold miners ETF) with subscribers and recently locked in 50% profit on the first half and is up over 70% on the balance as of Fridays closing price.
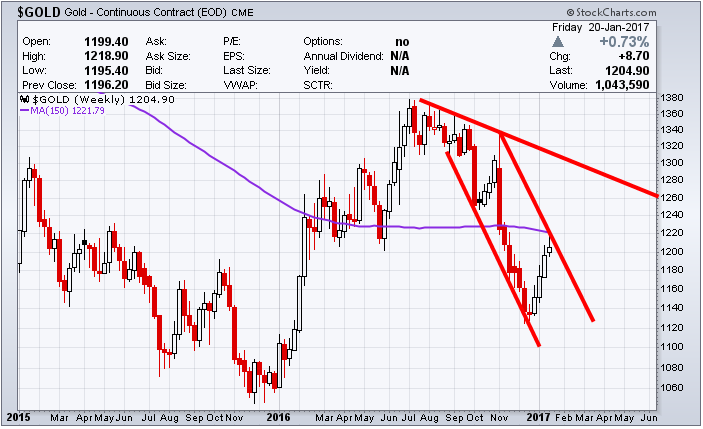
GOLD WEEKLY CHART REMAINS IN DOWNTREND
The constructing on this new infrastructure is going to require a lot of new money. The country is already close to $20 trillion in debt, so if the administration plans to make this one of their priorities, it is going to have to print it.
‘THE GREAT RESET’
Nixon closed the gold window on August 15th, 1971 and consequently, the world entered a new era. For the first time in history, all the world’s monies were unbacked fiat currencies, adrift on a sea of floating exchange rates. This stopped the redemption of currency for gold. Today, gold reserves are nothing more than an asset listed on the FEDS’ balance sheet. Gold had stopped being an integral part of our financial monetary system
At the top of international commerce, money managers had always known the dangers of ‘currency risk’, but now every currency has become a ‘soft currency’. Recognition of ‘currency risk’ seeped down into the knowledge chain, but on the street of personal financial management, despite it being 45 years later, not many have caught on to the concept.
To Live And/Or Continue Living the American Dream
Golds’ strength is in the role of ‘wealth protection’. It is a ‘safehaven’ and its ‘independence’ from the global financial system makes it a great investment for the future. Gold is still good value for those who do not own any to accumulate ounces.
In a few days, I will be publishing a piece talking about the shift in the economy and what I call “The Great Transfer of Wealth”. Be sure to join my free newsletter below to receive this special report!
https://thegoldandoilguy.com/wp-content/uploads/2016/08/goldimage.jpg500900adminhttp://www.thegoldandoilguy.com/wp-content/uploads/2014/11/tgaoglogo.pngadmin2017-01-21 08:13:472017-01-21 08:22:02The New Gold Rush Of 2017!
Silver and silver mining stocks are front and center for investors and active traders. Because of silvers high volatility (large price swings) it naturally attracts a lot of attention.
First you have seasoned investors who are waiting for the right opportunity to get long or short for the next move. Then you have the active traders playing the day to day price swings. Finally you get the gamblers who are salivating over the potential to double their accounts and are riding the commodity on pure emotions (Fear & Greed). All these things compound the volatility for the investment making it headline news and what everyone wants to be involved in.
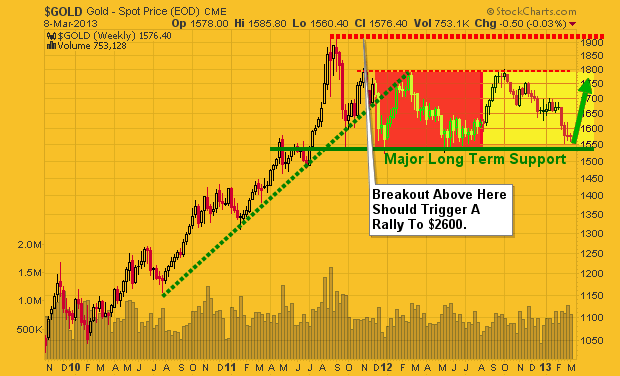
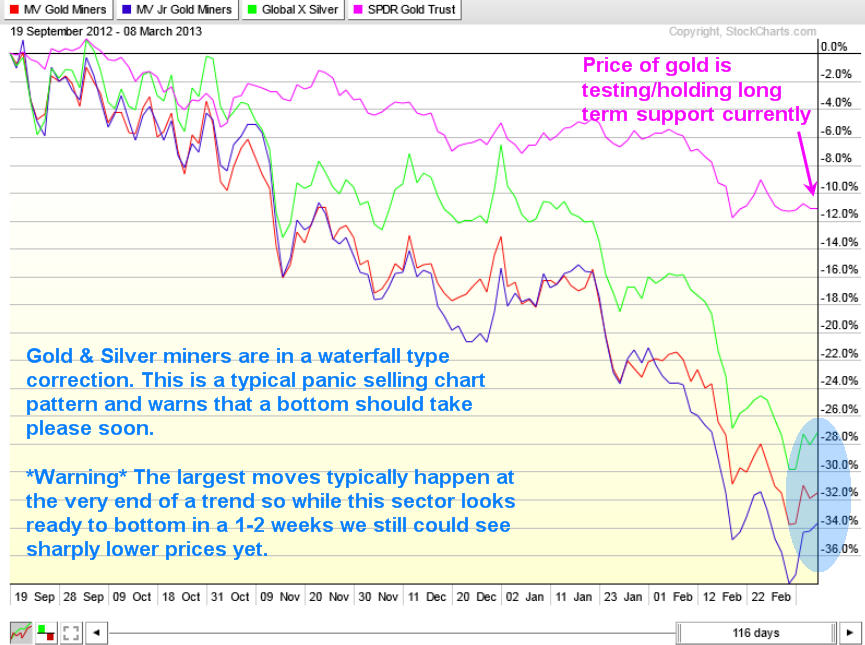
The focus of this report is show you where the price of gold, silver and miner stocks are currently trading and what to lookout for in the coming days/weeks. Below is a chart of gold but silver has a similar pattern and will follow or should I say lead the price of gold in percentage terms because of its volatility.
Gold Weekly Chart:
Gold has been testing its long term support level for three weeks. I expect we see price start to move quickly sooner than later but there is potential for it to tread water here until the second half of April. We all know the saying “Sell in May and Go Away” and as we get closer to that date we should start to see money flow into the “Safe Havens” being gold, silver, and miners. While this has not happened many times on the charts I am thinking beyond them and of what the masses are likely to flock to when stocks lose their luster.
Also if you have been following the price of the dollar index you know that its getting a little overbought and when it starts to correct the falling dollar should help send precious metals higher.
Gold & Silver Miners VS Gold Bullion Performance:
The stock market has certain chart patterns that tell chart readers what the holders of that particular investment is feeling emotionally. Knowing how to read these extreme patterns can yield some big gains and works for most investments types (stocks, bonds, commodities and currencies).
Without getting into the boring technical details precious metal stocks are starting show signs of panic selling which typically happens before a major bottom is put in place. A bottom generally takes a week or two for some type of bottoming pattern or base building to form. This is the most volatile time to be trading these investments so trade with caution.
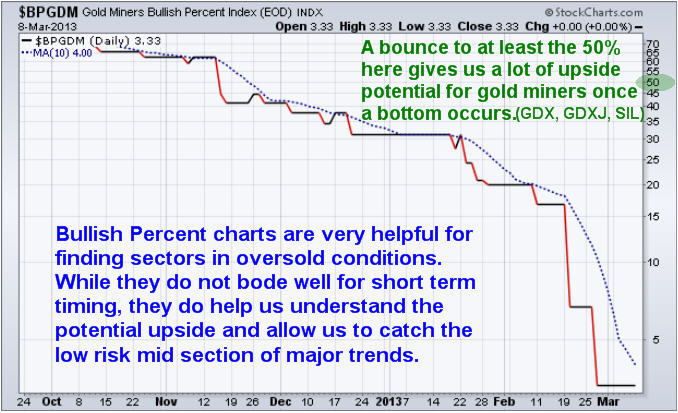
Gold Miners Bullish Percent Index:
Bullish percent indexes are a great way to see how popular an investment is. If you do not know what a bullish percent chart is then you can look it up online and learn more. The way I read it is when it’s up over 75-80 it’s a popular investment and everyone is buying it. It also means it’s in a major uptrend. But you must be aware that when everyone is buying something once price starts to turn down you better be one of the first few out the door before everyone else runs for the door and price crashes.
It’s similar but reversed for investments that are below 20. Everyone is selling, no one wants to own it but once the selling momentum stops price should rebound and rally. Keep in mind this indicator is not great for timing, but confirms that what you are looking at is either oversold, neutral or overbought in the BIG picture.
Weekend Precious Metals Trading Conclusion:
In short, I still like gold, silver, and their related mining stocks. I am watching them very closely for signs of a bottom and will be jumping on that train when the selling momentum looks to have stalled. Keep in mind that all these investments are still in a VERY STRONG DOWN TREND and trying to catch a falling knife is not what I do. Waiting for momentum to shift is my focus as there should be big upside if metals and stocks can find a bottom soon. If gold breaks down below key support as posted on the weekly chart then the uptrend may be over and it will be time to start looking for short positions.
http://www.thegoldandoilguy.com/wp-content/uploads/2014/11/tgaoglogo.png00adminhttp://www.thegoldandoilguy.com/wp-content/uploads/2014/11/tgaoglogo.pngadmin2013-03-10 21:54:052014-03-06 11:51:03Silver Miners, Gold Miners and the Price Of Gold