As our research team continues to pour over the charts and look for any signs of direction regarding tomorrow’s Fed news, we put together a couple the charts that may highlight some expectations and in at what the markets may do the rest of the week.
The expectations that the US Federal Reserve may maintain rates at current levels or potentially drop rates by a quarter percent leaves an open interpretation as to how the global markets will digest this news. Obviously, leaving rates unchanged would be the most benign action the Fed could take. Often though, the markets interpret this as a sign of weakness. Whereas a quarter percent decrease in the US fed rates would suggest that the Fed is preparing for future economic weakness in the US and potential global economy, yet investors may consider this as a very bullish reaction to the Fed.
Our belief is that the Fed will leave rates unchanged and possibly hint at adjusting rates lower later this year or early next year in preparation for the US presidential elections. The US economy is still moderately strong and the recent trade deal with Mexico as well as policy advancement in DC leads us to believe the Fed has no reason to adjust rates right now. Of course, a quarter percent decrease would allow the Fed to spur additional economic growth and potentially jump-start the waning housing market in the US.
This first chart of the YM, the Dow E-mini futures, highlights key price technical support and resistance that will likely come into play over the next 3 to 10 weeks. We ask you to pay special attention to the dual resistance levels above 26,500. These double resistance levels act as a double ceiling in regards to price advancement. In other words, some type of strong price advance of 27,000 would have to take place in order for the price to move beyond these resistance areas.
Should the Fed surprised the market and the market interpreted this move as strongly bullish, there is a moderate chance that the YM could advance beyond 27,000 before the end of this week or early next week. We believe the Fed news tomorrow will be interpreted as a protectionist stance and the market made move lower from current highs. Any big rotation lower after the Fed announcement tomorrow could prompt a new downside trend to retest our pennant/flag formation base near 25,000. Either way, our automated technical analysis prediction software will keep or get on the right side of the market.
Additionally, after the Fed announcement tomorrow, it is very likely that the US dollar may, under some pricing pressure and that precious metals could rocket hire and continue their advance towards $1450. Any market reaction to the downside in the US stock market and/or the US dollar would likely push precious metals well above recent highs. It all depends on how the market reacts to the US Fed announcement tomorrow, June 19.
We believe we have positioned our gold trades appropriately for the Fed news tomorrow. Either way, we believe gold, precious metals, and the miners will advance after the Fed news tomorrow. A close above $1375 in gold will prompt a very quick rallied towards $1440.
We’ll continue to watch how the markets react to the Fed news tomorrow with the knowledge that precious metals and gold should advance either way as fear and greed drive the metals higher. We’ll look for new trades near the end of next week after the Fed news shakes out the short term traders. There is nothing wrong with being on the right side of a profitable trade in precious metals and miners.
If you want to trade profitably with us and fellow traders from in 87 other countries be sure to join our Wealth Building Newsletters Today!
Chris Vermeulen
www.TheTechnicalTraders.com
https://thegoldandoilguy.com/wp-content/uploads/2019/06/20-1.png340691adminhttp://www.thegoldandoilguy.com/wp-content/uploads/2014/11/tgaoglogo.pngadmin2019-06-18 18:28:482019-06-18 18:28:48Fed May Trigger Wild Swing In Index and Metals
The continued upside price move in Gold is a very clear sign that fear is starting to enter the global markets again. We read an article last night that suggested many professional fund managers are preparing for a bigger downside price move as well as expecting the US Fed to potentially decreased interest rates over the next 12 to 24 months as the expected downside price move takes place. We understand this concern by many industry professionals and share some of their same concerns, yet we believe these individual are far too early in shifting their stance in the markets right now.
As you may be aware, our research does not show any major downside risks until later in July 2019 or August 2019. Even then, the price of the Dow Jones Index would have to fall over 18% before the December 2018 lows become threatened. The current upside price recovery, with the Dow Jones up over 400 pts from the lows on Monday, June 3, suggests the US market and the Capital Shift that has been taking place over the past 24+ months is still rather strong with investor buying dips. We told our followers this bounce was about to happen the day before it bottomed here.
It seems that everyone is trying to pick a top or call the big crash right now. Back in November 2018, it seemed like every professional trader we knew was advising their client “This is the BIG ONE” and suggesting the US markets could never recover from a deep sell-off like the one we experienced in late 2018. Yet, here we are, after reaching near all-time highs again, rotating a bit lower and the same voices seem to be stating “This is the BIG ONE” again.
Allow us to help clear up what is likely to happen based on our research and proprietary modeling tools.
This first chart of the VIX (Volatility Index) shows what we believe to be the most likely outcome over the next 30+ days. After a spike in the VIX in early may which our followers profited over 25% in a few days, we believe a downward pricing channel will set up where the VIX will continue to drift lower – eventually settling back below 14 again for another setup. It is very likely that this volatility consolidation coincides with a US stock market price recovery over the same span of time. We’ll get into more detail in the following charts.
Eventually, sometime in mid-July or mid-August, we expect the VIX to spike well above 20 to 22 as a broader US stock market price collapse takes place.
Throughout our expectations, we expect the US Dollar to enter a similar type of price pattern – setting up a Pennant formation after a moderately deep price correction nearing the $95 level. We believe the US Dollar will continue to move lower, driving precious metals higher, where the $95 support level is the key target. Once this level is reached, we believe the US Dollar will rotate higher and attempt a move above $97.50 again – possibly attempting new price highs. These new highs are likely to happen in early to mid July 2019.
Our last chart highlights what we believe will happen in the Dow Jones Index (as a general market example of what will likely happen in the ES, NQ and YM). As you can see, we believe the downside price swing that has currently taken price nearly -7.25% lower should be very close to completion. We believe the $24,300 to $24,600 level will act as strong support for this move and prompt another upside price leg over the next 7 to 14 days. We believe this upside price leg will push the DJI price level back towards the $26,000 level by late July or early August 2019.
We are suggesting that the early move into a protectionist stance by professional traders may be about to experience some extreme pressures. Should the US/China trade issue or the Mexico trade issue lessen or be resolved over the next 60+ days, the US stock markets could rally towards new highs fairly quickly. If things stay the same as they are now, we expect price to move exactly as we have highlighted on these charts.
Near the end of July or sometime in August 2019, we expect a bigger top formation to setup where a moderate price collapse may take place. Everything must setup perfectly for this to happen and we still have 40 to 60+ days of trading before this setup gets closer. Lots of things can happen over this span of time, so pay attention to our continued research to stay ahead of these moves.
One thing you can do to prepare for any future price volatility or rotation is to accumulate Gold and Silver positions near recent lows. If you like precious metals see my forecasting signals here This increase in volatility means that precious metals should continue to push higher as fear becomes more rooted across the globe.
We’ve now shown you two different price setups using Fibonacci price theory and the only thing we have to do is wait for a technical price confirmation before finding our entry trade. We’ll see how this plays out over the next few days and weeks. Remember, we are not proposing these as “major price bottoms”. They are “upside pullback trades” (bounces) at this point. A bullish price pullback in a downtrend.
Smart traders are already asking themselves “where is the bottom for this move”. They’ve likely been through these types of rotations in market price before and understand the fundamentals of the US economy are strong enough to support further upside price activity in the near future. The current US/China trade worries could result in a pricing disruption of 4 to 8%, seen as rotation, yet the US Fed is continuing to leave rates unchanged and most US economic numbers are still posting strong levels.
So, smart traders want to know where the bottom in the market is likely to be found and when they should start to accumulate new long positions – which is understandable. We’re here to help.
Our proprietary Fibonacci price modeling system is one of the unique modeling tools we use to hone into any market move. The reason for this is because it shows us so much data that we can “read into” our analysis/research. The other reason is that it is an “adaptive learning” model – which means it continues to learn from price data and adapt its analysis of that data.
Let’s start with the Weekly YM chart. The GREEN highlighted box on this chart shows where the past two Bullish Fibonacci price trigger levels were generated. These, obviously, become key support levels going forward. The narrow ORANGE box near the current peak is the resistance channel we highlighted many weeks ago that suggested a volatility rotation peak may be setting up. We have also drawn an oblique/circle on the chart in BLUE that highlights upside Fibonacci target price levels.
It is our opinion that a further downside leg, possibly to levels below $25,000, are possible as this Shake-Out continues and as the global markets continue to revalue expectations. We are watching the currencies very closely as the Chinese Yuan has devalued extensively over the past few days. This US Dollar strength will keep metals fairly flat while prompting some extra stability in the US stock market over time.
This next chart, the NQ Weekly, shows a similar chart format to that of the YM. Clear resistance can be seen near the recent highs and support is found near the $6600 level from previous Fibonacci Bullish Price Trigger Levels. The NQ, being very heavily weighted in Technology and Internet stocks, may have the ability to fall the furthest within this price rotation – possibly as much as -700 to -800 pts before finding support. Currently, a support level near $7400 is the first level we are watching. If the NQ breaks below this level, then we could see a much bigger move to the downside unfold fairly quickly.
Lastly, the Transportation Index (TRAN) is showing us that the downside price move may have already reached a level that may prompt intermediate price support – or a potential base formation. The $10,400 to $10,500 level, which was already reached, appears to be the initial support level for the TRAN. It would make sense that the TRAN may begin to base near this level over the next few days/weeks while the US stock market attempts to hammer out a bottom.
Ultimately, the $10,000 level has proven to be very strong historical support for the TRAN. So any breakdown in this index would immediately prompt a target level of $10,000 for the next support level. Again, pay attention to the US Dollar and Gold as this movement continues. Any real fear will translate into a weaker US Dollar and increasing prices in precious metals.
In closing, we believe the early signs of a potential price bottom are setting up right now. This may not be the ultimate bottom, but the clear support level in the TRAN is a very good sign that the markets are setting up a support base that may prompt some sideways trading over the next few weeks as the market continues to digest all this global trade news. A deeper “washout-low” price formation may set up in the INDU or the NQ over the next few days which means we may see a deeper price rotation before the downtrend actually ends.
Right now, pay attention to our continued research and we’ll help you find the bottom when it forms. Our current expectations are for a continued downside price move that will establish a washout-low formation over the next 3 to 10 trading days. We’re not out of the woods yet, but we are starting to see the early signs of price support – which means a bottom may not be too far off.
UNIQUE OPPORTUNITY ONLY IN MAY
On May 1st we talked about the old saying goes, “Sell in May and Go Away!” and that is excactly what is happening now right on queue. In fact, we closed out our SDS position today for a quick 3.9% profit and our other new trade started today is up already 10%.
Second, my birthday is only a few days away and I think its time I open the doors for a once a year opportunity for everyone to get a gift that could have some considerable value in the future.
Right now I am going to give away and shipping out silver rounds to anyone who buys a 1-year, or 2-year subscription to my Wealth Trading Newsletter. I only have 13 left as they are going fast so be sure to upgrade your membership to a longer-term subscription or if you are new, join one of these two plans, and you will receive:
1-Year Subscription Gets One 1oz Silver Round FREE
(Could be worth hundreds of dollars)
2-Year Subscription Gets TWO 1oz Silver Rounds FREE
(Could be worth a lot in the future)
I only have 13 more silver rounds I’m giving away
so upgrade or join now before its too late!
https://thegoldandoilguy.com/wp-content/uploads/2019/05/chart5.jpg14602053adminhttp://www.thegoldandoilguy.com/wp-content/uploads/2014/11/tgaoglogo.pngadmin2019-05-10 11:02:112019-05-10 11:02:11The Shake-Out Continues – Where Is The Bottom?
The US Federal Reserve announced today they are leaving rates unchanged based on their latest meeting. The markets should take this as a sign of relief. Yet, hear all-time highs and expecting the Fed may actually decrease rates a bit, the market reacted with quiet price rotation near these highs.
The US Fed could have shaken up the markets even more, but we believe this move by the Fed will be interpreted as “Fed Uneasiness” with regards to the overall US and global economy at the moment. A failure to prompt a rate increase could be seen as weakness by the Fed and uneasiness over the fragility of the US and Global economies. Once this shake-out settles, the markets will go back to doing what the markets always do – interpreting future fair values.
The $INDU rotated much lower today, ending the day almost exactly at a key support channel level (the YELLOW line). Further price weakness could push the $INDU below $26,000 fairly easily if the current high price level is fragile and weak. Price rotation is one of the most basic aspects of all price activity. The price must rotate in order to establish new price highs or lows. As volatility decreased over the past 30+ days, it would not be unexpected to see price retest the $26,000 level, or lower, in an attempt to resume a price trend or re-establish price support before attempting another move higher.
The move in the NQ today was much broader than the move in the $INDU. The Technology heavy NASDAQ 100 rotated downward, below the historical price support channel, and is currently resting just above the previous all-time price high near $7724. Again, the Fed’s inaction may be interpreted as an expectation of market weakness over the next few months. Thus, traders reacted to this move by interpreting this weakness in the Fed to raise rates by selling.
Overall, leaving rates unchanged may be very healthy for the US and global economies. The US Dollar continues to strengthen and this shake-out may be just what is needed before the Summer season for the price to continue trending.
We’ve recently warned that the US major Indexes are nearing our Fibonacci upside price targets and that we believe the upside price move may continue for another 20+ days still. This current rotation may be very short-lived – possibly only 5~10 days of lower/sideways price action before trends resume an upside price bias. Time will tell.
Overall, our prediction that a shake-out was about to happen appears to be unfolding just days after we made the claim. Our longer-term analysis is still the same – continued upside price bias as earnings and fundamentals drive prices closer to our Fibonacci price targets before any bigger price reversal may set up sometime in July/Aug 2019.
UNIQUE OPPORTUNITY
First, we typically see stocks sell-off and as the old saying goes, “Sell in May and Go Away!”
So what does this mean? It means we should start to see money flow into the safe-haven assets like the Utility sector, bonds, and most importantly precious metals.
Second, my birthday is this month, and I think its time I open the doors for a once a year opportunity for everyone to get a gift that could have some considerable value in the future.
For May I am going to give away and ship out silver rounds to anyone who buys a 1-year, or 2-year subscription to my Wealth Trading Newsletter for the first 25 subscribers. You can upgrade to this longer-term subscription or if you are new, join one of these two plans, and you will receive:
1-Year Subscription Gets One 1oz Silver Round FREE
(Could be worth hundreds of dollars)
2-Year Subscription Gets TWO 1oz Silver Rounds FREE
(Could be worth a lot in the future)
I only have 25 silver rounds I’m giving away
so upgrade or join now before its too late!
Charles Schwab has informed its’ clients that “at least 80% of the fund’s net assets will be invested solely in U.S. government securities…”. Schwab automatically assumes that all clients affected by this change will accept: “if you are in agreement with this change in your cash feature, no response is required from you. They consider a non-response from its’ clients to be notice. “Those who disagree have the “option” of either sweeping their cash into the corporate bank exposing them to greater risk. They add “you also have the right to close your brokerage account(s) without penalty at any time.”
Who will be the most recent owners of the rest of the current and future new debt? The answer is: YOU. U.S. Mutual funds, U.S. pension funds and American investors. Why? Because our insolvent government needs Americans to finance it before the entire house of cards come crashing down! One’s ability to take your savings out of banks and store it in cash is coming to an end. U.S. Institutions are holding up to 99.5% of assets in cash, U.S. government securities, and repurchase agreements that are collateralized solely by the U.S. Government’s good faith.
“Debt-As-Legal-Tender”
This will make it much more difficult for one to be able to access any/all of your personal cash which was always considered to be accessible liquid risk free funds. What will American citizens do when they realize they were conned into “toxic investments” and decide to just pull their cash out of the banks and store it themselves? If you do take possession of your savings in cash, how secure do you feel when the government comes knocking on your door asking about your stockpile of cash? Schwab and others are taking preemptive action now to move your money into U.S. debt.
This is just a new vehicle in which the U.S. Federal Government is taking control of your cash and converting it into “toxic assets” to be spread out amongst us all. Why? The answer is to cover our enslavement of $19.9 trillion debt which is growing with each passing second. The Current outstanding public debt of the United States is: $19,926,581,166,878.36 as of Monday, February 20th, 2017. That equates to everyone, in the United States, currently owing $65,586 which represents their share of the U.S. public debt.
Public Debt: $14,403,392,566,439.40 Intragovernmental Holdings: $5,523,188,600,438.96
Total U.S. National Debt: $19,926,581,166,878.36
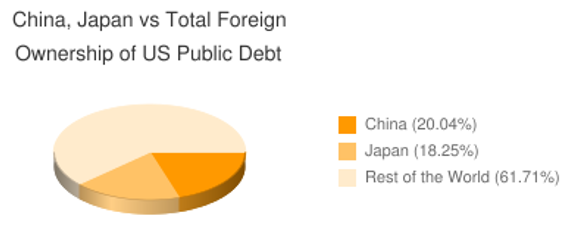
Who owns the public debt?
Foreign governments own the most U.S. debt.
This has been done under the auspices of the S.E.C. (Securities Exchange Commission): (http://www.investopedia.com/terms/s/sec.asp). They implemented the “NewMoney Fund Reform Rules”:
(https://www.sec.gov/News/PressRelease/Detail/PressRelease/1370542347679). The rules require fund providers to institute liquidity fees and suspension gates as a means of preventing a run on the fund. The requirements include asset level triggers for imposing a liquidity fee of 1% or 2%. If weekly liquid assets fall below 10% of total assets, it triggers a 1% fee. Below 30%, the fee is increased to 2%. Funds may also suspend redemptions for up to 10 business days in a 90-day period. These are the official rule changes; there are several factors investors should know about the reform and how it will affect them during its’ implementation.
The S.E.C. Chairwoman. Mary Jo White, said “Today’s reforms fundamentally change the way that money market funds operate. They will reduce the risk of runs in money market funds and provide important new tools that will help further protect investors and the financial system. Together, this strong reform package will make our markets more resilient and enhance transparency and fairness of these products for America’s investors.” This is what the SEC wants Americans to believe and buy into it!
The official final amendments to money market rules, which were made in 2014, for protecting shareholders from the impacts that a flood of redemptions could have on money market funds is how the S.E.C. is rationalizing this dilemma. The amendments are also intended to give fund managers enough time to respond to requests in a more thoughtful, prudent manner and in a much slower period.
Fidelity is converting its’ largest prime fund into a U.S. government fund. Federated is taking steps to shorten the maturities of its’ prime funds to make it easier to maintain a $1 NAV. Vanguard is assuring its’ investors that its’ prime funds have more than enough liquidity to avoid triggering a liquidity fee or redemption suspension.
The Bank of America Corp. sold its’ money market business to BlackRock, Inc. to avoid these types of future problems.
Restricts who can invest in retail money market funds.
Continues to seek a stable $1 net asset value (NAV) for retail and government funds, but requires institutional funds to have floating NAVs like other mutual funds.
Allows certain funds to impose liquidity fees and temporarily suspend withdrawals (known as gates) in certain circumstances.
Gold Is Money!
Global negative interest rates have shifted the worlds’ appetite to buying gold and silver, once again. Gold and silver can sit outside the system and remain completely private. It cannot be tracked by the government or banks. Gold and silver have been the world’s greatest wealth protectors for over 5,000 years. It has shielded its’ citizens from government and banking collapses during the worst crises in history. Physical gold and silver cannot be instantly seized with the stroke of a keyboard. This is why I believe we should invest in gold and silver, before we have potentially nothing left to protect. Its two things to me: a store of untraced wealth, and an insurance policy in case something really bad happens. I like feeling financially protected and this is one way I do this.
Timing Is Everything!
The next BIG TRADE is setting up. You should take advantage of my hard work and expertise to make you short term profitable trades. Protect your financial future by getting my market and trade alert reports every week. Your portfolio should involve a proven strategy which I provide.
We have just entered a new commodity trade (UGAZ) Feb 21 as its forming a bottoming pattern. We have locked in 10% in 36 hours and hold the remaining for much larger gains. Do you want to be in the next trade of the Next Hot Stock setup? My subscribers banked a 112% in a swing trade with NUGT (Dec 16 – Feb 8th). All the trades are based on my Momentum Reversal Method (MRM) trading system.
Another trade this month was ERX, in which we took a nice profit of 7.7% in less than 24 hours after entry. All risks are well contained.
https://thegoldandoilguy.com/wp-content/uploads/2017/02/sec.jpg334640adminhttp://www.thegoldandoilguy.com/wp-content/uploads/2014/11/tgaoglogo.pngadmin2017-02-23 10:28:102017-02-23 10:28:10What Investors Need To Know About U.S. Money Market Funds?
Here is a great video that shares the brutal truth and issues taking place today with the financial markets. Obama and Fed Chairwoman Agree as shown on video…
Obama and Fed Chairwoman Agree as shown in video…
Fast track video START AT 4:22 time where Mike shares his insights.
https://thegoldandoilguy.com/wp-content/uploads/2017/02/fed.png273323adminhttp://www.thegoldandoilguy.com/wp-content/uploads/2014/11/tgaoglogo.pngadmin2017-02-15 12:28:332017-02-15 12:39:44Today’s World Rests on an Empire of Debt
Where is this economic boom that Former President Obama and his administration had taken so much credit for?
The Obama Administration, with the assistance of the Federal Reserve and Company, deliberately kept the U.S. economy from creating any growth at all. The money that flowed from the Federal Reserve, over the last 8 years, had a direct pipeline that flowed only into Wall Street Investment Banks. The American people were sold this false bill of sale that “Quantitative Easing” was going to make lending money to “Main Street America” easier to access. They promised that there would be a boost in hiring which would, in turn, increase aggregate demand and thereby reflect a newly stimulated economic growth!
This QE effectively down-sized the middle class into minority status. The largest growth has occurred within the low-income category. Despite the stock market reaching near all-time highs and real estate bubbling over once again, there are now 45 million Americans on food stamps. This number is at an all-time high. People are feeling poorer today than ever, and with sky rocketing real-estate prices those who do not own a home cannot afford to buy anymore!
This massive disconnect is expanding exponentially. The velocity of money is the number of times that currency is turned over to purchase domestically- produced goods and services. One can see, as in the chart below, that the velocity of money has been steadily decreasing. There are less transactions occurring by individuals in our economy. One can see that the money never reached “Main Street America” which is why there has not been any demand for goods and services.
The average American is now barley scraping by and many do a lot of their shopping at dollar stores. Most the growth in the job market is in low wage jobs which have zero benefits! The clear majority of Americans have bought into the propaganda promoted by the controlled media outlets.
The masses bought into this propaganda as Wall Streets’ big banks kept artificially inflating the equity markets with free and cheap money, which was at the expense of U.S. taxpayers.
The Obama Machinery put on a stellar performance for the American people, however, this was a fictitious story. In fact, the real number, as of January 2017, of unemployed Americans currently stands at 22.9%: (http://www.shadowstats.com/alternate_data/unemployment-charts). The big gains have been largely allocated to the well-connected financial sector.
Corporations took advantage of low interest rates to buy back stock in their own companies. Since 2008, corporate stock buybacks have surpassed $2.2 trillion. These buy backs have only increased the price of corporate stocks and made their companies appear more valuable than they are. This means that stock prices are far above what they would be if it were not for extremely low interest rates. The politicians believed that it was more important to create a false front and to continue the illusion so that they would remain in power.
The Tax Foundation reports that 60% of the population now receives more in government benefits than what they pay in taxes. What does this say about a society in which more than half of the population are living at the expense of the other half? Currently, what is even worse is that the dependent class is steadily growing. The 60% will soon become 70%.
Mr. Hayek stated that “Capitalism is the only system of economics compatible with human dignity, prosperity, and liberty. To the extent, we move away from that system, we empower the worst people in society to manage what they do not understand”.
On March 23rd, 2009, the then Treasury Secretary, Tim Geithner sent the stock markets soaring. He announced a plan to help banks unload illiquid securities of uncertain worth from its’ balance sheets. The Wall Street headlines read “Toxic-Asset Plan Sends Stocks Soaring”. Federal Reserve Chairman Ben Bernanke implemented “financial engineering” (https://en.wikipedia.org/wiki/Financial_engineering) as the sole solution to all our financial problems.
He was publicly opposed to the nationalization (https://en.wikipedia.org/wiki/Nationalization) of banks and said “the bookkeeping problems of many banks are largely an artifact of foolish federal regulations. Capital standards, accounting rules and other regulations have made the financial sector excessively procyclical.” As we are presently realizing, government control over the financial markets and the economy have failed us. What we needed was the Federal Government to focus on job creation and to restructure our economy for new and future growth.
They were laser focused on merely bailing out Wall Streets’ big banks. In my view, the Federal Government should only be focused on its’ constitutional responsibilities. Keeping the free markets out of their control and protection and serving the American people should be their primary goal.
They needed to allow deflation to play out its’ cyclical role. However, it turned out worse as they attempted to control it. Federal Government bailouts resulted in financial enslavement. There was further unequal distribution of wealth in our society. Today, in 2017, I clearly see the implosion of America, as we once lived and knew it to be.
The economy was being run on non-to low growth policies intentionally. President Obama deliberately took the path of doing absolutely nothing. He did not want to be accountable for any economic growth most likely because a stock market crash would ensue. That would have placed pressure on wages that would cause inflation at which time the Federal Reserve would be forced to raise interest rates. If this had occurred, all the free money which Wall Street investment banks received would not have been invested in the equity markets.
The GDP Annual Growth Rate in the United States merely expanded by 1.90% in the fourth quarter of 2016, over the same quarter of the previous year. A record low of -4.10% was reported in the second quarter of 2009.
They purchased their own shares back which sent stocks higher into unchartered territory. The way that they played the game was to keep inflation at bay and allow us to wallow in a deflationary contracting economy. As stock prices rallied upwards, the corporate executives continued to receive heavy compensation on cheap cash being provided to them. In the term that Chairwoman Yellen resides over, she has only increased interest rates twice by a mere marginal 25 basis points. This was an immaterial rate hike so as the Federal Reserve could maintain their credibility. Increasing interest rates would have killed this game of “cheap money” which kept the wealth flowing into the top 1 percent. The Federal Reserves’ decision to not raise interest rates during their last meeting (http://money.cnn.com/2017/02/01/news/economy/federal-reserve-january-meeting/index.html) sends a clear and powerful message that they do not want to go down the path of normalization (http://www.discovery.org/a/23721) . They want to continue to artificially suppress interest rates. If they had attempted to “normalize”, it would create massive assets and derivative bubbles bursting domestically and globally. Either the bubble will burst or we will return to inflation.
President Trump wants to create the growth which former President Obama never accomplished. He is proposing tax cuts, introducing fiscal stimulus and removing all the red tape that has been so costly for small businesses to implement. He has also promised to lift GDP to 4% by spending $1 trillion to rebuild America’s infrastructure. This will overheat the economy! Trying to implement his plans will call for deep cutbacks in Medicare and Social Security. It will take years to forge ahead with legislative approval.
Conclusion:
Where is this economic recovery that supposedly happened? It exists in the stock market at present as the masses are enduring a poorer quality of life!
Our subscribers are currently in a swing trade with NUGT (http://www.etf.com/NUGT) which is up 95.8% currently and we are expecting further gains going into this week. All the trades are based on our Momentum Reversal Method (MRM) trading system. The strength of the precious metals will continue to drive gains for our NUGT position. Expect some very interesting and exciting new trades this week. We are getting ready for some very explosive moves.
https://thegoldandoilguy.com/wp-content/uploads/2015/10/fed.png202315adminhttp://www.thegoldandoilguy.com/wp-content/uploads/2014/11/tgaoglogo.pngadmin2017-02-06 10:05:092017-02-06 10:05:09Can New President Make Things Better for the People?