Posts

This is part three of a five part series of the four biggest mistakes traders and investors make which costs them time, money and usually self-confidence when trading stocks, ETF’s or futures trading strategies.

The Four Biggest Mistakes

1. Lack Of A Trading Plan – Part I

2. Using To Much Leverage – Part II

3. Failure to Control Risk

4. Lack Of Self-Discipline


Mistake #3 – Failing to Control Risk

If you were to engage in something risky like skydiving, you or a team would check your parachute to be sure its packed properly, strapped on to your body correctly before you jumped out of the plane. If for some reason you were not told how to use the gear, like when to pull the ripcord etc… I guarantee you would ask them before you threw your body out of the plane.  There is a real fear of dying so you naturally make sure you are in control of what you are about to do so your risk is managed and live another day.

But when it comes to trading this is not the case and you and I both know a good part of why. We all know people who have said rude things, quit jobs or broken up with a girlfriend or boy friend over the internet (email/text message). Let’s face it, it’s easy to be brave online and do things we would never really do in person. Heck, some of the emails I get from readers of my free weekly articles I post are so rude and some are threatening that all I can do is laugh. Because I know these people would likely never say the things they did to someone they have never met, and do it to their face all because they think my FREE short term market prediction does not fit their bias. I think you get the point here…

So when it comes to trading individuals get this what I call “Online Courage” and this is why so many fail to protect their capital when trading. They simply don’t see their money so it does not feel at risk (out of sight is out of mind). This lack of fear is what leads to loss of risk control.

I talk a lot about controlling risk in my new book “Technical Trading Mastery – 7 Steps To Win With Logic” Special Offer & Free Lifetime Subscription Expires Jan 1st!

7 Steps To Win With Logic

How to Avoid Mistake #3

There area few things that can and should be done to control your overall risk when trading. The first one is diversification. Not having all your trading capital in one investment allows you to spread your risk between other investments with low correlation, meaning if one of your positions move down, another one should be moving up in your favor.

The second is diversification between time-frames. Having multiple positions based on different time frames can provide an overall lower volatility in your portfolio. For example you could be long the daily chart for a swing trade that should last a couple weeks, and you may be short the 60 minute chart because you expect a shot term pullback. Time diversification is overlooked by many traders.

Third is through position sizing. It’s better to have a few smaller positions spread captial over various investments than it is to have one position in only one investment (eggs all in one basket).

And finally the last and one of the most important is the stop loss. They are commonly referred to as money management stops. They are not used to increase your positions performance. Instead they are there to protect you from unnecessary loss if the market moves against your position. Keep in mind when I say protective stop, I dont mean a mental stop (one floating around in your head) I mean a read stop loss order that is live in the market. Risk control should never be an option, it’s a MUST!

In short, risk control will not single handily allow you to beat and profit from the market. But without managing your risk you have no hope of winning in this industry. The key is to stay in the game long enough to start seeing gains and allowing your money to compound over time for above average returns.

Controlling risk is in each trade that is taken with my subscribers at TheGoldAndOilGuy.com ETF Trading Strategies are something I always provide. Consider joining the newsletter today and start trading with confidence.

Also stay tuned for the next part in this series Lack Of Self-Discipline!

Chris Vermeulen
www.TheGoldAndOilGuy.com

GET MY FREE TRADING IDEAS AND EDUCATIONAL REPORTS BELOW


Tis the Season for the most powerful seasonality trade of the year!

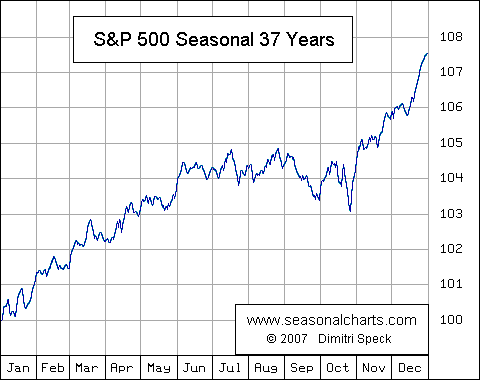
Seasonal ETF Trading StrategiesWith the stock market up big in 2013 and most participants are speculating on a pullback in the next week or two, I have to say I am on the other side of that bet. Being a technical trader I focus on patterns, statistics and probabilities to power my ETF trading strategies. So with 37 years of stats the seasonality chart of the S&P 500 index paints a clear picture of what is likely to happen in December.

If you do not know how to read a seasonality chart, I will explain as its very simple. The simply shows what the index has done on average through each month over the past 37 years. December typically has the strongest up trend and probability of happening any other time of the year.


The Big Board – NYSE

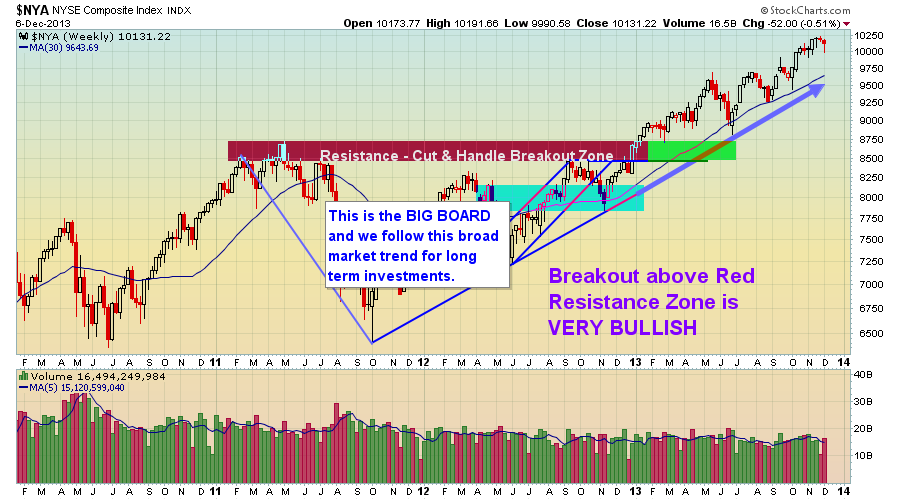
The NYSE also referred to as the Big Board, is an index with the largest brand name companies. Most individuals do not follow this, but to me its as close to the holy grail of trading than anything else I know. I use many different data points from this index (momentum, order flow, trend) for my ETF trading strategies.

You must follow the trend of this index if you want to be on the right side of the market. While I follow and track the New York Stock Exchange closely and it has its own fund NYC but it’s an ETF trade I do not use. These big stocks are what really move the market (S&P 500) I think so I always trade with this index trend in mind.

NYSE ETF Trade


S&P 500 Weekly ETF Trading Strategy – Bullish

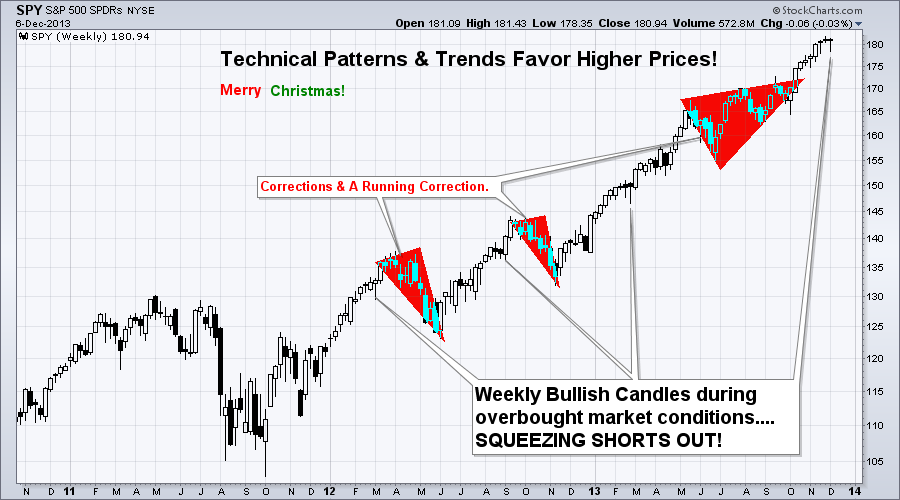
The chart below is self-explanatory I think… But let me recap.

The overall trend is up, so your ETF trades should be to the long side buying on the dips. The chart below goes back three years so the candles are a little condensed and small, but what you need to know are these two points:

1. After a correction within a trend, probability says that price is more likely to continue rising than it is to reverse. Notice the market just had a running correction through the summer months.

2. A reversal candle on the weekly chart (bullish reversal candle) generally indicates a 2-3 week rally is likely to happen.

Conclusion: Seasonality says higher prices, weekly chart below shows bullish reversal candle… Oya!

ETF Trader


The Bigger Picture: 3 -6 Months Out…

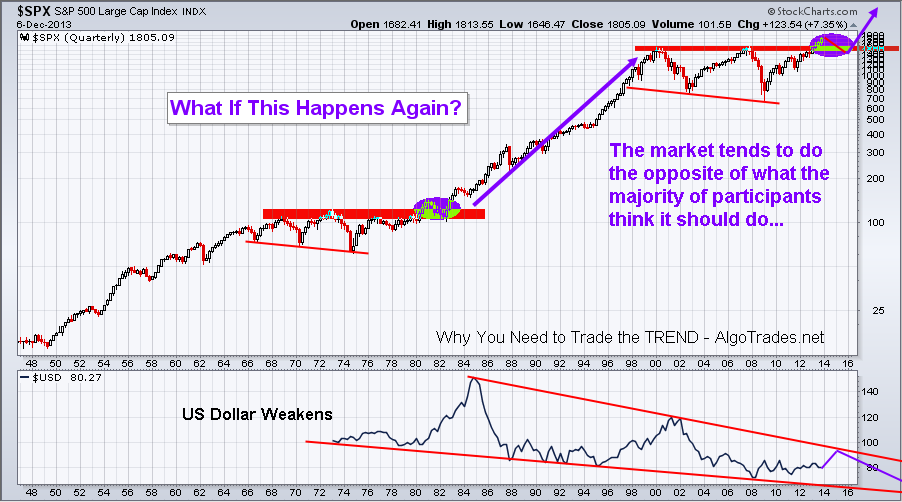
This is a quarterly chart and BIG picture outlook. Over the next 3-6 months we could see the stock market start to become choppy and rollover into a minor bear market for a couple years. That is the best case scenario I think… The other scenario is a major crash back down to the 700-1000 level on the SP500 which would cripple the baby boomer’s from retiring and getting a job would be impossible for almost everyone – full blown recession way worse that what everyone is saying we are in now.

Things are going to be really interesting over the next few years and things for south you better be prepared to make a killing during the next bear market or life will not be fun. The nice thing is that you can take advantage of these moves without ever having to lift a finger with my automated trading system.

ETF Trading Strategies


ETF Trading Strategies Holiday Conclusion:

In short, I think we have a couple good weeks ahead of us. Holiday season, quality family time and a rising stock market paints a nice picture in my mind.

Anyway, I hope this report was helpful and somewhat educational. I always appreciate feedback and things you would like me to write about how I interpret, trade or analyze things. I am here to help and new topics to write about are always welcome!

JOIN MY FREE ETF TRADING NEWSLETTER!

downarrow


Cheers,
Chris Vermeulen
ETF Trading Strategies Newsletter

Silver, Gold & Miners About To Sell Off Again

A couple weeks ago I posted these same charts talking about the pending breakout (in either direction) with silver, gold and mining stocks. Fast forwarding to this week its clear this sector continues its struggle to rally. Key support levels are now being tested and if these levels fail prepare for a sharp correction with mining stocks showing the most downside potential of roughly 25% for the GDX ETF trading fund.

Let’s take a quick look at what is going on.

Gold Trading Chart:

The chart of gold shows price being wedge into the apex of the down sloping resistance trend line and the rising support trendline. Gold was trading below this level but has since bounced. But if gold closes the week below this line in the sand the price could start to fall quickly and test the $1200 per ounce within a week or two.

gold18


Silver Trading Chart:

Silver is under performing gold and trading below its support level currently. If silver does not recover by Friday’s closing bell then things could get ugly for a few weeks as investors start to exit their positions. That being said, I need to point out that silver is more of a wild card when using trend lines like this. Both gold and gold miners should be confirming this breakdown in silver if it is the real deal.

silver18


Gold Mining Stocks ETF:

The chart of gold miners I like the most. I like it because it’s pointing to lower prices, roughly 25% lower if the breakdown takes place. Gold mining stocks could be a fantastic long term investment if we see the $17.50 level reached on this GDX etf.

gdx18


Last week I talked about ETF trading strategies and the big picture on gold, silver, miners and bonds. They look to be nearing a major bottom and once they do bottom it should be a great buying opportunity for specific stocks or the entire sector.

The next few weeks are going to be crucial for precious metals and we will keep an eye on them as this bottom unfolds. Get more reports like this here: www.GoldAndOilGuy.com

Chris Vermeulen