Moe and I had a great call today as we both get into some details on the markets. Moe is a 40-year veteran of the markets and we see the markets in a similar way. We talk about how to trade, have a listen and our conversation starts at the 23minute mark if you want to fast track things.
If you want to improve your accuracy and opportunities for success, then we urge you to visit www.TheTechnicalTraders.com to learn how you can enjoy our research and our members-only trading triggers (see the first chart in this article). If you are managing your retirement account or 401k, then we urge you to visit www.TheTechnicalInvestor.com to learn how to protect your assets and grow your wealth using our proprietary longer-term modeling systems. Our goal is to help you find and create success – not to confuse you.
In closing, we would like to suggest that the next 5+ years are going to be incredible opportunities for skilled traders. Remember, we’ve already mapped out price trends 10+ years into the future that we expect based on our advanced predictive modeling tools. If our analysis is correct, skilled traders will be able to make a small fortune trading these trends and Metals will skyrocket. The only way you’ll know which trades to take or not is to become a member.
Chris Vermeulen
Chief Market Strategist
Founder of Technical Traders Ltd.
https://thegoldandoilguy.com/wp-content/uploads/2020/05/MarketWrap.png149336adminhttp://www.thegoldandoilguy.com/wp-content/uploads/2014/11/tgaoglogo.pngadmin2020-05-08 15:35:222020-05-08 15:35:22A Technical Look at the Markets with Analyst Moe Ansari & Chris Vermeulen
Both Gold and Silver Futures have been struggling to rally above recent high levels since the start of the global stock market collapse related to the COVID-19 virus event. Yet, the Junior Gold Miners appear to be telling us the Precious Metals market is boiling hot.
Gold, the bell-weather safe-haven asset, initially collapsed when the US stock market started the massive selloff in late February 2020, then recovered to higher price levels near $1785 recently. Since reaching these levels, Gold has stalled into a sideways price flag near major resistance.
Silver, on the other hand, is trading near $15.60 and has yet to really recover to anywhere near the levels it had achieved in early January 2020 (near $18.60).
Well, GDXJ, the Junior Gold Miners ETF, is suggesting a very strong price rally is taking place that may push both Gold and Silver substantially higher. Key resistance exists near $46.50. Once broken we believe a very strong price rally will take place pushing GDXJ price levels to $51 or $52. After that, a brief downside rotation will potentially retest the $47 to $48 levels before an even bigger upside rally takes place. What is even more important is that we believe this big breakout move could start as early as next week, May 12th or after.
This GDXJ Weekly chart highlights the same price pattern and shows why we believe the upside price breakout could be a massive new trend. The Deep price low setup because of the COVID-19 virus event creates a very big price range for any future price advancements. That $24 price range, if applied to price levels before the breakdown event near $41, may suggest GDXJ could rally to levels above $65 over the next few weeks or months.
GDXJ WEEKLY CHART
CONCLUDING THOUGHTS:
We believe the upside rally in both Gold and Silver recently is a very good indication that the sideways price channel that has plagued precious metals recently may be ending. If precious metals prices begin to rally, then GDXJ will break the upper $46.50 resistance level and begin a new upside price rally clearing the resistance setup before the virus event began.
Get ready, this could be a very big move higher for Junior Miners and it could align with our May 8th through May 12th global market inflection point prediction.
If you are using our free public research for your own trading decision-making and/or using it as an opportunity to find and execute successful trades, please remember you are the one ultimately making the decisions to trade based on our interpretation and free research posts. We, as technical traders, will continue to post new research articles and content that we believe is relevant to the current market setups.
If you want to improve your accuracy and opportunities for success, then we urge you to visit www.TheTechnicalTraders.com to learn how you can enjoy our research and our members-only trading triggers (see the first chart in this article). If you are managing your retirement account or 401k, then we urge you to visit www.TheTechnicalInvestor.com to learn how to protect your assets and grow your wealth using our proprietary longer-term modeling systems. Our goal is to help you find and create success – not to confuse you.
Our researchers will generate free research on just about any topic that interests them. As technical traders, we follow price, predict future price moves, tops, bottoms, and trends, and attempt to highlight incredible setups that exist on the charts. What you do with it is up to you. Visit www.TheTechnicalTraders.com/FreeResearch/ to review all of our detailed free research posts.
In closing, we would like to suggest that the next 5+ years are going to be incredible opportunities for skilled traders. Remember, we’ve already mapped out price trends 10+ years into the future that we expect based on our advanced predictive modeling tools. If our analysis is correct, skilled traders will be able to make a small fortune trading these trends and Metals will skyrocket. The only way you’ll know which trades to take or not is to become a member.
Chris Vermeulen
Chief Market Strategist
Founder of Technical Traders Ltd.
https://thegoldandoilguy.com/wp-content/uploads/2020/05/12.png574850adminhttp://www.thegoldandoilguy.com/wp-content/uploads/2014/11/tgaoglogo.pngadmin2020-05-08 08:21:152020-05-08 08:21:15Junior Gold Miners Ready To Run
Gold is setting up for a historic rally based on my analysis. Recent news provides further evidence that the Precious Metals and Currencies are in for a wild ride. Just this week, news that China’s reserves fell below $3 Trillion as well as the implications that the fall to near $2T in reserves could happen before the end of 2017. Additionally, we have recent news that the EU may be under further strain with regards to Greece, the IMF and debt. The accumulation of Precious Metals should be on everyone’s mind as well as the potential for a breakout rally.
Based on my analysis, I would estimate that near June or July 2017, Gold will be near $1315 ~ $1341 (+13% from recent lows). This level correlates to a Fibonacci frequency that has been in place for over 3 years now. A second Fibonacci frequency rate would put the project advancement levels, possibly closer to October/November 2017, near $1421 (+21% from recent lows). After these levels are reached, I expect a pullback to near $1261 if the Gold rally ends near $1315~1341 or to near $1308~1309 if the Gold rally ends near $1421. This pullback would setup a massive next wave rally to $1585 or $1731. So, if you need confirmation of this move, just wait for any rally to end above $1315, then wait for a pullback below $1280 or $1315 and BUY.
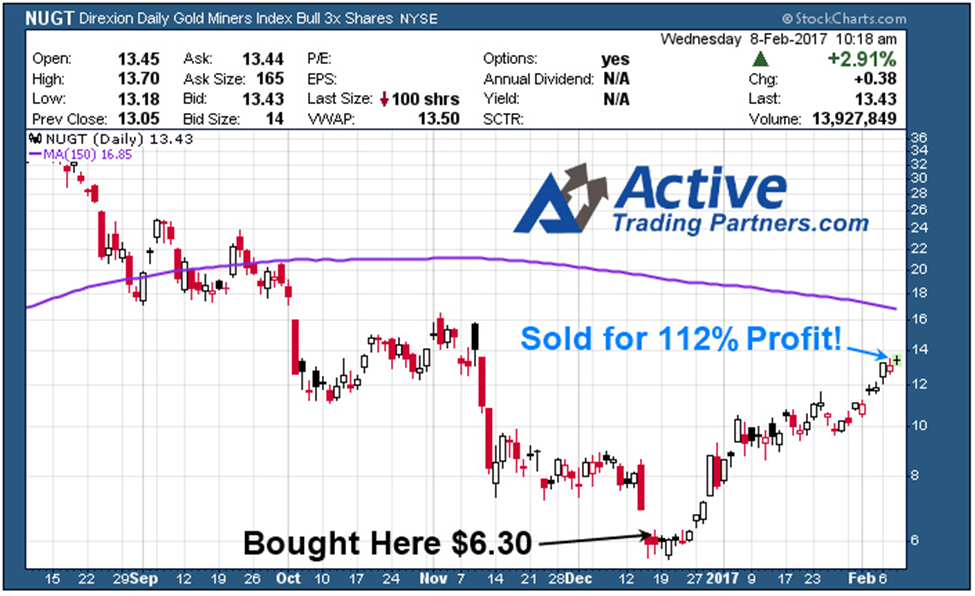
Subscribers and followers of my work profited handsomely this month locking a 112% profit with NUGT ETF with my service at ActiveTradingPartners.
Remember, the volatility expansion I am expecting in the VIX near March/April will likely be the precursor event to a much larger volatility expansion later this year. I can’t accurately detail the scale and scope of the projected March/April event other than it will likely be larger than the last VIX expansion. I expect these global debt events to unravel the low volatility activity we have been seeing and shake up global markets/currencies. Within this process, Precious Metals will likely see a massive upside run as a protection from uncertainty and risk.
Silver Rally
Much like Gold, the other shiny metal is set for incredible runs as well. Given my Fibonacci frequency analysis, a similar type of patter may occur in Silver. Before we get too much further into this analysis, let me be clear about one thing. We are already nearly +50% towards the upside rally target in Silver based on simple Fibonacci frequency. This target is $19.10. This does not mean this is the end of the run (yet). It means we have already achieved some success in one level of predictive analysis and now we need to see if the second Fibonacci frequency plays out. The second Fibonacci frequency target is $20.78 (nearly +25% from recent lows)
Much like the Gold analysis, after these levels are reached, I expect a retracement/pullback to levels that reflect the Fibonacci frequencies before a follow through rally continues. The first Fibonacci frequency pullback range is $18.26~$17.85. The second, larger, Fibonacci frequency pullback range is $19.50~$18.82. Case in point, these retracement levels are based on what I can determine as common Fibonacci frequencies. The pullbacks could be deeper and reflect more uncommon frequency functions. As of right now, I don’t believe that will be the case – but I could be wrong on this matter. In any event, once the rally points ($19.10 or $20.78) are reached and Silver pulls back to below my retracement objectives ($18.26~$17.85 or $19.50~$18.82 respectively), look for long entry positions or accumulate more physical metals. Want to know what my upside “second wave” objective might be based on my frequency analysis for Silver?
Silver Charts – Daily & Weekly
Seeing as though you have been so patient in reading my analysis/article regarding these VIX cycle patterns and what I believe could happen with the US and global markets, I’m going to shed a little light into the future cycle phases of Silver. We’ll focus on Silver for one reason, it is a cheaper precious metal for most traders to participate in and it has some very interesting facets of cycle/Fibonacci analysis. One key date range that keeps appearing in my cycle analysis is April 17th through April 24th.
Additionally, June 26, July 31 and August 14 appear to be key cycle dates. Given my earlier analysis, I suspect the April dates will be critical to the VIX cycle spike that I’m expecting. It could also drive further expansion or price rotation in the Gold, Silver and OIL charts. What is interesting about these Fibonacci Time/Price “inflection points” is that they can be drivers of many outcomes (rallies, collapses, rotations, tops or bottoms). They simply tell us that we need to be aware of these dates and they may, and will likely, present key information for future decision making.
Now, onto the extended projections for Silver. If my first, shorter, Fibonacci frequency is correct, any subsequent (second wave) rally will likely start near $17.85~$18.15 sometime near or after April 10, 2017. This second phase rally will likely run to near $21.46 before finding resistance (possibly slightly higher). Target objective date ranges for this rally to end are June 19 through July 24.
If my second, longer/larger, Fibonacci frequency analysis is correct, any subsequent (second wave) rally will likely start near $18.80 sometime near or after May 8, 2017 and run to near $24.85 before finding resistance (possibly higher). Target objective date ranges for this rally to end are July 3 through August 7 (or later).
Remember, these second wave projections in Silver represent a 20.5% and 32.85% rally from my projected retracement levels. These are massive moves and I hope you are all able to take advantage of these triggers. Gold should move in somewhat similar manners – so pay attention. Smart traders and followers of ATP newsletter may take advantage of trades to play these moves.
USD (US Dollar) and Foreign Currencies
I touched on this topic earlier, yet I feel the need to provide further documentation regarding my belief that the USD will continue to enjoy renewed strength at least for the next few months. First, I expect the global weakness in foreign markets to continue to propel the USD and the US stock market to greater attempts at new highs. I believe large amounts of money will keep pouring into the US markets for reasons that are obvious to most – US strength and capabilities for growth. As I often tell my clients, if the US is growing, so is the rest of the world. The current situation is a bit different though as the US markets and currency is, as I believe, going to be a standout marketplace in a global pot of debt and confusion.
There is one level of resistance on the USD that we have to be concerned with, the $102.25 level. Beyond that, I believe the USD could reach $104~105 before August 2017. The possibility that a VIX expansion could drive the USD higher would be more highly correlated if there is some external (global) event that provides a catalyst for a stronger US Dollar. For example, a crisis in Europe, Greece or Asia that undermines expected currency valuations and results in strength in the USD. Right now, I would put that possibility at about 50/50 given some of the news items I’m seeing and the continued fundamental strength of the US economy.
USD Daily & Weekly Charts
The EURUSD relationship will continue to see downward pressure with a likely target objective near 1.035 as a first target. This downward pressure could drive the EURUSD valuations well below this level, but I feel the potential for the EURUSD falling below the 1.00 level is still far off. It would take a global cataclysmic event to drive the EURUSD values below PAR. I’m not saying it could happen, but I am saying I don’t see it happening anytime soon (without a global cataclysmic event).
My Fibonacci frequency target levels for the EURUSD are 1.014 and 0.999. As I stated, I don’t believe there is much downside risk below 0.99 unless the EU completely collapses. I still feel the Euro will survive as a global currency near PAR with the USD.
EURUSD Daily & Weekly Charts
Take a look at some of my recent trades to see how we’ve been able to generate profits for our valued members.
I hope you have enjoyed my analysis of the VIX cycle patterns and how the relate to opportunities for all traders? If you find this type of analysis helpful and want to take advantage of clear, concise and profitable trading signals, visit ActiveTradingPartners.com where I share even more detailed analysis and trading triggers with my members.
https://thegoldandoilguy.com/wp-content/uploads/2014/06/goldbreakout.png158238adminhttp://www.thegoldandoilguy.com/wp-content/uploads/2014/11/tgaoglogo.pngadmin2017-02-17 11:02:502017-02-17 11:02:50Gold, Silver, Dollar Cycles – Part III
Have you ever been presented with an opportunity and missed out on it? Well, here is an opportunity you Do NOT want to miss out on.
Based upon my unique “Cycle Analytical” work combined with my “Proprietary Predictive Analytics Model”, I can assure you that there are new highs to be made in the U.S. stock. Appling my unique metric, which are not available to the public, I can inform you that the stock markets are not overbought or overextended, at present. The market remains in a clear bullish trend! This next new leg is very sustainable!
Technically Speaking, It Is Now Back To “Buy The Dip”:
The SPX, Dow Jones and the Nasdaq Composite all closed at new all-time highs last Friday, February 10th,2017. The Trump Rally is just getting started according to Bloomberg.
Investors should expect that the global markets will continue their bull market run throughout the first half of 2017 rather than forming a top which leads to a bear market. “Extremes” have lost their’ meanings, at this point. The Federal Reserve has given the green light to major banks in the U.S. to raise dividends and buy back shares of their companies. The huge thrust in momentum has now returned to the four U.S. stock indexes.
Nicholas Teo of KGI Securities said that: “Ever since his victory in November, global stock markets have been steered by actions events rhetoric emanating from the new commander-in-chief”.
The trigger events show the willingness of the markets to give the Trump Administration a lot more ‘slack’ as we engage into 2017. Billions of dollars are continuing to flow into the U.S. real estate market from Chinese nationals. They are using their offshore cash reserves to make payments on the properties they have speculated on in the U.S. There are also big-money speculators who have the sophistication needed to circumvent China’s Capital Controls.
Blackrock estimates that there is a whopping $50 trillion in cash “sitting on the sidelines”. This money has come from global central-banks, financial-firm reserves and consumer savings accounts. Blackstone is keeping nearly one-third of its’ assets in cash. Fund managers have increased their reserves to levels that equal the highest since 2001. This means that there is a lot of liquidity with nowhere to go, but UP.
We are still in the early days of the new Trump Administration and everything seems to be going his way. President Trump’s proposed economic policies are being well received by U.S. businesses, especially Wall Street big banks. His plans are certainly positive – such as deregulation, defunding of various useless federal agencies, simplification of the tax code and lowering taxes. Many people, including some of the best money managers, in the world, are at a loss trying to figure out where to put their money, right now. However, all that you need to do this year is to follow my lead as I strive to make profitable returns and be on the right side of all markets, and you cannot afford to miss any hugely profitable setup this year!
All of the indicators continue to suggest higher prices ahead!
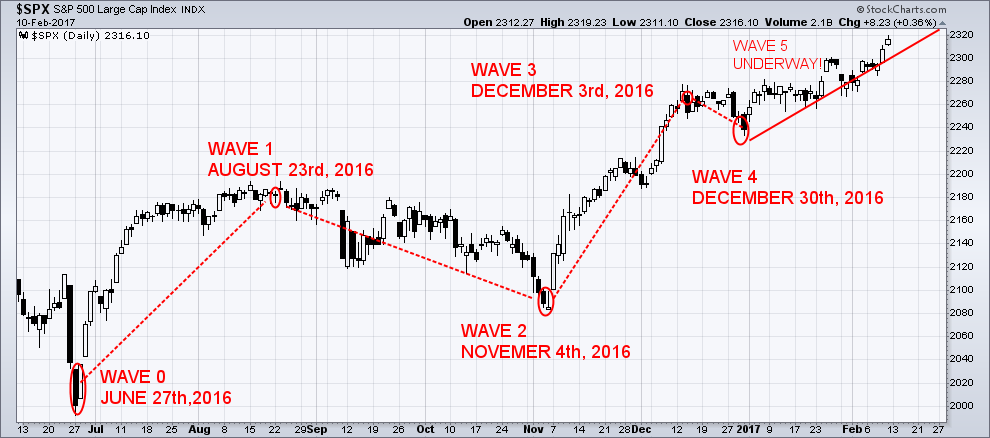
The Elliott Wave Principle is a description of how groups of people behave. It reveals that mass psychology swings from pessimism to optimism thereby creating specific and measurable patterns. In the chart below, repeating patterns in prices are displayed showing where we are located at any given time. In those repeating patterns, I can predict where we are going next.
Wave 5:
Wave 5: Wave five is the last leg in the primary direction of the dominant trend. Wave 5 advance is caused by a small group of traders. Prices will make a new high above the top of wave 3.
How To Make Money In 2017!
Do you trade like the professionals do? Most traders make the same mistakes – which is why they consistently lose money! Implementing my winning strategy by receiving SMS text alerts every time we enter or close a trade is the best way to get you setup and be profitable on the same day! Trading and focusing on my Momentum Reversal Method (MRM) and trading just the hot stocks and sectors for quick oversized gains is my expertise. Therefore, these momentum trades are moving significantly in one direction on heavy volume. The length of time for which I may hold a momentum trade depends on how quickly the trade is moving with trades lasting 3-25 days in length and we look for a7%- 35% potential gain.
Momentum traders are truly a unique group of individuals. Unlike other traders or analysts who dissect a company’s financial statements or chart patterns, a momentum trader is only concerned with stocks in the news. These stocks will be the high percentage and volume movers of the day/week.
Sometimes stocks move very fast. As I enter any new swing trades, I will immediately send out these alerts to you on your mobile device.
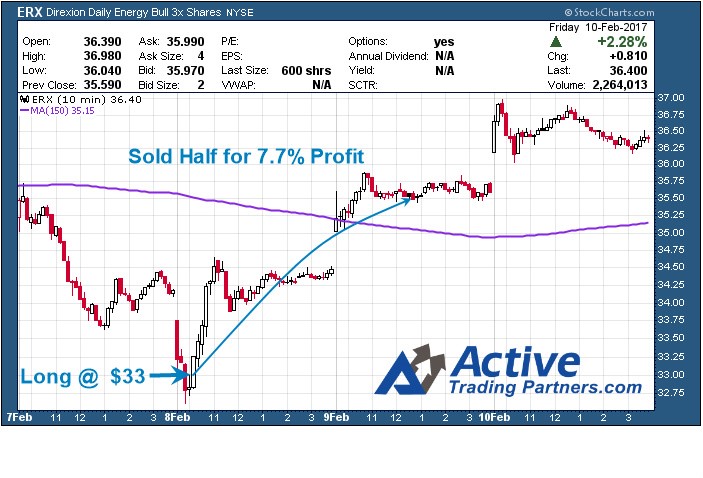
On February 8th, 2017, we entered the ERX at $33.00. Right after we got into this trade, ERX, (http://etfdb.com/etf/ERX/), we were up 6% to 8% and we closed half our position. Instantly receiving these alerts on your mobile device can make a huge difference in both time and profits as you saw in the ERX setup! I always send out my swing trades to my members by SMS, but keep in mind most trades can be entered within a 1-3 day period as I don’t catch exact market bottoms or tops.
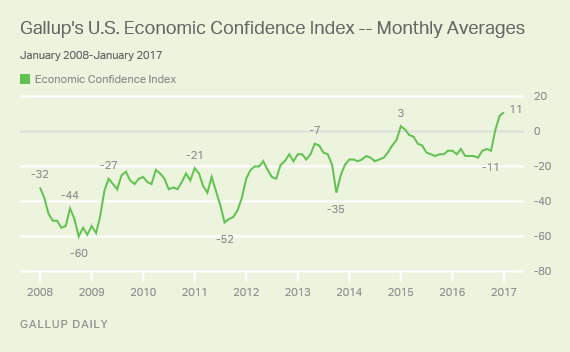
America Is Happy, Again!
A recent Gallup Poll reported that American’s confidence in the U.S. economy remained strong in January of 2017. Gallup’s U.S. Economic Confidence Index averaged +11, which is the highest monthly average reached in Gallup’s nine-year trend. I just came across this video that is enough to make you start thinking about changing your long term portfolio asset allocation – Watch Video Here
So, if you are looking for a simplified and highly accurate pulse on the markets, along with timely swing trades, I urge you to join my newsletter at www.ActiveTradingPartners.com.
Chris Vermeulen
https://thegoldandoilguy.com/wp-content/uploads/2016/08/crazymarket.gif300466adminhttp://www.thegoldandoilguy.com/wp-content/uploads/2014/11/tgaoglogo.pngadmin2017-02-14 06:08:182017-02-15 12:46:43The Trump Rally Is Just Getting Started!
My recent analysis of the markets has shown what I believe to be an explosion in market volatility set to starting happening between February 21, 2017 and March 30, 2017. The historical VIX cycles have been running about 18~22 week intervals for expansion and extreme volatility levels. The period August 2015 to January 2016 represented roughly 5 months. The period between January 2016 to June 2016 represented roughly 5 months. The period between June 2016 to Early November 2016 represented roughly 5 months (just a little short of 5 months in reality).
The period between November 2016 to the next volatility expansion phase, if this cycle continues, should be March/April 2107 at a target date range.
How will this relate to the US major markets? I currently believe the recent “melt-up” will stay in place until we have some catalyst that will change the direction of the markets. In other words, the path of least resistance in the US major markets is upward right now – at least till something changes that direction/sentiment. The VIX cycles may be related to some catalyst event or external foreign market event that could change the major market directions – nut only time will tell.
Currently, on the below DIA chart, I can state that my estimates for upside resistance is 210~212 based on historical price action. The reason I believe these levels will become upside target objectives is based on my understanding of price rotation, expansion and contraction as well as Fibonacci ratios. The actual number that I believe will be resistance is 211.63 and I believe this level will be reached in March 2017 or early April 2017.
Once this critical resistance level is reached in the DIA, then all bets are off in terms of the price retracement/rotation that may occur. Given historical price rotation as examples, I would estimate that the DIA could retrace a minimum of 6~8% ($13 to $17). A moderate price rotation would equate to a move of 10%~13.5% ($21 to $28). Beyond these expected levels of support, all bets are off in terms of downside potential. The closest major downside support levels are $178.25, $170.30 and $154.35 – these levels represent a greater than 15% total price retracement and would put us dangerously close to “Bear Market Territory”.
Of course, if the VIX cycles persist as I suspect, a massive increase in volatility will drive other markets into further trending or price rotation as well. The tech heavy NASDAQ (QQQ) has been mirroring the DIA and my projected top level is 128.15. Currently, the QQQ is at $126.54 – only $1.65 (or 1.33%) away from my expected peak level. After these peaks have been reached, I expect the major market to take pause and attempt to resume trending as we move closer to the volatility cycle period I suspect is driving the VIX (March/April 2017). It is because of this that I’m issuing this warning to my members to be cautious of extended risk or exposed positions as we near the end of February 2017. I believe the old term, “Beware the ides of March”, may be a harsh reality this year.
As I continue my extended analysis of the US major markets and commodity markets in relation to these VIX cycles, I will post “Part 2” of this article within a day or so. I wanted to get this out to all my members and associates so they were brought aware of the fact that the markets are beginning a phase of volatility expansion that should not end till near April 1st, 2017.
In short, what does all this mean? Well, it means now is not the time to be adding new long equity position for long-term growth. Going forward, its going to be all about active trading and focusing on my Momentum Reversal Method (MRM) and trading just the hot stocks and sectors for quick oversized gains.
On Feb 8th, myself and subscribers closed out our NUGT trade for a 112% profit that we entered December 16th.
This week we got long ERX at $33, and sold half the position 24 hours later for another quick 7.7% profit and there is still a lot of room for bigger gains there.
So, if you are looking for a simple and highly accurate pulse on the market along with timely swing trades I urge you to join my newsletter at www.ActiveTradingPartners.com – STAY TUNED FOR PART II…
Chris Vermeulen
https://thegoldandoilguy.com/wp-content/uploads/2016/03/stockmarket.jpg260390adminhttp://www.thegoldandoilguy.com/wp-content/uploads/2014/11/tgaoglogo.pngadmin2017-02-09 15:05:002017-02-09 15:05:00VIX Cycles Set to Explode in March/April 2017 – Part 1
One question that gold investors are asking now is, will 2017 be as spectacular for the yellow metal as it was in 2016? The short and sweet answer to this is YES.
The dollar, gold and the major U.S. stock exchanges will all see new highs. Gold is currently in a “complex corrective correction” while experiencing its’ last pullback, beforehand.
Both the short-term outlook and the long-term outlook for gold is BULLISH! Trumps’ victory win is a positive for gold bulls. Policy uncertainty and slowing growth, following a Trump win, will stoke the yellow metals’ price in 2017.
Gold prices have been under pressure since the Trump victory, but the long-term scenario for gold is that it is parabolic. The global economy is still in contraction. Global Center Bankers continue with monetary easing, leading to currency debasement. Interest rates continue to slide into negative territory in Europe and Asia. Gold’s investment appeal will encounter a period of time before it generates positive yields. Gold, as an investment, will once again be back in vogue. As prices rally, investment demand will only rise further, taking everyone by surprise.
The demand for gold jewelry has been declining within the large gold-consuming nations. The gold investors will call the shots in this new ‘bull’ market of gold. Current supply constraint has cushioned gold prices from the rally in the U. S. dollar.
This is the last great buying opportunity for gold before it makes its’ next historic run in 2017 and beyond.
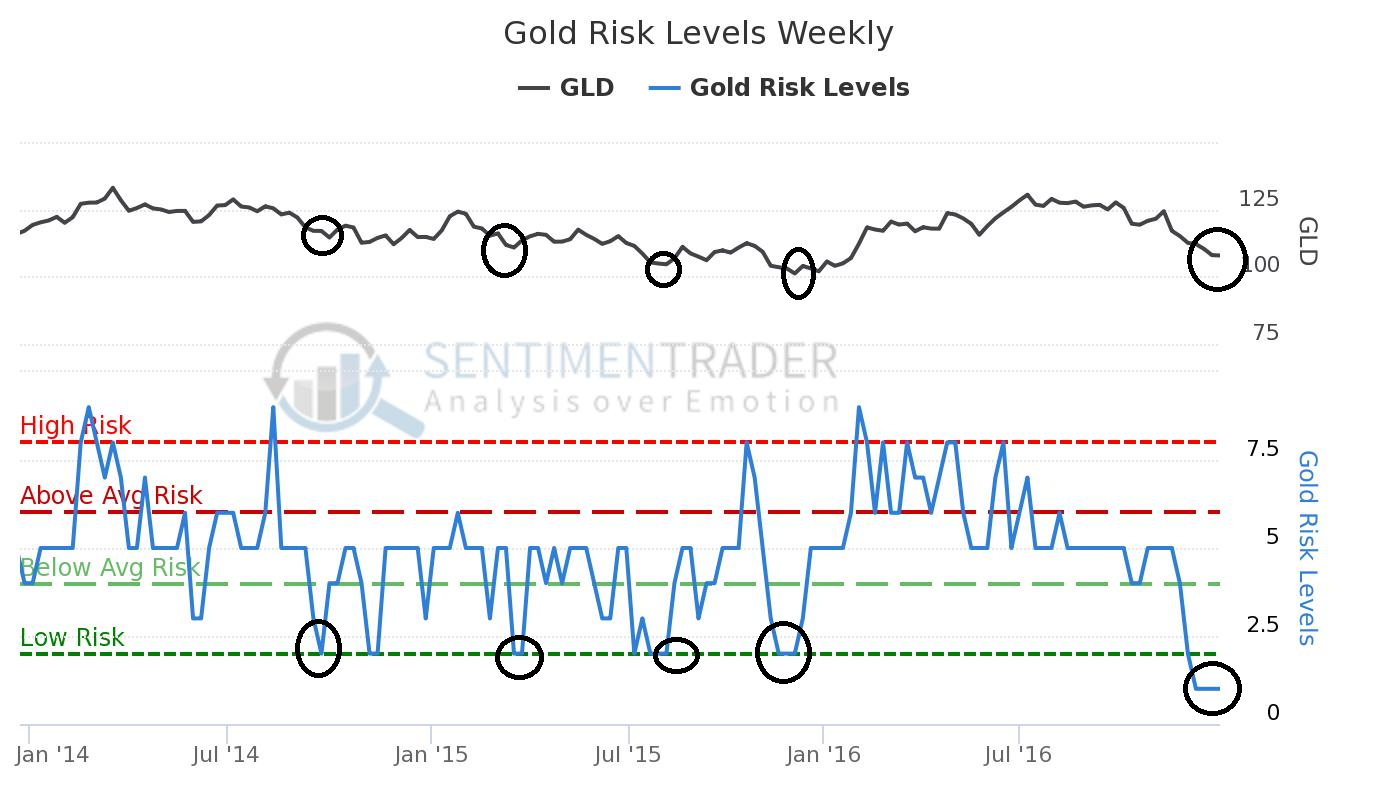
Excessive Pessimism: 2.0
THIS IS WHEN THE BEST OPPORTUNITY TO BUY GOLD IS PRESENTED
Latest Value(s):
– Last Reading: 1.0
– Extreme Values:
– Excessive Optimism: 8.0
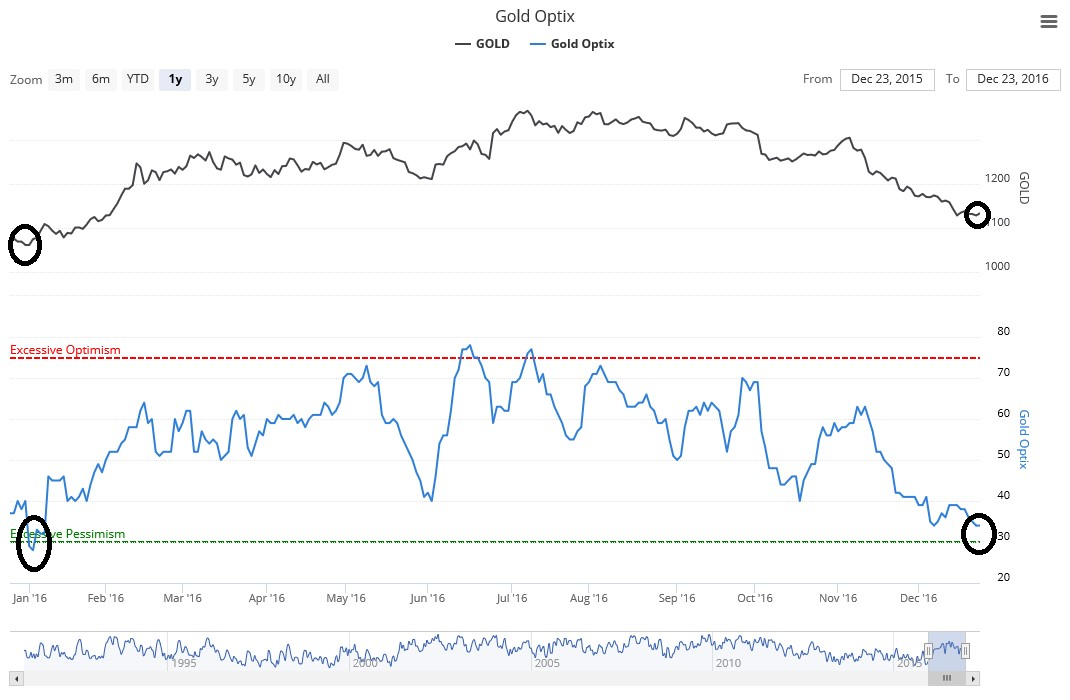
Excessive Pessimism: 30:
THIS IS WHEN THE BEST OPPORTUNITY TO BUY GOLD IS PRESENTED
Latest Value(s):
– Last Reading: 34.0
– Extreme Values:
– Excessive Optimism: 75.0
– Excessive Pessimism: 30.0
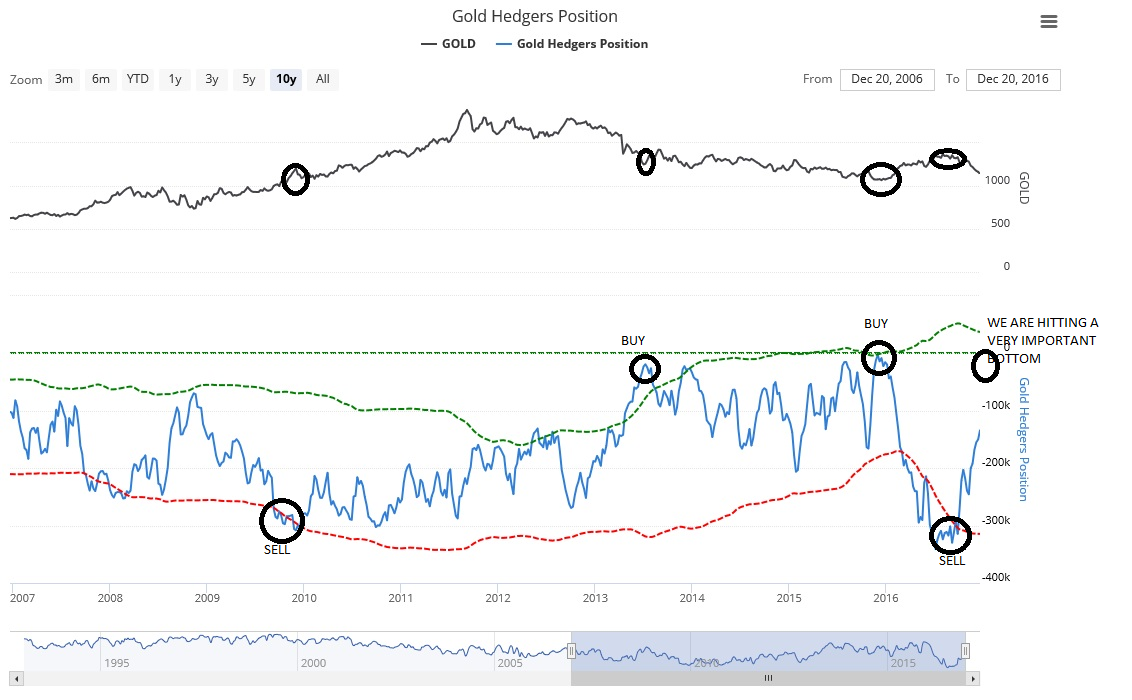
Gold Hedgers Positions
Latest Value(s):
– Last Reading: -134022.0
Extreme Values:
The green dotted line is 1 standard deviation above the 3-year average;
the red dotted line is 1 standard deviation below the 3-year average.
The Drivers!
A key factor that has driven investments in gold is the negative interest rate in Europe, Japan, Denmark, Sweden, and Switzerland. The sovereign debt of approximately one third of the developed countries traded with a negative yield while an additional 40% of the countries had yields below 1%.
Gold prices will be driven more by its’ value as an ‘investment asset class’. Gold will supersede investments in other ‘asset classes’ such as equity and bonds in due time.
The massive U.S. debt continues to spiral out of control. The Treasury Department’s printing presses are cranking out hundreds of billions of dollars in new money. European countries are imploding financially and the entire European Union is at risk of a collapse. These ‘geopolitical’ factors will be driving the demand for gold as a ‘safe haven”.
The global ‘retail’ investment market is well positioned for growth what with demand for gold in China, India, Germany and the U.S. for 2017.
Social media is a ‘key driver’ which is critical in both China and India. Financial advisors and financial websites are the key drivers in the U.S. markets. In Germany, banks play the most important influence; ‘Protect wealth against the system’. It has a competitive advantage compared to other investment options.
Jordan Eliseo, Chief Economist at precious-metals dealer ABC Bullion, says “Gold retreated about 18 percent from its year-to-date high. Afterward, it gained 26 percent in the first half of 2016. The decline so far, this year has been about 15 percent from its year-to-date high. Gold, is setting up for another rally in fashion like last year. The recent correction has already drawing in some investors to buy what they see as cheap metal.”
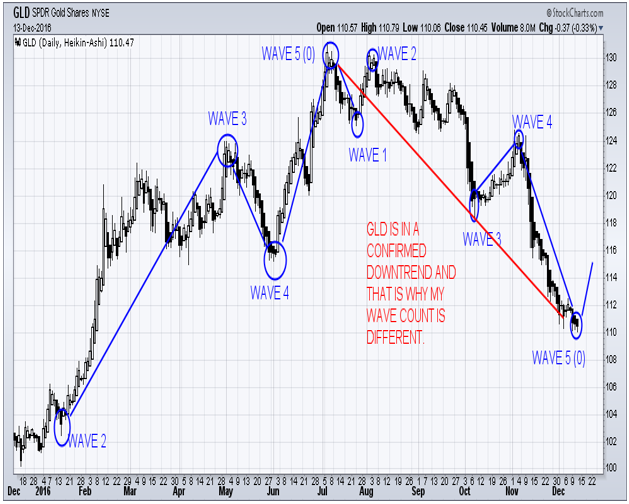
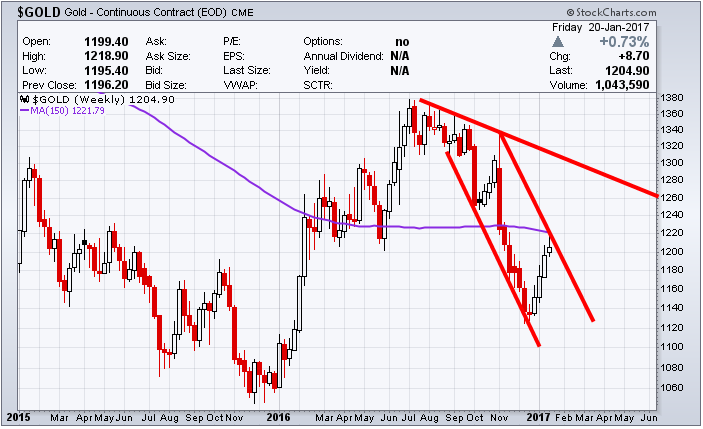
On December 14th my trading partner accurately forecasted the recent bottom in gold which you can see in this gold market forecast.
December 14th Forecast chart:
He then took things a step further and entered into a NUGT (3x long gold miners ETF) with subscribers and recently locked in 50% profit on the first half and is up over 70% on the balance as of Fridays closing price.
GOLD WEEKLY CHART REMAINS IN DOWNTREND
The constructing on this new infrastructure is going to require a lot of new money. The country is already close to $20 trillion in debt, so if the administration plans to make this one of their priorities, it is going to have to print it.
‘THE GREAT RESET’
Nixon closed the gold window on August 15th, 1971 and consequently, the world entered a new era. For the first time in history, all the world’s monies were unbacked fiat currencies, adrift on a sea of floating exchange rates. This stopped the redemption of currency for gold. Today, gold reserves are nothing more than an asset listed on the FEDS’ balance sheet. Gold had stopped being an integral part of our financial monetary system
At the top of international commerce, money managers had always known the dangers of ‘currency risk’, but now every currency has become a ‘soft currency’. Recognition of ‘currency risk’ seeped down into the knowledge chain, but on the street of personal financial management, despite it being 45 years later, not many have caught on to the concept.
To Live And/Or Continue Living the American Dream
Golds’ strength is in the role of ‘wealth protection’. It is a ‘safehaven’ and its ‘independence’ from the global financial system makes it a great investment for the future. Gold is still good value for those who do not own any to accumulate ounces.
In a few days, I will be publishing a piece talking about the shift in the economy and what I call “The Great Transfer of Wealth”. Be sure to join my free newsletter below to receive this special report!
https://thegoldandoilguy.com/wp-content/uploads/2016/08/goldimage.jpg500900adminhttp://www.thegoldandoilguy.com/wp-content/uploads/2014/11/tgaoglogo.pngadmin2017-01-21 08:13:472017-01-21 08:22:02The New Gold Rush Of 2017!