Posts

By: Chris Vermeulen – www.TheGoldAndOilGuy.com

It is that time in the presidential cycle that gets everyone emotional and concerned with the future outlook of the United States. While everyone has their opinion on whom they think is best for America, I promised myself a long time ago to keep my thoughts to myself for two key reasons. ONE: only 50% of Americans will agree with me J, and TWO: I am Canadian so I do not experience what Americans go through on a daily basis.

My thinking is if Obama wins then we will see Quantitative Easing continue. And with the recent positive economic numbers on Friday it should give some confidence to investors that things are SLOWLY stabilizing (Bullish for Stocks). But, if Romney wins then we could see Quantitative Easing be cut or eliminated which is obviously bad for equities.

So, let’s just jump into the charts of what I feel will unfold in the next few days and months.

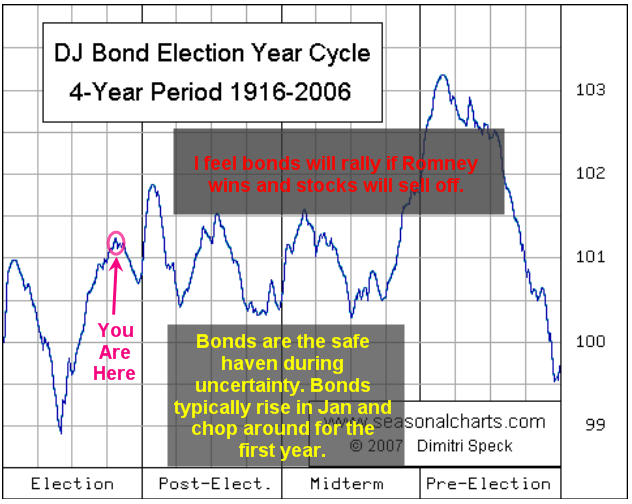
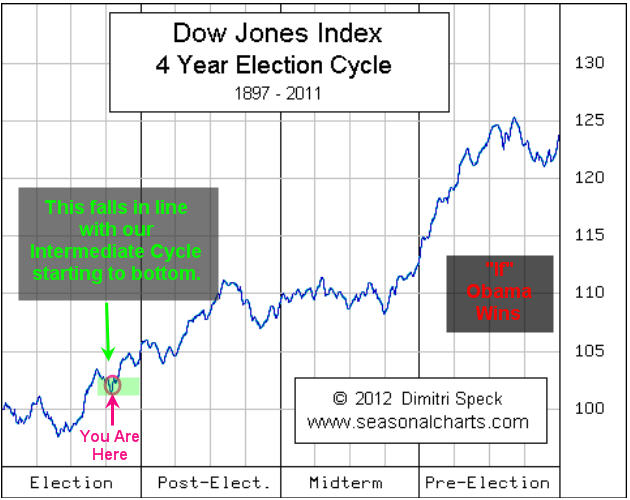
Using the season chart of the four year election cycle we can see what the Dow Jones Index has done in past election periods. Obviously every market environment is drastically different in each situation but overall we see stronger stock price. This is naturally a very emotional time for investors but once the election is finished most individuals become more confident simply because there is a leader that has four years to make things better and there is nothing they can do about it now and the campaigning and debating is over.

Dow Stocks Election

DIA – Dow Jones Industrial Average – Daily Chart:

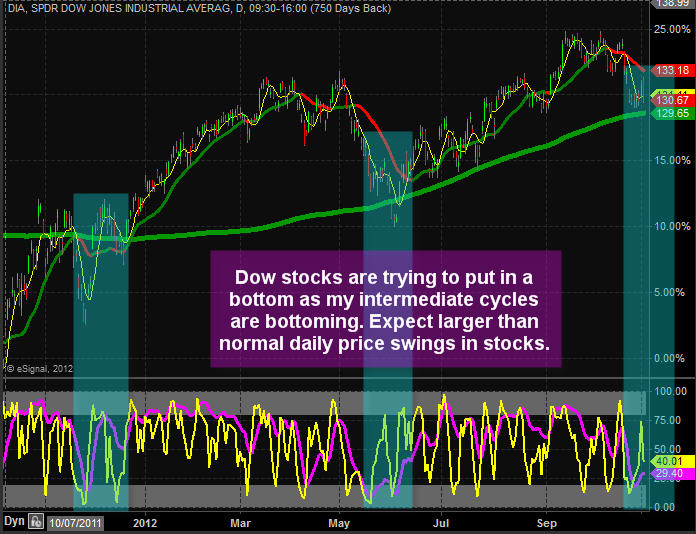
Looking at the chart of Dow DIA Index fund you can see a 5-6 month cycle in the market which has a positive skew. Just so you understand what a positive skew is I will explain.

Positive Skew is when the market is trending up making a series of higher highs and higher lows. Because there are naturally more buyers during a bull market each cycle upswing lasts longer then when the cycle down downswing. So you get longer rallies which sends your secondary indicators (stochastics, volatility, put/call ratios, advance decline line etc…) in the overbought levels for extended periods of time. Those trying to pick a top continually get their head handed to them. The focus must be on buying the pullbacks. Keep in mind volatility is higher which meaning risk per trade is higher. Overall in the long run you stand a much higher chance of making money trading with the trend than trying counter trend trades (picking a top).

So as you can see below it looks like the stock market will be trying to put in the bottom over the next week or two which falls in line with our election cycle. It is very important to know that during intermediate cycle lows is where some of the biggest drops take place. These sharp drops are what is needed to cleanse the market one last time to shake as many traders with tight stops out of the market before it reverses and starts the next rally. I would like to see a 1-3 day market sell off as that would be the signature bottoming pattern I like to buy.

DIA Exchange Traded Fund Trading

Bond Prices – Moving Against the Norm…

Bond investors are some of the most conservative people in the market. They do not like to take risks so they dump their money into bonds to make a tiny profit in exchange for low risk (volatility). The nature of these investors put more money into bonds as we enter the election because they are nervous about not knowing who will be in control of the country.

After the election finished some money flows out of bonds and into stocks because there is now a president and direction for the country. Generally come the new year investors move to bonds as the safe haven as they try to figure out what their game plan is for new year.

So looking forward to this week and the next 2 months I would not be surprised to see bond prices rise or trade sideways while stocks move higher. This analysis is based on Obama winning. If Romney wins then I feel bonds will rally much more and stocks could sell off.

Bond Sentimentpre Election

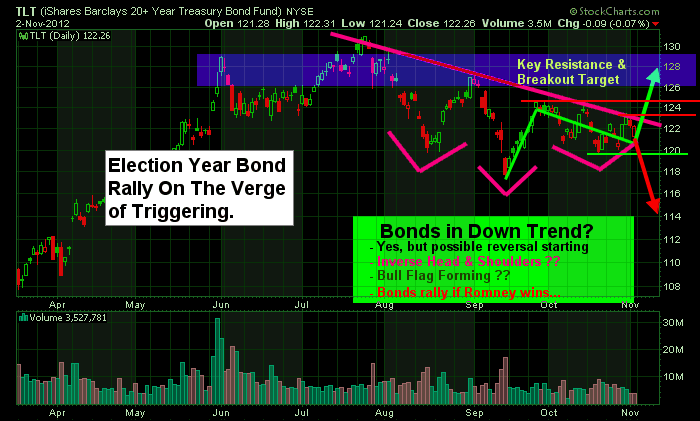
TLT Bond Exchange Traded Fund – Daily Chart:

Here is a chart of 20+ year bonds showing a possible reversal to the upside that could trigger as soon as next week. This chart is forward looking 1 – 2 weeks. Overall the trend remains down but if Romney wins I feel bonds breakout above the red resistance levels and trigger a new uptrend. You can follow my stock charts and ETF charts live every day here: http://stockcharts.com/public/1992897

Bond TLT Exchange Traded Fund Trading

Election Year Trading Cycle Conclusion:

Next week is going to be very interesting to watch unfold. I generally do not like to trade or invest before news of this magnitude so trade smaller sizes if you do as price action could be wild.

Get my Daily Trading Analysis & Trade Setups at: www.TheGoldAndOilGuy.com

Chris Vermeulen
Add to SocialTrade

Disclaimer:
This material should not be considered investment advice. Technical Traders Ltd. and its staff are not a registered investment advisors. Under no circumstances should any content from this website, articles, videos, seminars or emails from Technical Traders Ltd. or its affiliates be used or interpreted as a recommendation to buy or sell any type of security or commodity contract.
Our advice is not tailored to the needs of any subscriber so go talk with your investment advisor before making trading decisions This information is for educational purposes only.

Dec 2nd, 2009
The market has had a fantastic week so far for stocks and precious metals. The financial and energy sector are underperforming which is a concern, but we continue to hold our positions and will wait until a reversal to lock in our gains.

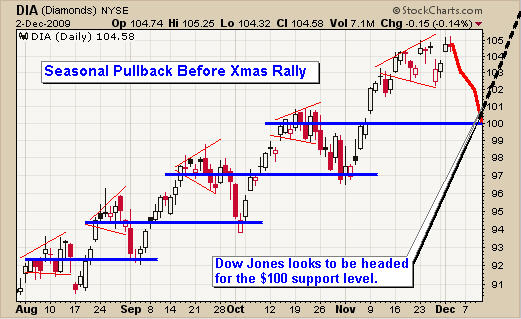
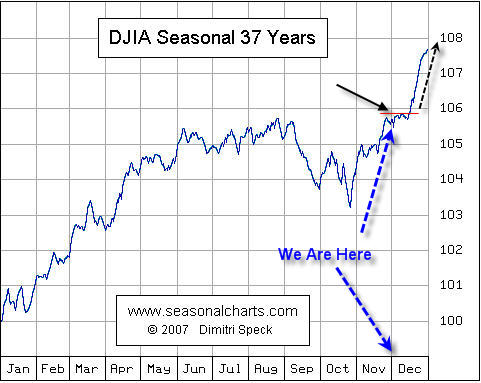
Things seem to be lining up for stocks and precious metals to take a breather, which is in line with the Dow Jones Seasonal chart below.

Let’s take a look…

Dow Jones ETF
You can see from looking at the chart the repeated pattern of price rallies, leading to exhaustion and a test of support, followed by another repeat of the pattern. It looks as if the broad market is setup for a test of support which could happen within 2-4 days. Then as we near the holiday prices will start to drift higher. This pattern occurs more often than not as seen on the Dow Jones Seasonal chart below.

Broad Market Holiday Rally

Broad Market Holiday Rally

Dow Jones Seasonal Trends
This chart clearly shows weakness in the first half of December and continued strength moving forward. This has not really happened in the past two years which means we are overdue for continued strength. ?

That being said, the previous two years were bear markets and we are now in a bull market. So the tendency is for buying to continue into year end.

Dow Jones Seasonal Trends

Dow Jones Seasonal Trends

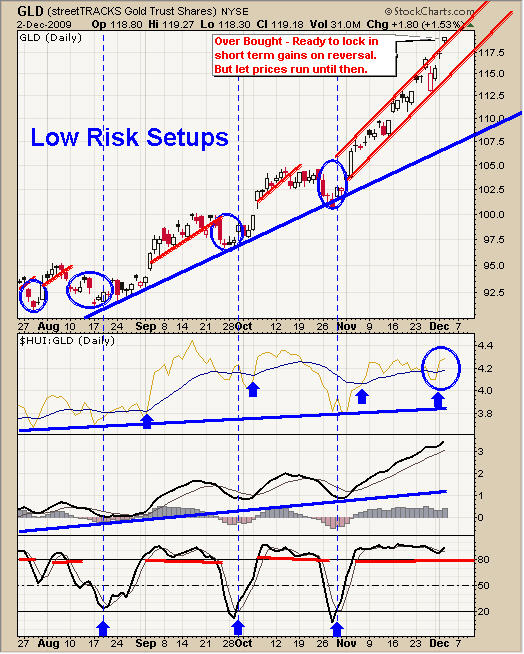
GLD ETF Fund
Gold continues to push higher surprising many of us. It seems as though money is rushing into metals and buyers are not particularly concern about price. While this is great for short term traders and those of us in the trade, we must remember that the faster things go up, the quicker they correct.

Don’t get me wrong, I don’t think gold is going to crash, I just think we could get a 10% correction before moving much higher. Gold is also trading near the upper end of the trend channel and could have a 2-4 day consolidation with the broad market before pushing much higher.

GLD ETF Trading

GLD ETF Trading

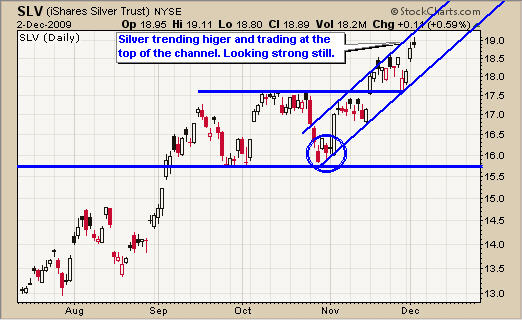
SLV Exchange Traded Fund
Silver has been underperforming yellow gold but is still a solid investment. It is also trading near the upper end of the trend channel and could have a 2-4 day consolidation with the broad market.

Silver ETF Trade

Silver ETF Trade

USO & UNG Funds
Oil continues to flag from its breakout back in October. This is a bullish pattern. Last Friday we saw oil open much lower then rally back into the trend channel. This is called an outside day and many times this happens to stocks and commodities as it shakes out the weak traders before starting another rally higher. We will keep a close eye for any low risk entry point.

Natural Gas had a nice rally last week which I mentioned looks a lot like a short covering rally. The price action this week suggests it was and has now made a new low. Today on CNBC it was reported that a new source of natural gas has been discovered. This resource is 20 times larger than the biggest source in the US. Enough gas to last the US over 100 years. This added to the selling on both natural gas and oil today.

Energy ETF Newsletter

Energy ETF Newsletter

Trading Conclusion:
Precious metals continue to perform well and it’s important to note that PM stocks are now moving higher with gold. They have been lagging for some time but are on fire again. Great to see!

The Dow Jones index and several others look ready for a breather. The timing of these overbought charts bodes well for the seasonal December pause before the holiday rally. Time will tell.

Energy and financials are both underperforming the market and without their participation we will not see the indexes move much higher.

Continue to hold precious metals positions but be ready to lock in profits if we see the market reverse sharply. I am watching energy for a play but no setups at this time.

Check out my Free ETF Trading Newsletter:

Chris Vermeulen
www.TheGoldAndOilGuy.com

The market continues to whipsaw traders out of positions as volatility rises. I have put together a few charts to show you where each of our commodities are trading along with the SPX (SP500 index).

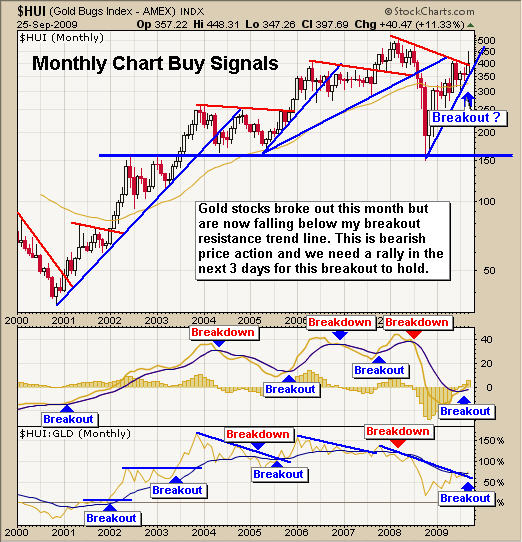
My Gold Stock Breakout Model – Monthly Chart
I use this chart to keep my big picture trades on the right side of gold. I found that gold stocks tend to lead the price of gold so watching this gold stock index on the monthly, weekly and daily charts can provide me with short term tops and bottoms for trading gold bullion, GLD or DGP exchange traded funds.

The monthly chart clearly shows the rally in stocks has now sold back down to my resistance trend line. If we do not get a rally this week in gold stocks, then I think we could see gold trade sideways or down for several months.

HUI Gold Stock Newsletter

HUI Gold Stock Newsletter

GLD Gold ETF Trading Fund – Newsletter
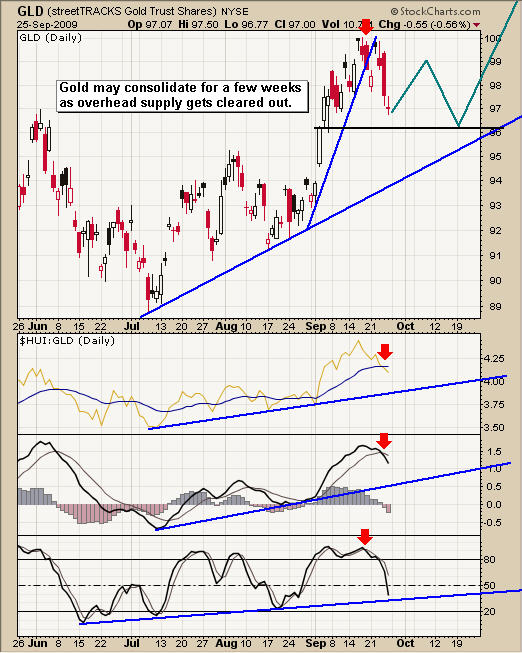
The daily gold bullion fund shows the recent price action and what I think could happen in the coming weeks. In the past couple days gold has moved to a short term support level where I think we could see buyers step in.

We took some profits near the high and continue to hold a core position until we have another technical breakdown or new setup to add more to the position again.

GLD Gold ETF Trading Newsletter

GLD Gold ETF Trading Newsletter

SLV Silver ETF Trading Fund – Newsletter
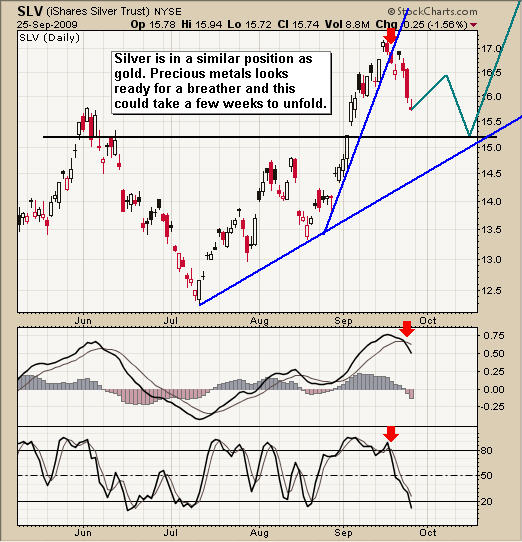
Silver is in the same boat as gold. We have taken some profits and are still holding a core position with protective stops in place just incase the market does head lower from here.

Silver SLV ETF Trading Newsletter

Silver SLV ETF Trading Newsletter

USO Crude Oil Trading Fund – Newsletter
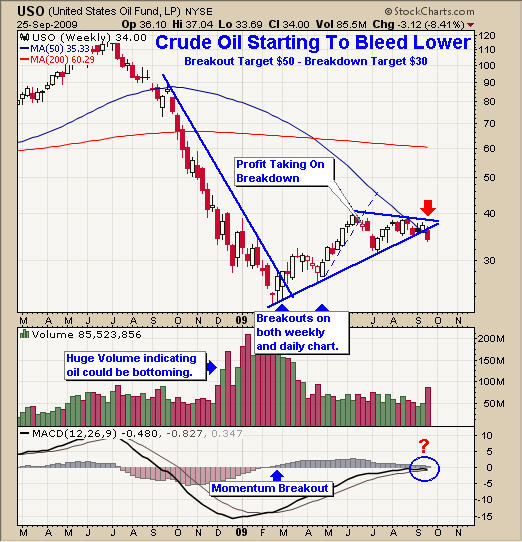
Crude oil started to bleed lower last week as the price sliced through the multi month support trend line. Volume shot up as stop orders get triggered on the way down. We finally have a move outside of the pennant formation that has been in place for several months. Now we can start looking for a low risk setup for trading crude oil again.

Crude Oil USO Trading Newsletter

Crude Oil USO Trading Newsletter

UNG Natural Gas Trading Fund – Newsletter
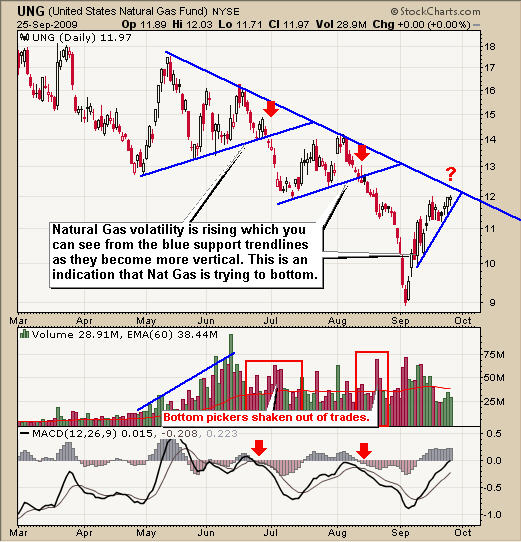
Natural gas has really come back to life. I mentioned on September 2nd that natural gas (UNG) looked like a buy between $9 – $9.50 and it has now rallied 25% since that point. But stepping back and looking at the chart we can see resistance is hovering over head between the $12 – $12.25.

I may send out a setup for a short play if we get one but I feel the heavy sell off in August was the final wave down, flushing out traders. Speculative traders seem to have moved into natural gas and I think they will continue to buy it for some time. Pullbacks will be sharp but most likely followed with more buying as we enter the cooler months of the year.

Natural Gas UNG Trading Newsletter

Natural Gas UNG Trading Newsletter

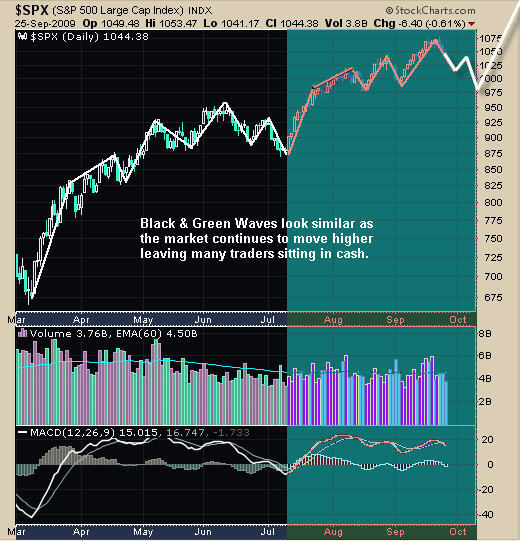
SPX Index Trading – Active Trading Partners
I thought that I would show a quick picture of the SPX because it shows the psychology of traders and how it repeats it’s self over and over. The black and green waves are virtually the same patterns.

I feel as though the market is ready for a larger pullback than what we had in June/July but my focus will be to buy in the oversold dips and lighten my positions in overbought conditions (scaling in and out of positions) until the trend confirms it has reversed.

SPX SP500 Trading Newsletter

SPX SP500 Trading Newsletter

My Market Trading Newsletter Conclusion:
Gold stocks are pulling back and precious metals continue to move with the overall market action. I do feel that gold and silver will break this relationship and start to move higher in the coming months but until that happens I remain cautious with my positions tightening my stops.

Crude oil is starting to come alive and I am now looking for some low risk setups for energy related funds. Last week’s technical breakdown could provide us with a big move in the coming months.

Natural Gas continues to hold up but is now trading near resistance. Depending how many spec traders there are still lingering around (as most lost their shirts in the recent months), will dictate how much higher natural gas will move. The 25-30% rally in the past month has been very powerful and this could be just the beginning. I am now waiting for another setup that could be a long or a short trade depending on what happens next.

If you would like to get my Bi-Weekly Trading Reports via email please visit my websites at: www.TheGoldAndOilGuy.com for commodities and www.ActiveTradingPartners.com for Stock Trading.

I hope everyone had a great weekend!
Chris Vermeulen