Posts

March 26, 2010
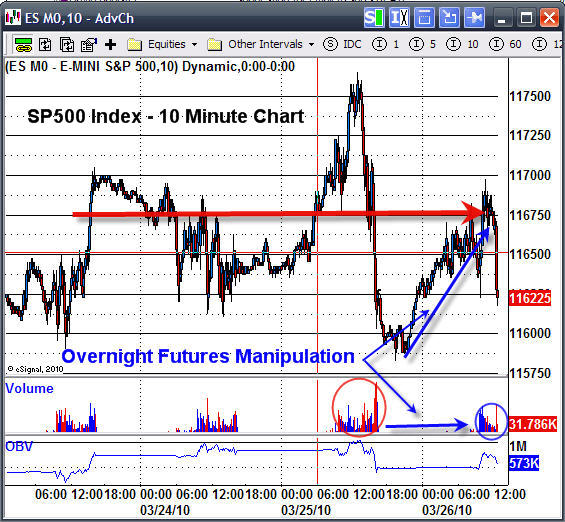
The market gapped higher this morning after yesterdays heavy selling. At this time the market (metals and indexes) are trading at resistance on light volume. This tells me people are a little spooked from yesterday and just do not want to buy at these lofty prices.

.

Stock Market Training Education

I am trying to provide you with more insight and trading tips/education because I know many of you enjoy it. So here is something some of you may find interesting…

Over the years I have found several things which happen repeatedly in the market. I always found it interesting that in an uptrend the market/commodity or stock tends to gap lower at the open the next day. And during a down trend the market tends to gap higher at the open.

Why is this? I don’t know for sure… but my thoughts are that the smart money (big guys & professional traders) manipulate the market using futures to artificially lower prices so they can buy more the at lower prices before everyone else jumps in. It’s similar but in the reverse during a bear market. Prices gap up so they can short more shares at a higher price before everyone starts selling again pushing prices lower.

I could be way off here as this is my personal opinion but I see it happen all the time… so whether I am right or wrong in my theory the fact is this price action happens.

.

Take a look at the SP500 & Dow Jones Futures Charts:

.

Market Gap Trading Conclusion:

In short, the market gapped up today (not good)…
I see the dollar is now trading at a short term support level and metals are trading at resistance. So maybe something will come out of this for a short play…

I hope this short reports was of use for getting a feel of how the market moves and what I am looking for in low risk setups.

Have a great weekend everyone. I don’t see anything tradable other than this intraday low risk setup which just broke down as I write this sentence,  fun stuff…

Be sure to get notified about my new day and swing trading service I am launching April 6th by entering your email address in the form below:

Chris Vermeulen
www.TheTechnicalTraders.com

Disclaimer: I am currently short SP500

Jan 29th, 2010
I thought I would put this more detailed report on finding and trading low risk setups for gold, silver, oil indexes etc…. In short it does not matter what time frame you trade with or if you trade exchange traded funds, futures contracts or CFD’s (contract of difference).

This type of trading setup works for virtually every investment but I mainly focus on trading: Gold Futures, Gold ETFs, Gold CFD’s, and the SP500 & Dow 30 futures, ETF’s and CFD’s as I find they are very accurate and profitable.

Obviously swing traders who watch the daily chart will have few trades because it takes weeks and months for these low risk patterns to form. This is the reason I am using short term intraday charts and using a setup from yesterday (Thursday) for demonstrating my trading setups.

My Short Trading Setup – Rough Guideline
1. Trend on 2hour and 1hour charts are down
2. Increased volume during sell offs, and light volume on rallies/rising prices
3. Entry is best at Fibonacci retracement level which is also at a previous resistance level.
4. Set Stop just above the resistance level you are expecting the current price to stop at. Exit if this top is penetrated and wait for a new opportunity.
5. Cover half of your position just before the investment reaches the first level of support to lock in gains and reduce overall risk.
6. Once the price of the investment starts to make a new short term high exit the balance of the position. Shown in the charts below.

DIA – Dow 30 Index Fund
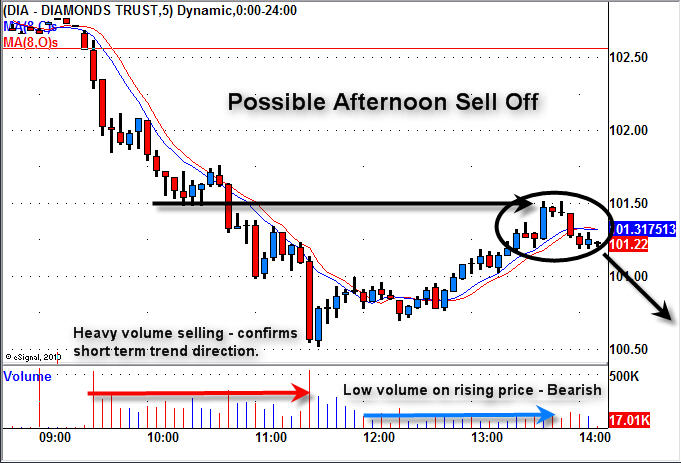
This is a chart I sent to members on Thursday pointing out the market weakness. We had a nice sell off in the morning and the price drifted up on light volume later in the afternoon. This low volume drift is crucial to recognize as it tells you the general public is buying. This is what Big Money likes to see. After they crush the market with their large sell orders in the morning they take a break allowing regular retail traders/investors move the market back up before the big sellers start dumping shares again.

So, I am looking to short at a resistance level in hope the big sellers step back in.

DIA – Dow 30 Index Fund – End of Day
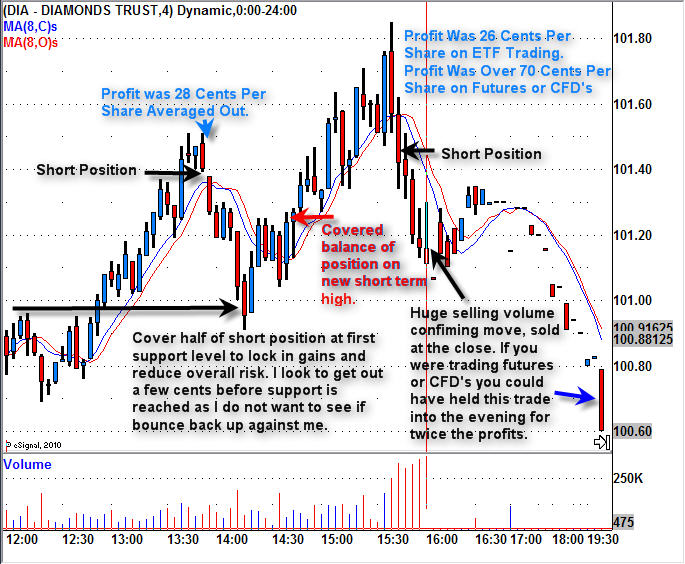
This chart quickly shows the two intraday setups for shorting at resistance levels. Both trades worked out well but wait until you see the results of trading with futures or CFD’s shown later.

Anyways, the first short was a great play but we did not see the big sellers step in, which led to a reversal and the price continued to move higher taking us out for a small profit.

The second short had huge selling volume indicating sellers were back in control. This play we held into the close. The next chart shows how this is done.

DIA – Dow 30 Index Fund – Step By Step Play
The chart is a little small to see but it explains and shows how these low risk setups should have been traded according to my trading strategy to maximize gains while minimizing risk.

Dow 30 Futures & CFD Day Trading Signals/Setups
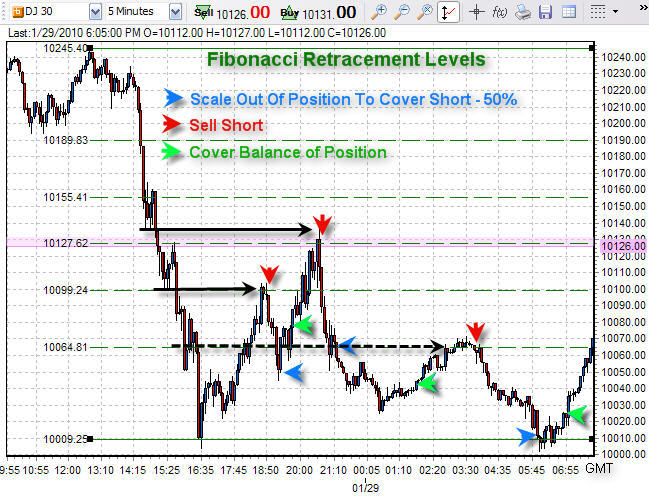
This is the same Dow 30 index but is zoomed out so we can take advantage of the 24 hour price action which the futures market trades.

Here I show the Fibonacci retracement levels which happen to be at resistance levels from earlier that day.

During regular trading hours the trades were the same as the DIA etf above, but with futures trading you can traded 24 hours a day. So with the last ETF trade I talked about earlier we only made 28 cents profit per share, but with futures we could have held this position until it fully matured netting a total gain of 40 cents per share. This is 42% more profit simply by trading with futures or CFD’s.

To make things more exciting there happened to be another fantastic trade after dinner making us another 45 cent move. These gains may not sound like much but it equals $1000 – $3000 in profits depending on what you are trading ETF’s, Futures contracts, or CFD’s.

End of the Week Trading Education and Wrap Up:
Overall this week was nothing short of awesome!
The overall market is trying to hold up but sellers continue to pull it lower. Unless there is a strong rally into the close on Friday I figure Monday will gap down because the daily charts are very scary looking. This is what makes the general public panic out as it flushes out the remaining sellers, just before the market makes a sizable bounce and possible rally to new highs.

If you are interested in getting more intraday analysis and setups be sure to join my free newsletter for Day Trading:

Chris Vermeulen
www.TheTechnicalTraders.com

Active Trading Partners launched its brand new trading and investing commentary service on July 15th, 2009. In the short seven weeks since we launched, ATP has produced numerous stocks that have gained, 30, 40, 50, 60, and even 100%. Below are some excerpts from actual ATP research postings on our new service for Partners/Members. Most recently, we recommended JAZZ last Tuesday, 9/1/09 and it has risen as much as 63% in one week.

Are you getting quality advice, market updates, regular follow ups on your positions, and booking gains on an 80-90% success rate? If not, perhaps you should try a subscription to ActiveTradingPartners.com, where we are unmatched in our returns to partners.

We are limited to 200 subscribers and are nearly filled now, so act now. For $249.00 per month you get 8-10 new positions alerted per month, or about $25.00 per alert. With average historical returns of over 20% per recommendation. $10,000 put into each of our positions since the launch would have returned over 100 fold your $249.00 investment per month.

Samples below:

August 4th, 2009- LRR.TO/LRLMF $1.66
…Linear Gold is a micro cap gold stock, and I usually will hesitate to put these on the ATP service, but this one looks like a great value going forward, and I like the chart set up here as well…Shares outstanding are 34 million. That’s a market cap of 58 million Canadian, or less than 2x future projected net cash flows. They have 24 million in the bank, 0 debt currently, and multiple drill projects. They have leverage later on to future gold price increases, and position to acquire other projects/exploration plays. I’m not seeing a lot of downside here.
Results: Linear Gold ran to $2.28 17 days later for a 37% gain.

August 14th- CRXX- $1.05
… the “Saucer” chart is bullish because of the general sideways movement over a long period of time. This is a transfer of shareholders from old to new, re-setting a large base for the stock. A break over $1.10 could trigger a run back to $1.34 a recent spike high on good news several weeks ago. Also, there is a huge “gap” at $3.00 a share above. This means there is an air pocket where technically there are no sellers until $3.00. The only sellers will be the traders who bought recently, or buy near term. To say that I am excited by the long term prospects of this merger would be an understatement.
Results: CRXX ran to $1.34 within a few days for a 25% gain. It has since risen as high as $1.92 on September 1st, for a 75% gain in 3 weeks for ATP.

August 18th- VICL- $3.35
…with Federated Kauffman paying $3.63 a share just a few weeks ago for 3 million shares, they brought their total to 5.4 million shares. The stock has drifted down and volume has dropped from a 90 day average of over 1 million to just 350,000 or so a day lately. This normally precedes a shift in sentiment and price movement, quite simply the crowd has moved on.
We have an ATP proprietary “Fibonacci Intersection” on Aug 17th, and to ATP it means the stock bottoms around that time and it’s time to start accumulating positions… A break over $3.40 will probably start a new bull trend in the stock.
Results: On September 3rd, 16 days later, VICL hit $5.40 for a 61% gain

August 20th- SPPI- $6.27
SPPI- …When the stock hit 6.05 earlier this week, it was at the bottom of proprietary indicators I have developed as reliable for pivots. I mentioned earlier this week that I had picked some up at 6.12 and 6.15. This afternoon I was an aggressive buyer at a 6.27 average per share and building a position… The chart appears to be very bullish and very oversold at the same time. If I was to hazard a guess, I would see a move up to 6.80-6.90 again, then a pullback, and then a breakout over 7 with a run.
Results: On September 4th, SPPI hit $9.00 a share for a 43% gain in two weeks.

September 1st- JAZZ $7.29
The stock closed 8/31/09 at $7.29 a share and has been in a general trading range for about 5 weeks now. We also have a 5 day reverse head and shoulder pattern, often a leading indicator of a move up. ATP research would not be surprised to see a move towards $10.00 per share over the intermediate time period.
Results: On September 4th, Jazz soared over $10.00 per share for a 40% plus gain in 3 trading days for ATP

September 2nd- RINO $12.60
…accumulating a position in RINO here in the 12.50-12.90 window. The volume has completely dried up on the stock after the recent run from mid 10.70 to 14.88. The pullback is a typical “B Wave” pullback in an “A-B-C’ move to the upside. This actually retraced a perfect Fibonacci 61% retracement of the recent swing move up… The valuation remains very cheap, the company is very under-followed.

Results: Stock closed at $14.27 the next day as Rodman and Renshaw initiated coverage with a $22 target. 13% return in 24 hours.

Please visit our website for more information: www.ActiveTradingPartners.com
Chris Vermeulen