This shortened holiday week has been full of crazy price rotation, political intrigue, surprise news events and, we are certain, full of headaches for some traders. Still, we managed to pull out four consistently profitable trades for our members by sticking to our proven trading systems and deploying effective position sizing techniques. Not a bad week for us at all.
Today, we are writing this research post to highlight that price is still not “out of the woods” in terms of price structure and/or price rotation. Yes, there was quite a bit of external news that drove prices higher on Thursday and Friday (BREXIT, Earnings, and China decreasing the lending rates as well as decreasing bank asset levels in an effort to prompt more lending). These news items continue to drive price action and rotation. The VIX has settled at 15.00 as of Friday – the lowest level seen since early August 2019. Our opinion is that this is just a brief pause before more chaos hits the markets.
The BREXIT news was straight out of a suspense novel. At the very last minute, a coalition of political interests changed direction in an effort to stop the NO-DEAL BREXIT that seemed to be almost a sure thing. We don’t have any more information than what is printed in the news publications, but we believe the NO-DEAL BREXIT will happen this year.
Earnings were mixed with some interesting surprises. Jobs data came in relatively strong on Friday with higher earnings and higher working hours, yet job creation levels fell a bit from expected levels.
China seems to be relaxing its bank restrictions in an effort to jump-start their local economy. We read that current debt levels are 300% of GDP in China (and that only accounts for debt that is stated in official economic data). If one were to include the shadow banking system and corporate debt/bonds, we believe it could be as high as $425% of GDP or higher.
Then we have multiple countries in crisis (risk of bankruptcy) where the IMF is likely to try to develop some type of “bailout” solution. The most recent is Argentina. Additionally, the IMF has introduced new Cryptocurrency regulations that may stifle some emerging market ICO and existing Crypto operations as the IMF attempt to get a handle on these unregulated threats to traditional currency policies.
And we are just scratching the surface so far… What next – right?
Well, here is a Weekly ES chart highlighting the Fibonacci price structure that appears to be, very much, in need of establishing fresh new highs in order to confirm this continued bullish trend. Right now, very similar to what happened in 2018, we are nearing an October date, near all-time highs, with fresh signs of weakness appearing throughout the global economy. Trade issues continue, people are talking about recessions and Gold and Silver have started an incredible upside move. Will the US stock market continue to rally from this point or rollover into a price correction?
It all depends on what happens over the next 2+ weeks and if the “capital shift” that we have continued to suggest is driving capital in the US stock market hasn’t broken rank yet. If foreign capital is continuing to pour into the US stock market for safety, then we may very well see another attempt at new all-time highs. If the recent weakness has spooked some investors out of the markets as Gold and Silver have caught their attention, then this capital shift may be much more muted at this time – meaning price volatility is much more of a concern.
SP500 Stock Index – Weekly Chart
The ES price will attempt to either move to new all-time highs or roll lower and take out the 2728 level. We believe the key to this future direction lies in which news items play out over the next 2+ weeks and if the price is able to return back to a “true price exploration” mode (without the news events).
Weekly Transportation Sector Index Chart
This weekly TRAN, Transportation Index, highlights a broader picture of why our researchers are still concerned about a market correction. The fact that the price peaks have continued to move lower as a series of lower high price peaks is very concerning.
This is indicative of a downward price trend or a trend that is consolidating lower. The strength of support near 9695 is the only real strength we see in this TRAN chart in terms of “support for an upside move”. The TRAN chart price must break this downward series of lower price peaks in order for the US markets to really enter a new bullish price trend. Until that happens, we continue to stay worried that the foundation of the US markets may be crumbling below our feet while the party rages on in the US major indexes.
CONCLUDING THOUGHTS:
Our August 19th prediction of a breakdown event has obviously been invalidated by this recent upside price move. Depending on which way price breaks out of pattern will either validate or invalidate our expected forecast. As of right now, it looks like our August 19th prediction has been invalidated and we were wrong thinking it would break down. With that said, we had three winning trades we closed out last week for solid profits and a new high water-mark for our trading portfolio.
Although, until the US stock market rotates higher to establish new all-time highs, we are not out of the woods yet. This recent upside price move has not completely invalidated the chance of a breakdown because we have not already validated “new price highs” which are required in Fibonacci price theory. Right now, we are in the midst of volatile price rotation and we are loving every minute of it.
This is the type of price action that is perfect for skilled technical traders. Trade setups continue to pour into our systems. As we stated near the top of this article, we had a series of great trades this week resulting in nearly +15% total profits for our members. If you are a skilled technical trader, then this is the market for you to really shine.
Be prepared for these price swings before they happen and learn how you can identify and trade these fantastic trading opportunities in 2019, 2020, and beyond with our Wealth Building & Global Financial Reset Newsletter.
Join me with a 1 or 2-year subscription to lock in the lowest rate possible and ride my coattails as I navigate these financial market and build wealth while others lose nearly everything they own during the next financial crisis. Join Now and Get a 1oz Silver Round or Gold Bar Shipped To You Free.
I can tell you that huge moves are about to start unfolding not only in currencies, metals, or stocks but globally and some of these supercycles are going to last years. A gentleman by the name of Brad Matheny goes into great detail with his simple to understand charts and guide about this. His financial market research is one of a kind and a real eye-opener. 2020 Cycles – The Greatest Opportunity Of Your Lifetime
As a technical analysis and trader since 1997, I have been through a few bull/bear market cycles. I believe I have a good pulse on the market and timing key turning points for both short-term swing trading and long-term investment capital. The opportunities are massive/life-changing if handled properly.
https://thegoldandoilguy.com/wp-content/uploads/2019/09/21-1.png470850adminhttp://www.thegoldandoilguy.com/wp-content/uploads/2014/11/tgaoglogo.pngadmin2019-09-09 13:29:102019-09-09 13:29:10Price Structure Still Suggests We Are Within Volatile Rotation
Reading the new today of the riots and protests in Hong Kong as well as the military action between Iran and Israel suggests to us that the metals markets are poised for a very big run this week and possibly much further into the future.
This type of Chaos creates a level of uncertainty in the global markets that will prompt a massive surge in the precious metals markets as traders and investors continue to pour into precious metals as a means to hedge against fear and weakness in the global markets. At this point, we believe a move in Gold could easily target $1640 or higher and Silver could target just under $21 over the next 5 to 10 days. This type of move would represent a +7 to 10% rally in Gold and a +10 to 20% rally in Silver.
Pay attention to how the ES, NQ, and YM react to trading as markets open on Sunday and Monday evening as well as the news events related to these issues. Any escalation of tensions and fighting between parties throughout the world will likely shed shock waves throughout the global economy as well as prompt a contraction in price levels.
We attempted to warn all of our followers that the August 19th breakdown super-cycle event would likely present a massive potential for a price correction to the downside. These super-cycle events operate on a much broader scale and scope than most people realize. A delay of 20 to 30 days for an event to begin is equal to a span of 10 seconds in the larger scope and perspective of these bigger events. Pay attention as this move really begins to play out over the next 25+ days.
Weekly Gold Chart
This weekly gold chart has followed our expectations from April/May 2019 almost perfectly. Our original target of just below $1600 has almost been reached. Now, with the global chaos playing out in China, Hong Kong, and other locations, we believe Gold could rally well past the $1600 and possibly move as high as $1640 to $1675 before attempting to stall and rotate.
What is interesting is that the price of gold is hitting new highs is most other currencies. This is something we will talk about in another article here shortly, so be sure to opt-in to our Free Market Forecast and Trade Ideas Newsletter
Weekly Silver Chart
Silver, which has continued to impress even the most passive traders. It has continued to outperform Gold over the past 30+ days. Overall, our original target range of $18.75 – $21 is still valid, but we believe the true upside potential in silver is well past $34. Right now, we believe Silver could rally well past $24 as the chaos in the foreign markets rattles global investors.
CONCLUDING THOUGHTS:
If you followed our research over the past few months, you would have already known about these setups and trades. If not, now is the time to pay attention. The markets are going to react to this foreign market chaos by attempting to find true price valuation levels related to the fear and future economic expectations of the entire market. Get ready for some really big moves over the next 8+ weeks.
As we’ve been suggesting for more than 12 months, 2019 and 2020 are going to be fantastic years for skilled technical traders or subscribers of our Weal Building Newsletter. The potential for big trades (20% or more), like our recent UGLD 24% trade, will continue to set up in different sectors and global markets. All we need to do is stay on top of the opportunities to find ways to profit from these moves.
We believe our super-cycle research and other proprietary modeling systems are suggesting that price weakness will dominate the markets for the next few months. Ride my coattails as I navigate these financial market and build wealth while others lose nearly everything they own during the next financial crisis and recession.
In short, you should be starting to get a feel of where commodities and asset class is headed for the next 8+ months. The next step is knowing when and what to buy and sell as these turning points take place, and this is the hard part. If you want someone to guide you through the next 12-24 months complete with detailed market analysis and trade alerts (entry, targets and exit price levels) join my ETF Trading Newsletter.
https://thegoldandoilguy.com/wp-content/uploads/2019/09/51.png470850adminhttp://www.thegoldandoilguy.com/wp-content/uploads/2014/11/tgaoglogo.pngadmin2019-09-03 13:57:572019-09-03 13:57:57Global market Chaos means Precious Metals will Continue to Rise
Reading the news this weekend and watching the chaos in Hong Kong, one has to wonder how this violence and disruption in commerce is really affecting the Asian and global markets. Many different news sources are already reporting that Chinese economic data continues to show weakness over the past 4 to 5+ months.
Additionally, Hong Kong, being a strategic source of income and business for the western world, has been disrupted with riots, protests and not violence as a result of a political battle between Chinese rulers and local Hong Kong residents.
It seems obvious to anyone outside of this situation that neither side is about to stop their actions any time soon and that means we are going to experience even further disruptions to the global markets and local markets. Right now, our greatest concern is that the disruption in economic activity in China/Asia will result in a “cold” in the US and other foreign markets.
Our August 19th call for a potential US market breakdown was stalled because of recent news that China and the US would begin talks again attempting to resolve the trade issues. Yet, we know these talks may last many months with no real progress in terms of lifting tariffs or real concrete outcomes. We don’t believe the US is going to remove tariffs or ease up on trade-related factors until we see real progress made by China. This would suggest we are in for a long-haul in terms of real relief in the markets.
Our research team still stands behind our August 19th breakdown call. Our super-cycle research suggests that the US and global markets are poised for a price breakdown and we believe the recent news events have stalled this price move. Particularly, we point to the nearly -1100 point price drop on August 22 through 26, just days before the news that China was willing to engage in new talks with the US about trade. This move would have likely continued to break lower, as we predicted, had the Chinese not announced their intent to try to relieve pressures on the economy and the global economy. Before we get into more details, be sure to opt-in to our Free Market Forecast and Trade Ideas Newsletter
We may have to give the Chinese credit for moving the markets by simply making an announcement that they were “willing” to engage in talks at a critical time when a price breakdown appeared to be executing. That one statement changed the way the markets perceived the future. Global traders rotated to a perspective of “hey – maybe the Chinese are finally going to negotiate a solution”. We believe this is a stall tactic while the Chinese attempt to work another angle to protect their markets/assets.
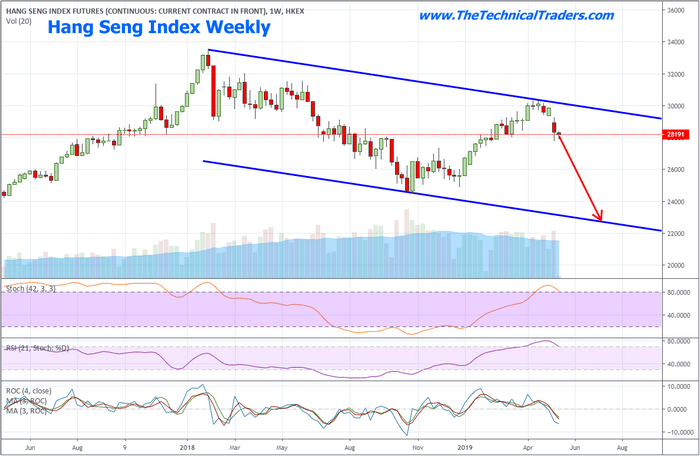
Hang Seng Index Weekly Chart
The Hang Seng Index Weekly chart highlights the extreme weakness of price over the past 12+ week. A dramatic downturn from $30,000 to $25,725 has transpired and support near a previous trend channel is now acting as a final floor for price. Once this level is broken, we believe the Hang Seng Index could fall to $21,500 or much lower and set off a wave of corporate bankruptcies and bond defaults.
Custom Smart Cash Index Weekly Chart
Our Custom Smart Cash Index Weekly chart is set up in a similar format. It shows that the peak in value near early 2018 was the true peak in economic activity and price valuation. Everything beyond that peak has resulted in weaker and more contracted price moves. This suggests global traders have already been pulling capital out of the markets in preparation for some type of price correction. It certainly does not align with the most recent “new price highs” in 2019 for many of the US major Indexes.
YANG Fibonacci 100% Measured Move
We believe a very strong potential for a Fibonacci 100% measured move in YANG ETF exists on a price breakdown as a result of the chaos and turmoil that will likely continue in Hong Kong and China. We’ve seen at least two of these 100% measured moves complete over the past 6 months and our Fibonacci price modeling system is suggesting a target level above $75 which happens to align with another 100% Fibonacci measured move.
Current support near $55 would be an excellent area for a stop level and targets near $65 & $72 would be appropriate for skilled technical traders. The risk at this time is related to the support level near $55 and the potential for some positive outcome in Hong Kong or other trade-related news. Any further deterioration of the situation in Hong Kong could result in a very quick price drop in the Asian markets.
CONCLUDING THOUGHTS:
As we’ve been suggesting for more than 12 months, 2019 and 2020 are going to be fantastic years for skilled technical traders. The potential for big trades (20% or more), like this YANG trade, will continue to set up in different sectors and global markets. All we need to do is stay on top of the opportunities to find ways to profit from these moves.
We would advise traders and investors to take advantage of these higher prices to pull profits out of open long positions and take some risk off the table at this juncture in price. We entered a new trade today and our portfolio is primed and ready for big moves going into next week.
We believe our super-cycle research and other proprietary modeling systems are suggesting that price weakness will dominate the markets for the next few months. Ride my coattails as I navigate these financial market and build wealth while others lose nearly everything they own during the next financial crisis and recession.
In short, you should be starting to get a feel of where commodities and asset class is headed for the next 8+ months. The next step is knowing when and what to buy and sell as these turning points take place, and this is the hard part. If you want someone to guide you through the next 12-24 months complete with detailed market analysis and trade alerts (entry, targets and exit price levels) join my ETF Trading Newsletter.
https://thegoldandoilguy.com/wp-content/uploads/2019/09/41.png548850adminhttp://www.thegoldandoilguy.com/wp-content/uploads/2014/11/tgaoglogo.pngadmin2019-09-02 16:48:422019-09-02 16:48:42Could Hong Kong Disrupt China & The Global Markets Further?
This past weekend was full of exciting news and information. Combine this with the strong US economic activity, the potential for some type of reprieve in the US/China trade issues and the historic meeting in North Korea between President Trump and Kim Jun Un, and the markets were set up for a big move at the open of trading in Tokyo.
The other big news originated from the Bank of International Settlements (BIS). This Swiss-based central banking committee for “central banks” released an annual report on the progress of global central banks and the global economy last weekend. They urged central banks not to chase easy money policies any longer and to focus on core policy changes, practical economic practices, and real leadership to help drive future growth. They urged nations that easy money policies may help to show some types of immediate economic improvements – but that the risks of continuing such policies and lack of true economic reforms do nothing but pack risk into the back end of these efforts.
Recently we have been talking about the unit and very different opportunities in other assets like real estate and precious metals. Each metal is unique for market timing has its own personality. Our gold predictions are an eye-opener, why silver is awesome, and our most recent analysis on platinum is timely.
Our opinion is the US stock market is poised for a big move based on this news and continued economic activity. If the US is able to settle trade issues in a manner that supports a strong future economic output and restore some balance to foreign trade, as well as continue to produce strong economic activity and output levels throughout the last 6+ months of this year, we could see a very strong price rally setting up into the end of 2019. This could prompt a big move to the upside IF all things line up properly as we have suggested.
If things take an ugly turn over the next 2 to 4+ months, then we believe current support levels will likely act as a floor in the US stock market as the global economies struggle to find their “launch button” to jump-start their economies. As the news stated, the economic factors of the globe are in a transitional state at the moment. The US is the leading global economic engine and many other foreign economies must transition away from easy money policies and make hard choices to drive future growth. Volatility will be KING over the next few months/years and the US Dollar will likely continue to strengthen as this transition plays out.
This ES chart highlights the resistance levels just below $3000 that we are watching as a critical ceiling in the ES. As we have suggested, the news last weekend is driving upward price activity into this resistance area. Traders should be cautiously bullish right now and should be keenly aware of risks that could prompt a breakdown in price. Current support is near $2700.
Technology could be a huge winner if the US/China restore proper trade relations and establish a stronger future economic tie going forward. In fact, the relief of a US/China trade deal could easily spill over into the DOW and Mid-Cap stocks as general trade and infrastructure deals will likely ramp-up quickly. Our researchers believe the technology sector is the “canary in the coal mine” for the future of price related to trade and global economic activities. We believe the technology sector is unfairly weighted in either direction based on the uncertainty of the global economy right now.
Resistance near $8000 is key. Support near $6800 is also very important. This leaves a $1400 range for price rotation within critical levels. Our Fibonacci price modeling system is suggesting even bigger price volatility ranges totaling over $3000 between target levels. This suggests that volatility is still increasing and that traders should understand the risks of this volatility. Currently, we are cautiously bullish as the NQ attempt to breach into new all-time high territory again.
Gold paused in the rally early in trading today, breaking back below $1400. We have confidence in out research that Gold will continue to react to the Fear & Greed that is rampant throughout the globe at the moment and begin another upside move over the next 10+ days. This move below $1400 is an excellent opportunity for traders to identify new Long entry positions for the future upside move.
Remember, the transition that is required over the next 2+ years will require many difficult decisions and a means of transitioning away from easy money policies towards more practical economic policies. This will not be an easy task for many. The fear/greed cycle will show up in precious metals early and quickly. The next upside move should be towards levels above $1550 to $1650.
As we’ve been saying for many months, this is the time to be a skilled trader. These volatility spikes, huge moves in the markets and incredible trade setups are fantastic opportunities for traders. Join us in picking apart these moves, setups, and opportunities.
CONCLUDING THOUGHTS:
I can tell you that huge moves are about to start unfolding not only in real estate, but metals, stocks, and currencies. Some of these super cycles are going to last years. Brad Matheny goes into great detail with his simple to understand charts and guide about this. His financial market research is one of a kind and a real eye-opener. PDF guide: 2020 Cycles – The Greatest Opportunity Of Your Lifetime
As a technical analysis and trader since 1997, I have been through a few bull/bear market cycles. I believe I have a good pulse on the market and timing key turning points for both short-term swing trading and long-term investment capital. The opportunities are massive/life-changing if handled properly.
I urge you to visit my Wealth Building Newsletter and if you like what I offer, join me with the 1 or 2-year subscription to lock in the lowest rate possible, get a FREE BAR OF GOLD and ride my coattails as I navigate these financial markets and build wealth while others lose nearly everything they own during the next set of crisis’.
Chris Vermeulen
www.TheTechnicalTraders.com
https://thegoldandoilguy.com/wp-content/uploads/2019/07/50.png470850adminhttp://www.thegoldandoilguy.com/wp-content/uploads/2014/11/tgaoglogo.pngadmin2019-07-02 14:12:482019-07-02 14:12:48G20 News Drive Big Moves In The Markets
One of the biggest movers of the day on Friday was the US dollar. The US stock market appeared very weak prior to the opening bell and precious metals, especially gold, appeared to be rocketing higher. Almost right from the open, the markets washed out the fear and changed direction. The US dollar did the same thing.
This renewed strength in the US dollar continues to baffle foreign investors and foreign governments as they continue to try to support their economies and currencies against a stronger and more agile US economy and currency. Even as the US dollar strength is frustrating many investors, it is also attempting to keep a lid on traditional safe havens such as precious metals.
This further complicates many foreign nations because their gold reserves are not appreciating at the same rate that their currencies are devaluing. Couple that with capital outflows, consumer protectionism, waning economic outputs, and the need to protect local currencies to avoid populist panic, and King Dollar seems to be riding high.
A friend of ours and foreign currency trader suggested we read the article below today.
Does China have enough US dollars to survive the US trade war?
We’ve authored many articles about the US dollar over the past few months. We believe the strength in the US dollar will continue and that a support level above $92 is likely to continue to support the price for some time. That being said, the current price rotation near $96.50 provides a recent low price rotation level that could turn into future support after recent highs near $98.40 are broken.
Many times you’ve probably read our comments about a “capital shift” and how this shifting capital across the planet will be driving future investment in the US and other foreign markets. At this point in time, it’s almost like a dog chasing its tail. The more support the US dollar receives, the more pressure there is for foreign markets to support their currencies and economies. The weaker foreign economies become and foreign currencies devalue, the more demand for US dollars increases to help offset local weakness. It starting to become a vicious cycle.
We believe the defined price channel between the two magenta colored lines will continue to dominate US dollar price activity until price breaks through either the upper or lower range of this price channel. The current support near $96.50, will likely turn into a new price floor once price breaks above $99.
There are a number of factors that could ease the upward pricing pressure in the US dollar. First, increased economic output and activity in foreign markets illustrating economic growth and prosperity would likely ease the capital shift into the US stock market and US dollar. Once foreign markets begin to act as though real opportunity exists over an extended period of time, then the dominance of the US dollar may begin to weaken.
Additionally, suitable trade deals, such as we witnessed between the US and Mexico recently, will help to alleviate currency pricing pressures on foreign currencies. This strength in foreign currencies presents an opportunity for global investors to take advantage of pricing gains.
Stronger foreign currency valuations and economic output will help to ease the US dollar dominance eventually. Until that happens, as traders we need to be aware of the pricing issues related to the capital shift that is taking place, the pricing pressures on precious metals, and the likelihood that foreign investors will continue to pile into US equities while King Dollar is dominating.
Pay very close attention to foreign market weakness and news of banking issues or government bailouts of foreign banks. Much like the US credit crisis in 2008/2009, bank failures and extended credit risk exposure can lead to waterfall events. This would be our biggest fear for the global economy if foreign governments and banking institutions are not properly prepared for extended devaluation periods. If things really started to crumble overseas we could see gold and the dollar move up together, it has happened before in times of crisis.
We’ll keep you informed as we see things transpire. In the meantime, King Dollar rides high end of the sunset and foreign governments/nations will continue to attempt to support their economies and currencies. Eventually, the fear factor will push precious metals broadly higher.
We have a good pulse on the major markets and can profit during times when most others can’t which is why you should join my Wealth Trading Newsletter for index, metals, and energy trade alerts.
I can tell you that huge moves are about to start unfolding not only in metals, or stocks but globally and some of these super cycles are going to last years. These super cycles starting to take place will go into 2020 and beyond which we lay out in our new PDF guide: 2020 Cycles – The Greatest Opportunity Of Your Lifetime
Happy Fathers Day Guys!
Chris Vermeulen
Founder of Technical Traders Ltd.
https://thegoldandoilguy.com/wp-content/uploads/2019/06/7.png404700adminhttp://www.thegoldandoilguy.com/wp-content/uploads/2014/11/tgaoglogo.pngadmin2019-06-16 17:40:182019-06-16 17:40:18King Dollar Rides Higher Creating Pressures On Foreign Economies
The US Memorial Day weekend is set up to become a very interesting time for investors. The EU voting is complete and the change in EU leadership may move the markets a bit. China appears to be playing a waiting game – attempting to hold the US/Trump at bay until after the 2020 US elections. This week is certain to be very interesting for traders/investors.
The European stocks moved higher in trading on Monday as the relief from the EU election event and support for auto shares pushed the markets higher. The transition in the EU over the next few months will solidify into a political and social agenda. The EU leadership must acknowledge these future objectives of all parties in order to maintain some level of calm. It is evident that many EU nations are relatively satisfied with the current leadership while others are transitioning into more centrist leadership. The next 4+ years will be full of further transition in the EU.
China is another global issue that is relatively unsettled. We’ve been doing some research with regards to China and the potential future political and economic pathways that may become evident in the near-term future. Our biggest concern is that China has been inflating their economic levels for decades and the true scope of the Chinese economy may be much weaker than everyone expects. If our suspicions are correct and China has been inflating economic levels for many years, then the transition to a consumer/services-driven economy may be dramatically over-inflated and the US/China trade issues could be biting much harder than the Chinese want to admit.
The “Sell in May and go away” market saying may become absolute truth in 2019. Our expectations are still suggesting that an attempt at new market highs may take place before August 2019, but the current market rotation (lower) is setting up a very strong potential for further downside price action at the moment. Our proprietary Fibonacci price modeling system is suggesting the $7294 level in the NQ is key support. Below this level, the NQ could break much lower and potentially target $6850 or lower.
The YM is setting up a similar price pattern with resistance near 25,840. We believe this resistance will push prices lower as we move further into early June. The potential for some type of surprise economic data or Fed/Global market move after this weekend is somewhat higher than expected. There is a lot of shifting taking place throughout the globe and we believe this turbulence will reflect in the US market soon enough.
As of right now, our expectations are that a brief upside price rally will take place over the next 4~7+ days before a continued downside price trend may become evident. Pay attention to the news cycles for key elements that could drive the US stock market lower. We will continue to update you with regards to our proprietary research and expectations. The next 7+ days will likely be nothing but sideways price rotation within a Pennant/Flag formation.
Read our research to understand how this setup coincides with the GOLD price setup and why it is important to understand why July 2019 is so important. Please take a minute to review these recent research posts that focus more on the US Dollar and Gold, and also the July turning point for US Stocks.
4 DAYS LEFT TO GET YOUR FREE SILVER ROUNDS WITH SUBSCRIPTION!
We continue to see money flow into the safe-haven assets like the Utility sector, bonds, and most importantly precious metals. I anticipated this and our XLU utilities ETF taken with members for 4.4% already, and our VIX ETF trade we closed for a 25% last week.
For May I am going to give away and ship out silver rounds to anyone who buys a 1-year, or 2-year subscription to my Wealth Trading Newsletter. You can upgrade to this longer-term subscription or if you are new, join one of these two plans listed below, and you will receive:
https://thegoldandoilguy.com/wp-content/uploads/2019/05/27.png368700adminhttp://www.thegoldandoilguy.com/wp-content/uploads/2014/11/tgaoglogo.pngadmin2019-05-27 14:58:242019-05-27 14:58:24US Memorial Day Weekend Market Analysis
After an incredible 7+week rally in Bitcoin, from $3700 to above $8000, the current price action is setting up for what may become an extended Pennant/Flag formation with quite a bit of sideways trading ahead.
Our researchers believe the past 7+ weeks rally in Bitcoin was prompted by a shift away from risk in Asia/China and into more suitable protection assets. Cryptos appear to be the easy choice for many as this rally coincided with the April 3rd through 6th US/China trade talks in Washington, DC (https://www.scmp.com/economy/china-economy/article/3004961/us-says-theres-still-significant-work-be-done-trade-talks). It appears that many investors were preparing for a difficult deadline after the March 1st deadline for a deal was pushed back. These early April trade talks may have been interpreted as a “do or die” effort from both sides. Again, shortly after the May 1st US/China trade talks in Beijing, Bitcoin began another rally from the $5200 level all the way up to the $8000 level.
Our contacts, although we admit they are fairly limited in total quantity, have stated the sentiment from locals in China are very pessimistic on the US and President Trump. A few of our contacts have recently stated they have been laid off or terminated from their jobs and, as we understand, locals have already started to react in a protectionist mode. This happens when economies contract quickly. Consumers attempt to protect their wealth and assets by moving any capital they have into something more efficient than their local markets – thus Cryptos.
This Weekly Bitcoin chart highlights areas that we believe our current support and resistance levels. The $8000~8100 level goes all the way back to the February 2018 low. This is a critical level for trading as it became a massive price support level back in 2018 – and eventually became critical resistance in July 2018. Additional resistance is found near $9900.
This Daily Bitcoin chart highlights what we believe are the current Key Highs and Key Lows that will tell us if the next phase will be a continued rally or a breakdown in price. The Key Low near $7480 must hold for any further upside price advance. If $7480 is broken, we would expect the next Key Low price to be targeted (near $6200). Otherwise, if another rally breaks out and price rallies above the Key High, then we could see an upside target range between $9200 to $9700 very quickly.
You can see from our BLUE CHANNEL levels on the lower indicator that we believe a Pennant/Flag formation may be setting up in Bitcoin right now. This type of price rotation is not uncommon after a big move like we’ve seen already and it could be a fairly wide price rotation as this sideways Pennant/Flag pattern continues. The current range between Key Highs and Key Lows is about $2000 – lots of room for trading/traders.
The key to understanding this move is the protectionist thinking of the people of China. They are very likely attempting to move their capital into something that is not Chinese Yuan based and away from traditional holdings (Gold, Real Estate, Jewelry or other assets). Eventually, we will likely see Gold/Silver follow the rally in Cryptos if fear continues to hit the markets. Cryptos, although, appear to have executed the first leg of the “fear trade” originating from the breakdown in the US/China trade negotiations.
An additional word of warning should be that any resolution to the US/China trade talks over the next 60+ days could remove any long term support for this upside move in Cryptos. Pay attention to the news cycles and what is happening in China, the EU and the rest of the world. As fast as it went up, it could easily break down as news hits.
Lots of great price action unfold to take advantage of. Subscribers just closed out a 24% winner and another 3.46% as the markets prepare for a new move. If you want my trade signals and alerts be sure to check out my Wealth Trading Newsletter.
In our continued effort to help skilled traders/investors understand the future risks associated with geopolitical market turmoil, the EU Elections next week and the continued US/China trade war, this Part III of our Sector Rotation article will highlight certain sectors that we believe may continue to perform over the next 12 to 24+ months and help traders/investors survive any extended price volatility/rotation over that same time. Read Part I, and Part II.
Currently, the US stock market has weathered a bit of a jolt in terms of price rotation. After many stock indexes reached new all-time highs, the news of Iran Oil Sanctions, US/China trade talks failing and the political turmoil in DC as an incredible 2020 US Presidential election cycle heats up, investors are watching the markets for any signs of strength or weakness. Meanwhile, the US Dollar continues to strengthen against other global currencies in an incredible show of “King Dollar” strength and dominance. All of this plays into one of our favorite narratives that we started discussing over 30 months ago – the Global Capital Shift.
For those of you who remember our many articles about this global market phenomenon and the root causes of it, we’ll try to keep the following example/explanation of it fairly short. For those of you that are new to our research, please allow us to try to explain the Capital Shift event and why it is important to understand.
The Capital Shift started after the 2008-09 global credit market collapse. The US and many other nations created an easy money policy that was designed to spark investment and recovery across the globe. This easy money, at first, supported failing companies and governments in order to maintain social order and structure. After that process was completed, this capital went to work investing in under-valued global markets and assets. As prices continued to rise and the easy money policies became rooted into the social structure, the hunt for greater returns rotated throughout the planet – diving into undervalued markets and opportunities, often with no regard for risk.
After 2014, things began to change in the US and throughout the planet. The US entered a period of extended sideways trading that caused many investors to reconsider the “buy the dip” mentality. In 2014-15, China initiated “capital controls” in an effort to prevent outflows of capital from a newly rich population and corporate structure. Just before 2014, the Emerging Markets went through a period of pricing collapse which was associated with over-inflated expectations and $100+ oil. All of that started changing in 2014~2016 as Oil prices collapsed – taking with it the expectations and promises of many Emerging Market investors and speculators.
This shifting of capital in search of “returns with a moderate degree of risk” is what we are calling the “Capital Shift Event”. It is still taking place and it is our opinion that the US stock market will become the central focus of global capital investment over the next 4+ years. We believe the strength of the US Dollar and the strength of the US Stock Market/US Economy will drive future capital investment into US and other US Associated major markets in an attempt to avoid risks associated with the foreign market and currency market valuations. In other words, when the crap starts flying across the globe, cash will rush into the US and other safe-haven investments to protect real value.
Currently, the potential for another price decline in Crude Oil is rather strong with our research expecting a move back below $55 ppb over the next 4+ months. We believe a further economic contraction across the globe with a very strong potential for increased price volatility will drive Oil prices back below $55 with a very strong potential for prices to settle near $46~48 before the downward trend is completed.
The potential for some type of price contraction over the next 12+ months will be related to how the global and localized economic concerns play out over the next 24+ months. Yet, investors can prepare for these extended price rotations now by becoming aware of weakening price trends and the potential that certain sectors will likely be hit harder than others. For example, the most recent price weakness in the US stock market appears to be focused in certain sectors:
Technology, Semiconductors, Scientific Instruments, Financials, Asset Management, Property Management, Banking (Generally all over the US), Consumer Goods – Electronics, Airlines, Mail Order Services, Industrial Goods, Aerospace/Defense, Farming and Farming Supply, Medical Laboratories, Medical Appliances, Oil & Gas and others. This type of market contraction is fairly common in an early stage Commodity and Industrial economic slowdown.
The sectors that are improving over the past week are : Healthcare, Electric Utilities, Diversified Utilities, Gas Utilities, Consumer Personal Products, Consumer Confectioners, Cigarettes, Entertainment, Beverages and Soft Drinks, Meat Products, Specialty Eateries, REITS (almost all types), Credit Services, Telecom and Telecom/Communication Services.
All of these are protectionist rallies based on the US/China trade war and the market rotation away from Technology/manufacturing growth and into more consumer protectionist spending mode – where the consumer and larger firms focus on core items while expecting a mild recession within the economy. All of this is very common at this time within the US Presidential Election cycle. In fact, our researchers have shown that nearly 80% of the time when a major US presidential election is taking place, the US stock markets will decline within the 24 months prior to the election date.
The Monthly S&P heat map is not much different. It is still showing weakness where we expect and strength in sectors that have been somewhat dormant over the past 4+ years. The key to success for skilled traders is to be able to play this future price rotation very effectively as the different sectors continue to rotate headed into the 2020 US Presidential Elections and with all of the external foreign market factors taking place.
It is quite likely that the US Dollar will continue to push high, possibly well above $102, before finding any real resistance. It is very likely that most of the US stock market will fair quite well over the next 24+ months – yet we do expect some extended price rotation over this time and we believe Technology, Financials, Real estate, and Industrial/Consumer related stock sectors could take a hit over the next 16 to 24 months. These rotations are, again, common for this type of US Presidential Election cycle. Skilled traders are already aware of this cycle and have begun to prepare for this event to unfold. The unknowns of the current global market is China and the EU at present.
And with that last US Dollar chart, there you have it. Our three-part article about how the Global Capital Shift is about to intensify and continue to drive a US Sector rotation that many traders have failed to consider. The EU elections, the US/China trade wars, and the US Presidential Election event are all big factors in what we believe will drive in an increased level of uncertainty over the next 16~24 months. Additionally, we are very concerned that China is very close to experiencing what we are calling a “broken backbone” over the next 12+ months. We believe the pricing pressures in combination with a slowing economy and a consumer move into a protectionist stance could create a waterfall event in China/Asia.
Our advice for traders is to protect open long positions and to prepare for 16 to 36 months of “repositioning” of the global markets. The US elections are certain to drive an incredible range of future expectations throughout the world. Combine that with the EU elections, the BREXIT effort and the continued repositioning of US/China/Foreign market relations and we are setting up for a big shock-wave event in the near future.
Follow our research. We’ve already mapped out the next 24 to 36 months of market price activity with our proprietary price modeling tools. We believe we know what will happen over the next 24 to 36 months, we are just waiting for the price to confirm our analysis. Visit www.TheTechnicalTraders.com to learn more.
Chris Vermeulen
Technical Traders Ltd.
https://thegoldandoilguy.com/wp-content/uploads/2019/05/10.png427700adminhttp://www.thegoldandoilguy.com/wp-content/uploads/2014/11/tgaoglogo.pngadmin2019-05-21 10:53:182019-05-21 10:53:18Oil, Hot Stocks, and Currencies – Part III
In PART I of this report we talked about and showed you the charts of the Hang Seng and DAX index charts and what is likely to unfold. In today’s report here we touch on the US markets. As we’ve suggested within our earlier research posts this year, US election cycles tend to prompt massive price rotations when the election cycles are intense. For example, the 2000 election of George W. Bush prompted a very mild price rotation in 1999~2000. This was likely because the transition from Clinton to Bush II was not overly contentious. The 2008 election of Barrack Obama was a moderately contested election cycle and happened at the time of the biggest credit market collapse in modern history – thus, the markets were well on their way lower 12+ months before the elections. The 2012 election cycle showed moderate price rotation as it was a highly contested election event in the US. The 2015-16 election event was highly contested as well and the price rotation near this time appears longer and deeper than the 2012 event.
Now, in 2020, we have one of the biggest, most highly contested US election cycles in recent history unfolding and we have already begun to see a price range /rotation over the past 12+ months that suggests we could see even bigger price rotation. If we add into this mix the US/China trade issues, global market concerns, US political rhetoric, and other issues, we have a recipe for A BIG MOVE setting up.
Our analysis still suggests that we are poised for an attempt at fresh new all-time highs before any massive price rotation takes place (near the upper trend line). Yet, we believe the downside price rotation is an eventual component of the next 16+ months of the US election cycle and the future price advance that should take place in the near future. In other words, we believe the markets are setting up for a bigger shake-out throughout this election cycle/trade issue event that will prompt lower prices before the end of 2019. We do believe the markets will settle and resume an upward trend bias after this downside price rotation – yet we don’t know exactly when that will happen.
To the best of our ability to predict the future, we can state this at the moment. It appears the end of 2019 will be filled with large price rotation – likely to the downside as trade issues and election/political issues cause a “shock-wave” in the markets. We believe early 2020 will see a relief rally that may setup a bigger price move throughout the remainder of 2020. Right now, traders need to be prepared for an incredible increase in volatility and price rotation. It is very likely that we will see a VIX level above 40 at some point before the end of 2019. This is a time for skilled traders to get in, get profits and get out. Position trading over the next 12+ months will be very difficult.
For active swing traders, you are going to love our daily trading analysis. On May 1st we talked about the old saying goes, “Sell in May and Go Away!” and that is exactly what is happening now right on queue. In fact, we closed out our SDS position on Thursday for a quick 3.9% profit and our other new trade started Thursday is up 18% already.
Second, my birthday is only three days away and I think its time I open the doors for a once a year opportunity for everyone to get a gift that could have some considerable value in the future.
Right now I am going to give away and shipping out silver rounds to anyone who buys a 1-year, or 2-year subscription to my Wealth Trading Newsletter. I only have 5 left as they are going fast so be sure to upgrade your membership to a longer-term subscription or if you are new, join one of these two plans, and you will receive:
1-Year Subscription Gets One 1oz Silver Round FREE
(Could be worth hundreds of dollars)
2-Year Subscription Gets TWO 1oz Silver Rounds FREE
(Could be worth a lot in the future)
I only have 5 more silver rounds I’m giving away
so upgrade or join now before its too late!
https://thegoldandoilguy.com/wp-content/uploads/2019/05/chart15.png427700adminhttp://www.thegoldandoilguy.com/wp-content/uploads/2014/11/tgaoglogo.pngadmin2019-05-14 11:25:002019-05-14 11:25:00Trade Issues Will Drive Market Trends – PART II
It is becoming evident that the US/Chinese trade issues are going to become a point of contention for the markets going forward. We’ve been review as much news as possible in an attempt to build a consensus for the future of the US markets and global markets. As of last week, it appears any potential trade deal with China has reset back to square one. The news we are reading suggests that China wants to reset their commitments with the US, remove all tariffs and wants the US to commit to buying certain levels of Chinese goods in the future. Additionally, China has yet to commit to stopping the IP/Technology theft from US companies – which is a very big contention for the US.
This suggests the past 6+ months of trade talks have completely broken down and that this trade issue will likely become a market driver over the next 12+ months. The global markets had anticipated a deal to be reached by the end of March 2019. At that time, Trump announced that he was extending talks with China without installing any new tariffs. The intent was to show commitment with China to reach a deal at that time – quickly.
It appears that China had different plans – the intention to delay and ignore US requests. It is very likely that China has worked to secure some type of “plan B” type of scenario over the past 6+ months and they may feel they are negotiating from a position of power at this time. Our assumption is that both the US and China feel their interests are best served by holding their cards close to their chests while pushing the other side to breakdown through prolonged negotiations.
Our observations are that an economic shift is continuing to take place throughout the globe that may see these US/China trade issues become the forefront issue over the next 12 to 24 months – possibly lasting well past the November 2020 US Presidential election cycle. It seems obvious that China is digging in for a prolonged negotiation process while attempting to hold off another round of tariffs from the US. Additionally, China is dealing with an internal process of trying to shift away from “shadow banking” to eliminate the risks associated with unreported corporate and private debt issues.
The limited, yet still valid, resources we have from within China are suggesting that layoffs are very common right now and that companies are not hiring as they were just a few months ago. One of our friends/sources suggested the company he worked for has been laying off employees for over 30 days now and he just found out he was laid-off last week. He works in the financial field.
We believe the long term complications resulting from a prolonged US/China trade war may create a foundational shift within the global markets over the next 16 to 24+ months headed into the November 2020 US Elections. We’ve already authored articles about how the prior 24 months headed into major US elections tend to be filled with price rotation while an initial downside price move is common within about 16+ months of a major US election event. This year may turn out to prompt an even bigger price rotation.
US Stock Market volatility just spiked to levels well above 20 – levels not seen since October/November 2018, when the markets fell nearly 20% before the end of 2018. The potential for increased price volatility over the next 12+ months seems rather high with all of the foreign positioning and expectations that are milling around. It seems like the next 16+ months could be filled with incredibly high volatility, price rotation and opportunity for skilled traders.
Our primary concern is that the continued trade war between the US and China spills over into other global markets as a constricted price range based trading environment. Most of the rest of the world is still trying to spark some increased levels of economic growth after the 2008-09 market crisis. The current market environment does not settle well for investor confidence, growth, and future success. The combination of a highly contested US Presidential election, US/China trade issues, a struggling general foreign market, currency fluctuations attempting to mitigate capital risks and other issues, it seems the global stock markets are poised for a very big increase in volatility and price rotation over the next 2 years or so.
Our first focus is on the Hang Seng Index. This Weekly chart shows just how dramatic the current price rotation has been over the past few weeks and how a defined price channel could be setting up in the HSI to prompt a much larger downside objective. Should continue trade issues persist and should China, through the course of negotiating with the US, expose any element of risk perceived by the rest of the world, the potential for further price contraction is very real. China is walking a very fine line right now as Trump is pushing issues (trade issues and IP/Technology issues) to the forefront of the trade negotiations. In our opinion, the very last thing China wants is their dirty laundry, shady deals and political leadership strewn across the global news cycles over the next 24+ months.
The DAX Weekly Index is showing a similar price pattern. A very clear upper price trend channel which translates into a very clear downside price objective is price continues lower. Although the DAX is not related directly to the US/China trade negotiations, the global markets are far more interconnected now than ever before. Any rotation lower in China will likely result in a moderate price decrease in many of the major global market indexes.
As we’ve suggested within our earlier research posts, US election cycles tend to prompt massive price rotations when the election cycles are intense. In our next post PART II of this report, we talk about what happened in the past election cycles reviewing the monthly charts and weekly SP500 index charts which are very telling in what could be about to happen next for the stock market from an investors standpoint.
For active swing traders, you are going to love our daily trading analysis. On May 1st we talked about the old saying goes, “Sell in May and Go Away!” and that is excactly what is happening now right on queue. In fact, we closed out our SDS position on Thursday for a quick 3.9% profit and our other new trade started Thursday is up 18% already.
Second, my birthday is only three days away and I think its time I open the doors for a once a year opportunity for everyone to get a gift that could have some considerable value in the future.
Right now I am going to give away and shipping out silver rounds to anyone who buys a 1-year, or 2-year subscription to my Wealth Trading Newsletter. I only have 7 left as they are going fast so be sure to upgrade your membership to a longer-term subscription or if you are new, join one of these two plans, and you will receive:
1-Year Subscription Gets One 1oz Silver Round FREE
(Could be worth hundreds of dollars)
2-Year Subscription Gets TWO 1oz Silver Rounds FREE
(Could be worth a lot in the future)
I only have 13 more silver rounds I’m giving away
so upgrade or join now before its too late!
https://thegoldandoilguy.com/wp-content/uploads/2019/05/chart11.png429700adminhttp://www.thegoldandoilguy.com/wp-content/uploads/2014/11/tgaoglogo.pngadmin2019-05-13 10:42:202019-05-13 10:42:20How Chinese Trade Issues Will Drive Market Trends