
 We talked with the Gold and Oil Guy today, Chris Vermeulen. He says that Gold is still in a bear market, like it has been for the past three years. There’s an opportunity to pick up a quick profit when it rebounds from its current plunge, but don’t be fooled. It’s all setting up very nicely for the ultimate bull market that’s getting closer. Same with the much maligned Toronto Venture Exchange (TSX:V), which is at record lows due to its composition of miners and resource companies. Chris believes that when it comes back, it will come back very big, so consider the ETF. Chris is very bearish on Oil and doesn’t see it for quite some time, so don’t chase it lower. Believe the technicals, not your heart. Chris also runs an automated trading system that can trade for you on autopilot.
Posts
 Click Here to Listen to the Audio
Investors and traders around the world continually search to find or increase their edge in the financial markets to boost profits. The next few months are going to be critical for investors because the number seven is now in play for the stock market.
What does this mean?
In magical lore seven is a magical number., While all numbers are ascribed certain properties and energies, seven is a number of power, a lucky number, a number of psychic and mystical powers, of secrecy and the search for truth.
Seven is used 735 times in the bible and if you total up all words including “sevenfold” and “seventh” there is a total of 860 references.
The origin of seven’s power lies in the lunar cycle. The moon has four phases lasts about seven days. The Sumerians gave the week seven days. Life cycles on earth also have phases demarcated by seven, and there are seven years to each stage of human growth, seven colors to the rainbow, seven notes in the musical scale, seven petitions in the Lord’s Prayer, and seven deadly sins.
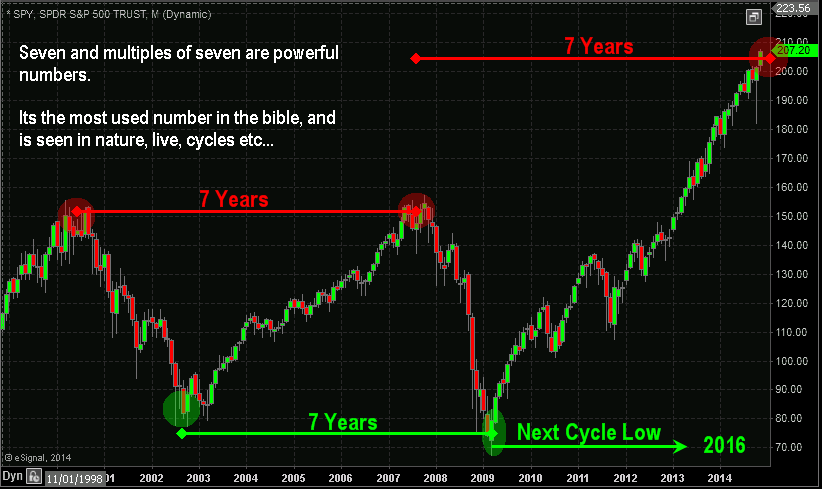
More importantly for investors the number seven and multiples of seven have a powerful influence on money. The US stock market is now trading in the seventh year window and it should not be taken lightly.
While I could go into a lot more detail about how I use seven in my algorithmic trading strategy to swing trade the S&P 500 index. This article focuses on the investing outlook.
See this video about seven… http://youtu.be/W8B14NSIWc8
I am fortunate enough that I have been trading since 1997 and have seen the how the stock market cycles affect human behavior and businesses specifically the financial newsletter industry which I have been involved in since the first day my trading career.
The stock market appears to be nearing a critical turning point that will change the lives and behaviors of investors for years to come.
The good news is that I have experienced four of these turning points and human behavior shifts in my career before and we currently entering the fifth turning point. I feel obligated to share this valuable insight with those of you who read my work. The next major market move could have a dramatic impact on your wealth and retirement years.
Insight on Investor Behavior and Business
Being heavily involved in the financial newsletter industry I have not only seen but survived several of these major cycles which forced many newsletters to go out of business. The cycles at play here are the market trend and the behavior of traders and investors.
The combined forces of these two cycles are what cleanse the newsletter industry of poor quality services. It becomes almost impossible to obtain new clients without word of mouth/referrals from happy users and if the quality of the newsletter is poor, eventually they lack enough users to make it feasible to operate. Unfortunately it’s the brutal truth, and over the last couple years I am seeing newsletters and even to top trading magazines that have been around for decades closing their doors.
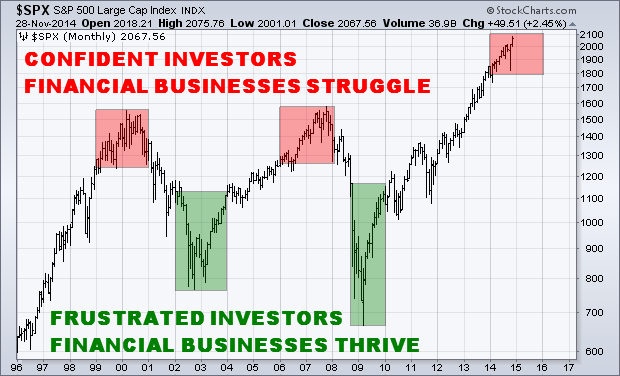
The business cycle can easily be explained by observing the chart below of the SP500 index. In short, when the stock market has been rising for six or more months investors start to become confident in that they can make money on their own. And in fact they can if they buy and hold during a bull market.
But what happens as the market continues to rise for many years is that more and more investors and traders realize they can make money on their own. The longer the uptrend remains intact the less will need the help of a trading and investing newsletter making it difficult to get new customers in this highly competitive industry.
Currently investors are behaving almost identical to what I saw during 1999 – 2001, from 2006 – 2007, and now 2014 – 2015 market tops.
Did you notice anything with those market tops? They are 7 years apart…
Let’s now take a look at the best times in the business cycle where traders and investors are in desperate need of help and start subscribing to multiple paid financial newsletter services. The strongest times for business took place during 2002 – 2003, and again in 2008 – 2010. This is when investor not only lost most of their wealth, but their faith in how they invest, who they invest with, and the stock market as a whole.
Did you notice any there also? They are 7 years apart also…
Investors 7 Year Financial Outlook
Those of you who follow me know that I do not pick market tops or bottoms. Rather I focus on identifying trends and cycles in the market and only trade and invest with the active confirmed trend.
You also know that trying to pick market tops and bottoms is a suckers game and a sure fire way to lose a lot of money and build a serious complex that the market is manipulated, not tradable, and that it may be time for you to give up on trading all together.
Well, I am here to say that the market is tradable, and can generate traders and investors a boat load of money once you understand how and why it moves. Most importantly you need to understand money/position management and be patient for consistent long term gains.
Take a look at the chart below for a clear visual of 7 year cycle highs and lows at play.
While I do not invest based on this major seven year cycle I do actively trade a smaller market cycle which provides roughly 35 – 65 trades per year. This strategy allows me to profit during these major bull markets and also during the multi-year bear markets when the majority of investors are losing boat loads of their hard earned money.
The reason I do not invest in the seven year cycle is because the market can still have 30+% price swings within bull and bear markets and that type of volatility is beyond what I am comfortable with. Also because I can actively invest with my automated trading system so I don’t need to lift a finger or watch the stock market each day, week or month.
I hope you found this report useful in some way, and I ask that you share it with others.
Chris Vermeulen
www.TheGoldAndOilGuy.com
Since July of 2014 the big cap stocks have continued to make new highs as investors dump more and more money into the stock market. Overall bullishness on the stock market is now at extremely high levels which typically happen before a major stock market correction and sometimes start a full blown bear market.
While the average investor continues to become more and more bullish, the market breadth/health has been rapidly deteriorating. Unless you are market savvy you would not know how weak the market actually is and this always leads to strong losses and drawdowns for the uninformed investor.
What we know and most do not about this rising market, is that the big cap stocks in the SP500 index appear to be holding the overall market up and masking the weakness. So as investors become more bullish at these lofty levels putting more money into generic funds that push the SP500 higher, we see strong selling and unwinding of the more leveraged position like small cap stocks.
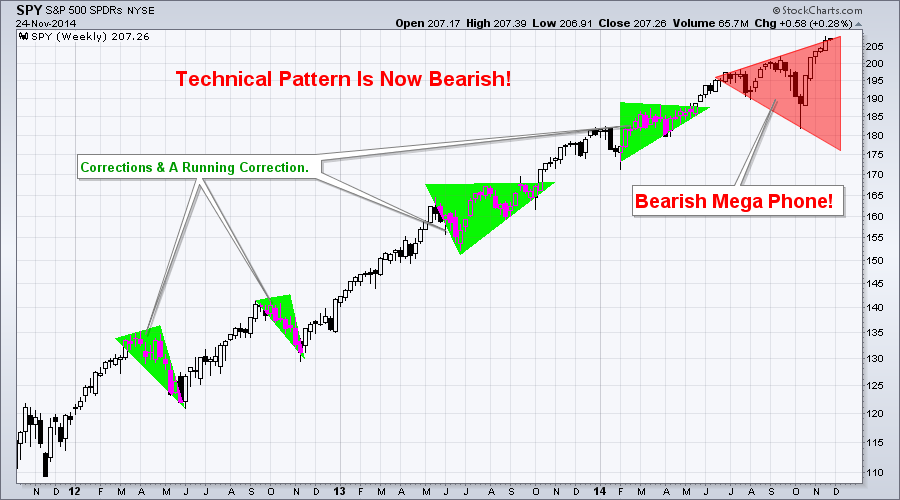
Over the past couple years the SP500 has formed a series of bullish corrections and running corrections. But the current formation is that of a bearish mega phone pattern and these typically point to lower prices.
SP500 BIG CAP STOCKS:
THE BOLD STOCKS:
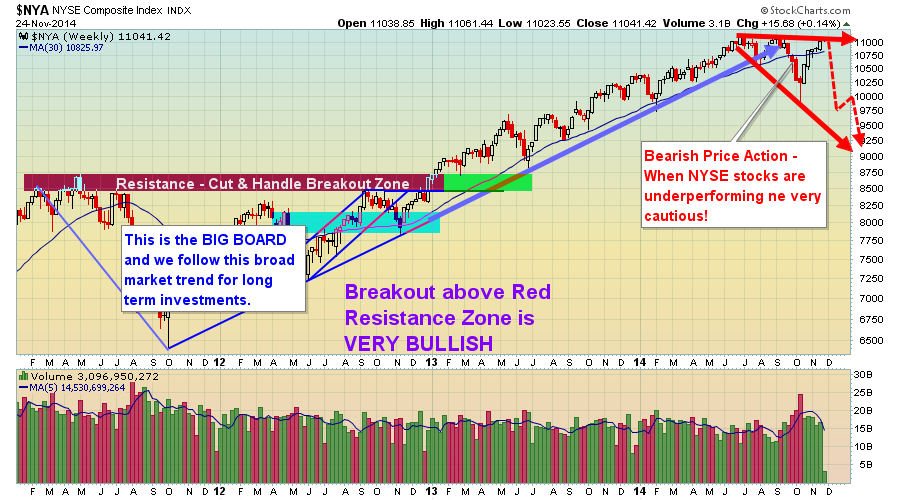
I have always liked to follow the NYSE index because its a basket of 1900 stocks with 1500 of them being U.S companies. Its breadth/strength makes it a much better indicator of the market performance than the more narrow indexes with less stocks.
While this index remains in a bull market, it only looks as though it’s a few months away from a possible reversal and confirmation of a new bear market.
THE UGLY:
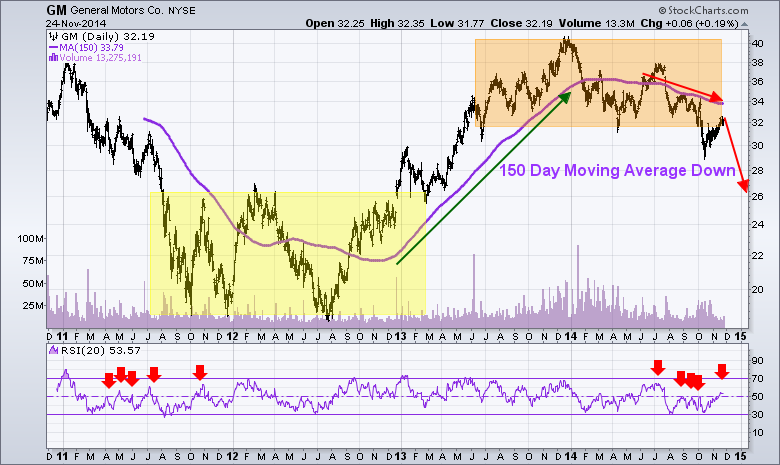
If you have ever read Stan Weinstein’s book then you know he followed GM share price closely. He believed that what GM did, the stock market would follow, to some extent. GM was/is an early leader of the US economy and stock prices in general.
The chart below paints a clear picture of the Stage 1 Accumulation in 2011- 2012, and also of the Stage 3 Distribution phase in 2013 – 2014. GM shares have traded down literally from the first week of the year and have now broken below critical support. Things could get interesting…
MY TRADING CONCLUSION:
In short, I remain bullish on the stock market with both my short term and investing outlook but I am very cautious and have closed out several large positions recently. Cash is king and I plan to protect, rather than invest my nest egg when risk is higher than normal.
Short term trading where trades only last 3-10 days is the way to go at this stage of the game. Some recent winning ETF trades with my ETF newsletter www.TheGoldAndOilGuy.com have been in SCO, a quick bounce trade in UCO, REM, and our current trade as of last week EEM.
The majority of my investment capital is traded with my automated trading system. It trades the S&P500 index directly in my brokerage account catching these 3-10 day swings in the market saving me time while reducing my emotional attachment to the market.
Chris Vermeulen
Everyone has been calling for a bottom in Gold the last year. But the fact is that gold and gold stocks are still clearly in a bear market. Just look at the 200 day moving averages. The previous trends were down and prices have been moving sideways for the past year.
A lot of newsletter and analysts are calling a bottom. Technically it’s just a consolidation pattern. Consolidation patterns are a continuation pattern, meaning if the previous trend was down, which it was from 2011 till now, the odds favor price will continue lower after this consolidation.
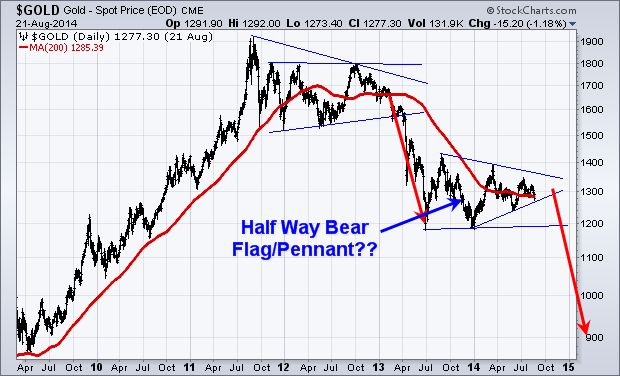
If this consolidation does happen to be the bottom then we can classify it as a stage I base. Gold and gold stocks will start a new bull market, but price needs to break to the upside of this consolidation pattern. Until it breaks to the upside, it is still in a down trend.
Gold topped out over three years ago. And I am in no rush to try to pick a bottom and be a hero here. I’m just going to continue waiting on the sidelines until price confirms either a new bull market has started or for price to breakdown and we get another leg lower.
Oil Outlook
Taking a look at the big picture of crude oil the chart looks bearish. It too has been trading in a range since 2011 and the price is nearing the apex of a consolidation pattern.
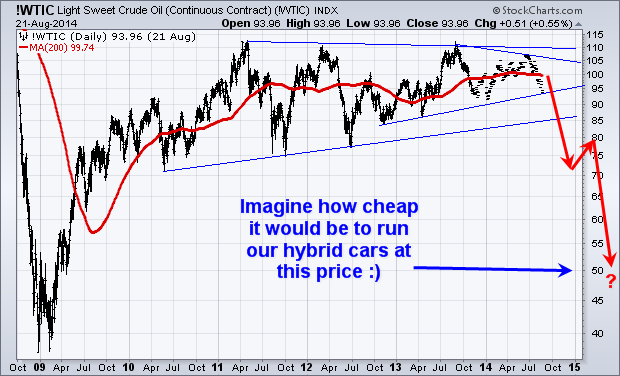
It’s important to know that a pennant formation which is what crude oil has formed are the most predictable when price breaks out of the pattern within the first 1/3rd of the formation.
The longer price consolidates and gets squeezed into the narrowing apex of the pennant pattern, the more unreliable. The trend breakout will be, and it becomes at best a 50/50 bet.
Crude oil’s previous trend was up, but it’s been consolidating for such a long time that price is now squeezed into the apex. This negates that bias for the previous trend to hold true so we have no idea which why it will breakout but when it does expect an explosive move.
A breakdown in crude oil will send price to the $70 or $75 per barrel range, and that will hammer on the Canadian dollar also. I can see $1 USD being equivalent to $1.20 Canadian in a year.
My Gold and Oil Conclusion
Looking at the US dollar, it has been rising partly due to the euro falling. This strong dollar will put a downward pressure on commodities overall.
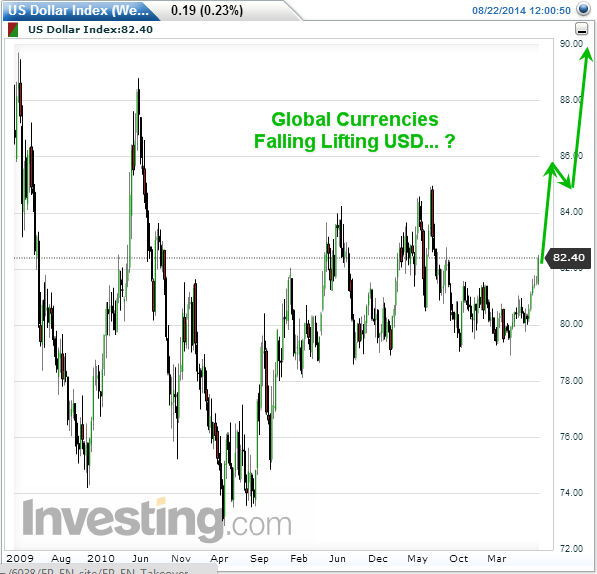
Gold and oil have not been that exciting for investors since 2011 when they topped out, but both are setting up for massive moves that should last month, if not year or more. Once these new trends emerge expect to see them in the headline news every hour.
It does not matter which way these commodities breakout of the consolidation patterns. With the dollar continuing to rise and the bearish chart patterns for both gold and oil there is a good chance much lower prices are ahead.
This will catch most investor’s off guard. It’s human nature to try to predict tops and bottoms in the market. But this is why most investors get caught on the wrong side of the market. The market always has a way of catching the majority of people on the wrong side of a position.
I am happily sitting in cash with some of my investment capital waiting for gold and oil to breakout of these large patterns. I would not be surprised if we see $900 gold, gold stocks like the gold bugs index $HUI to be at $150, and $70 per barrel for crude oil. I am not saying this is what I want, but you should be mentally prepared so you can get back into cash position and so you can take advantage of falling prices with me.
Big money will be made on the next price movements in these commodities. Whether we have to go long the market or short sell the market. Either way, we can make money. So don’t be a hero and try to pick a top or bottom, just wait for confirmed breakout then invest with the trend.
Would you like my trade alerts CLICK HERE
Want my SP500 trades executed for you in your brokerage account CLICK HERE
Charting your way to financial freedom,
Chris Vermeulen
Back in the day when I was a newbie trader and investor I used to follow several stocks, sectors and commodities that had a setup chart patterns. I would draw all over them and then wait to catch the day of the breakout.
Unfortunately I would miss a good chunk of the trades because they would breakout when I want not watching the chart forcing me to miss some unbelievable momentum and swing trading opportunities. I used to get rather frustrated with trading to put it kindly.
But I eventually learned that there are several ways to avoid this from happening and each of these options work much better than watching the charts like a hawk waiting for that breakout that may or may not happen.
The beauty of my trading system is that it allows me to buy on the breakout whenever a strong breakout happens without me, I have methods that will automatically enter me into a long position on the first pullback after a confirmed trend reversal.
The positive trade-off of buying a pullback that follows a trend reversal or chart pattern is that buying pullbacks is often lower risk than buying breakouts because there is a lower risk of the breakout failing.
Before I get into those details let me update you on what gold stocks just did and what I expect them to do in the near future.
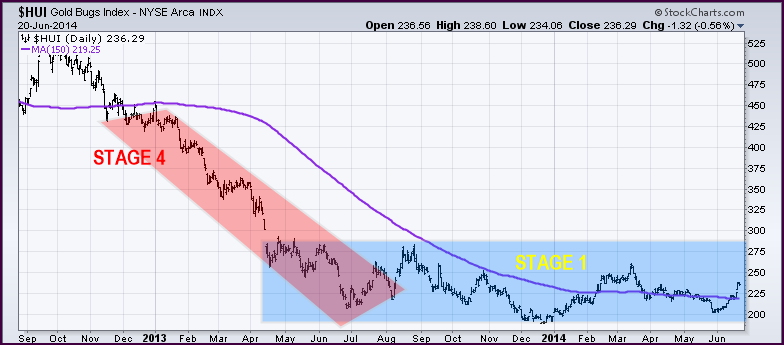
Recently we have seen big money move into gold stocks. Gold and silver stocks are popping on high volume which is great to see. While it is exciting gold stocks are not yet in the clear from further selling or sideways trading.
If you are familiar with Stan Weinstein or have followed my work for a while you likely understand the four stages the market goes through (same on all time frames). Looking at the chart below its clear that the gold stock index HUI has completed a stage 4 decline and appears to be in the second half of an accumulation stage 1.
The stages in this chart I am talking about are big picture trends which last a year or two, more of an investors 35,000 foot view on the market. I breakout and rally above the $280 level will be very bullish, any pause or pullback after that will provide a low-risk opportunity to get involved.
I will let you in on a little secret of mine, and almost never buy an upside breakout, I actually wait for the first pullback. And on the flip side, I always short on the breakdown, and if I miss it, I will then get short on the first bounce.
If you have not read my report on the next countries to start bull markets then checkout it out here: Click Here
In my next article I am going to tell you exactly how to avoid missing the breakdowns and how to be entered automatically into these trades when the market has its first pullback for 100% Hands-Free Trading.
Find This Article Educational? Delivered To Your Inbox Free Here www.GoldAndOilGuy.com
Chris Vermeulen
Index ETF Trading Strategies: Stocks have kick started this week with a 0.85% pop in price but the big question is if the market can hold up. Last week stocks repeatedly gap higher and sold off with strong volume telling us that institutions are slowing phasing out of stocks (distribution selling) unloading shares into strength and passing them onto the a average investor to be left holding bag.
I want to show you a couple charts which show the price action, volume and money flow of the SP500 so you have a visual of what I am talking about.
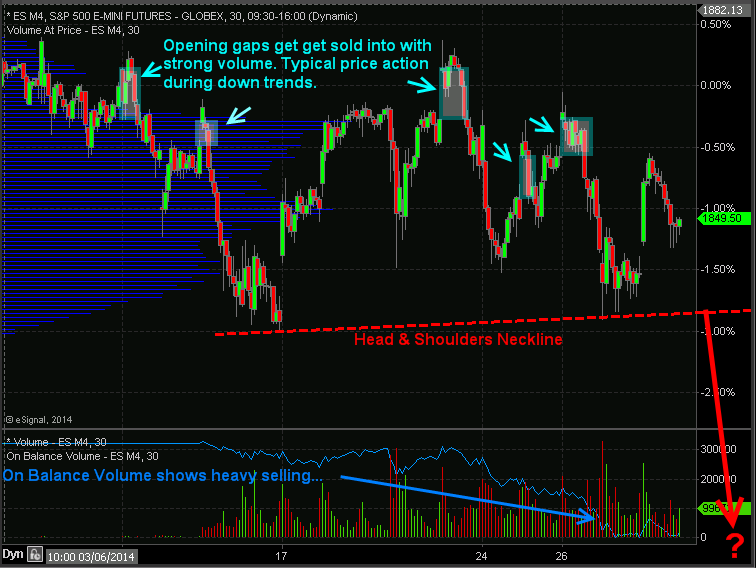
30 Minute Intraday SP500 Chart – ETF Trading Strategies
In the chart below you can see the price gaps followed by selling. Why is this important? It is important because during a down trend the market makers and big money plays who have the money and tools to manipulate the markets will allow the market drift higher or they will run price up in overnight or premarket trading when volume is light. Once the 9:30am ET opening bell rings volume and liquidity spike which allows the big money player to sell remaining long positions and or add to short positions they have.
If you look at the blue on balance volume line at the bottom of the chart you can clearly see that more contracts are being sold than bought which is typically an early warning sign that the market is about to fall farther.
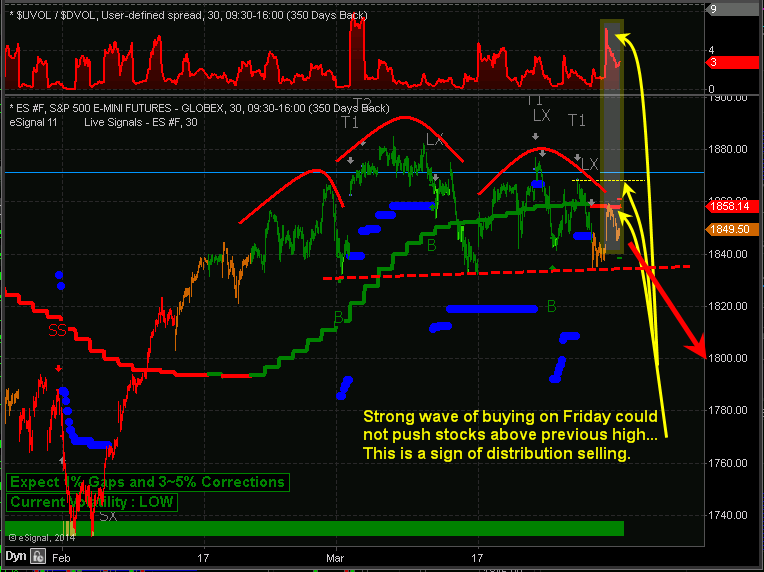
Automated Trading System – 30 Minute ES Futures Chart
Below is a marked up screen shot of my automated trading system which I use for timing both futures and ETF trading strategies. The color coded bars tell you the market trend along with the strength of buyers and sellers.
When you couple market cycles, trends, volume/money flow, along with chart patterns we can forecast and trade markets with a high degree of accuracy in terms of market direction and timing. Ross Clark & I talk about cycle analysis, market stages etc… which you can listen to live here: http://talkdigitalnetwork.com/2014/03/this-week-in-money-129/
My Index ETF Trading Strategies Conclusion:

Just to be clear on the current market trend and my overall outlook let me explain a little more. Overall, the broad stock market remains in an uptrend. Thursday and Friday of last week we started getting orange bars on the chart telling us that cycles, volume, and momentum are now neutral. It’s 50/50 on which way the market will go from here, so until the market internals (cycles, volume, breadth) push the odds in our favor enough for a short sell trade or a new long entry we will not add new positions to our portfolio.
It is important to understand that nearly 75% of stocks/investments move with the broad market. So we don’t want to add more long positions when the odds are not in favor of higher prices. Trading in general is not hard to do, but creating, following, executing properly money and position management is. If you have trouble with following or creating an ETF trading strategy you can have my ETF trading system for rising, falling and sideways markets traded automatically in your trading account.
Learn more here about my Automated Trading Systems
Chris Vermeulen
www.TheGoldAndOilGuy.com
www.AlgoTrades.net
As you likely know I have been working on automating my long term SP500 investing strategy which I call AlgoTrades. I would like to mention that we are taking on new clients to our AlgoTrades automated investing system.
We are very excited to tell you that the doors are currently open for you to become a part of this new way of investing.
To ensure peak performance from our automated trading system and trading results for our clients. We have a limited number of seats available to ensure this. As with any good system, once there are too many clients the profitable edge in the market will no longer exist. As we are trading the system with our own investment capital, we are going to monitor and protect our system.
This system is very exclusive as it can only handle a limited group of clients. Be sure to join today, before we are over subscribed. Reserve your seat to have our system trading a portion of your investment capital.
LEARN MORE – 4 MINUTE VIDEO:
http://www.algotrades.net/automated-trading-systems/
SUBSCRIBE TO ALGOTRADES INVESTING SYSTEM:
http://www.algotrades.net/subscribe-algorithmic-trading-system/
Sincerely,
Chris Vermeulen
Founder of AlgoTrades Systems
www.AlgoTrades.net
www.TheGoldAndOilGuy.com
Good morning!
Both the Canadian and US stock markets are closed today. Futures trading have shortened mixed hours also. Being a holiday and limited trading there is no video this morning.
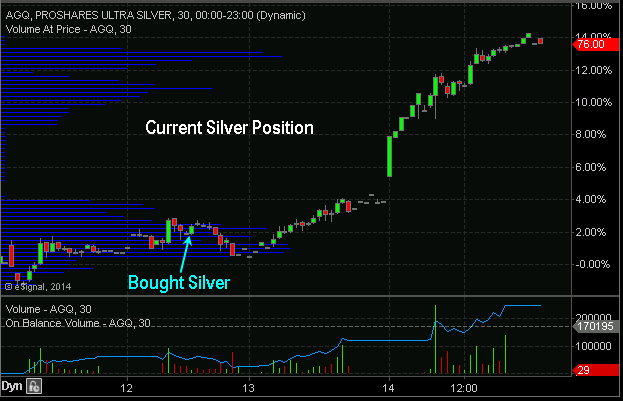
Taking a look at the futures market we can see trading up another 1.35% today which is great to see. So far out silver position is up over 12% in just a few trading sessions.
View Recent Exclusive Silver Report: http://www.silver-phoenix500.com/article/silver-global-price-forecast-sterling-opportunity
Natural gas is no fire once again… up nearly 5% again today and is now testing the recent spike highs in price in which we shorted earlier this month for a net 20+% profit in only a few days. Nat gas actually looks ready to rally even more this time so I am not looking to short it unless we get a picture perfect setup again.
The SP500 (broad market) continues to claw it’s way higher and its trading up 0.25% this morning. We are going to leave the stock market alone until we get a correction in price, then we will review the charts for a possible trade setup.
On different note, today we are excited to announce the opening of doors to our automated trading system for investors. Many of you are already on the waiting list as we have a limited amount of client seats available to have the system traded automatically in your brokerage account and it is first come first serve. Keep in mind today is a holiday with brokers and services are running on a skeleton crew. If you have not taken a look at our automated trading system you can review all the details here: www.AlgoTrades.net
Chris Vermeulen
The use of cycles is perhaps the most misunderstood areas of technical analysis. And is widely miss used within automated trading systems. This is because there are a wide variety of approaches ranging from magnetic, to astrology to time based cycles.
The purpose of this tutorial on cycle analysis and implementation into automated trading systems is to present a logical perspective on what cycles and how they enhance your technical analysis studies.
Originally I was attracted to cycle analysis back in 2001. Back then, there was very little information about cycle analysis and even less on how to identify them within financial instruments. Cycles can be somewhat measured using conventional indicators such as RSI, stochastics and moving averages. But, better yet is a custom cycle analyzer indicator I created to make cycle identification and implementation automatic within my trading strategies and my fully automated trading system.
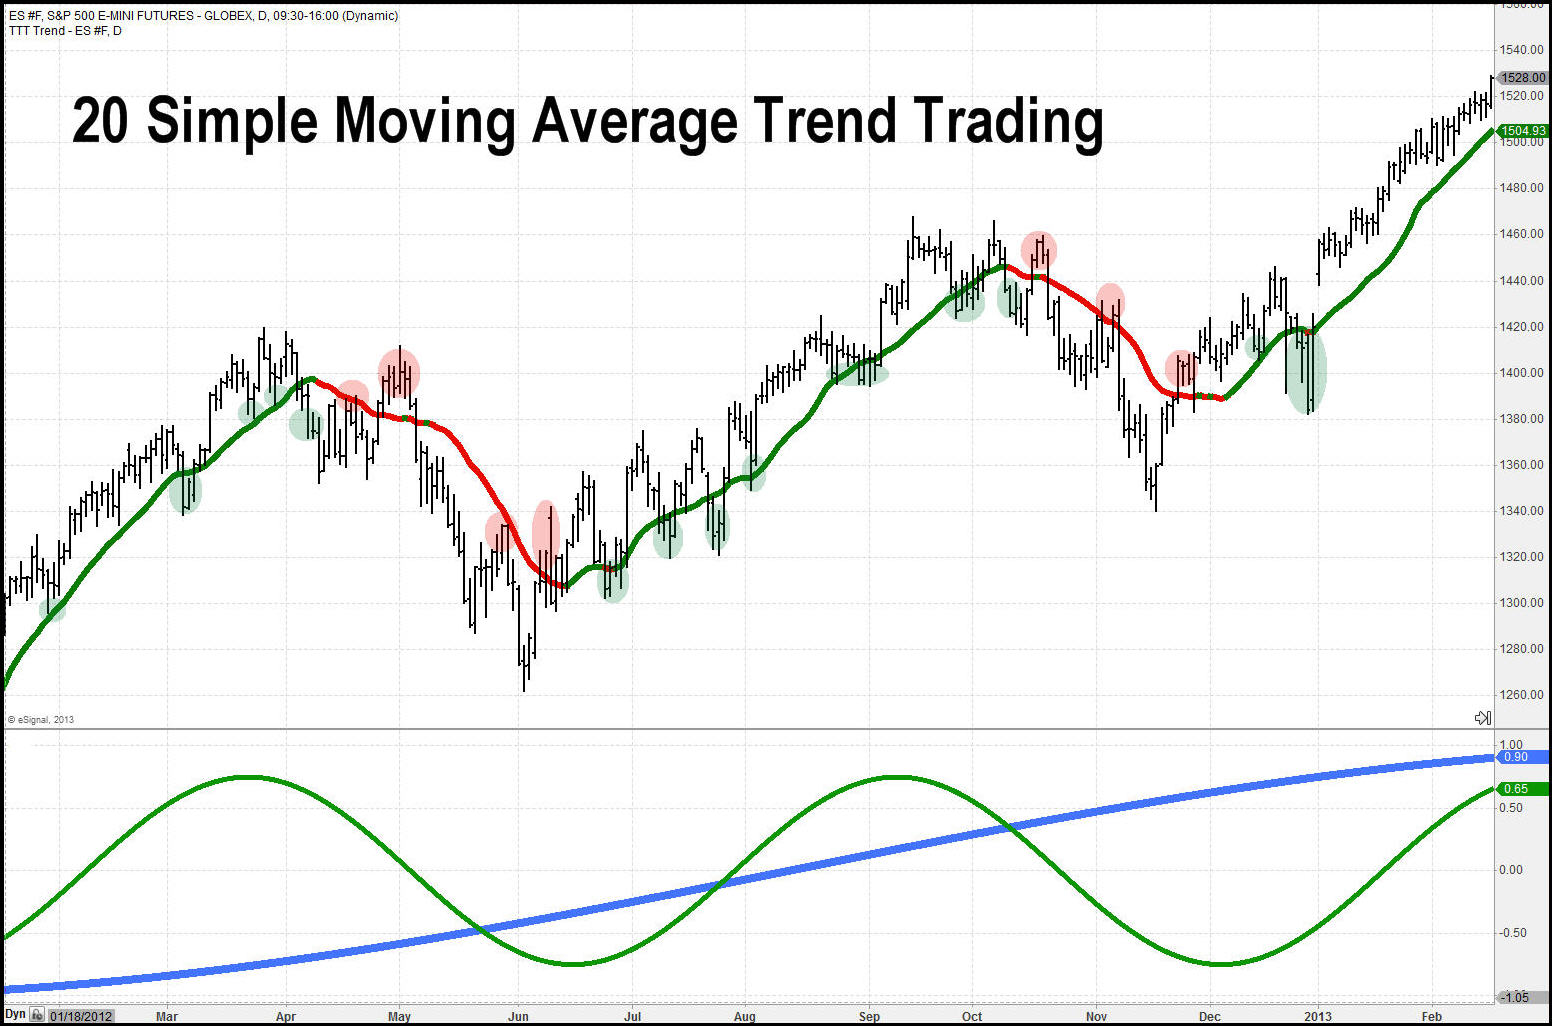
Here is how the moving average can help spot cycles, but keep in mind they are lagging indicators. The lower indicator shows the long term cycle and swing trading cycle I focus on. Remember cycle lengths change over time which is why I automated the indicator and have it run within my automated trading system. But you should get the gist of how cycles look and function.
I am going to touch quickly on a few areas of cycle analysis which I hope you find somewhat interesting.
Cycle Perspective by Market Participants
Cycles also known as waves are observed almost everywhere including nature. Ancient civilizations designed calendars and time measurements cased around cycles. This has creating the most standard measurements we all live by and track on a regular basis. The length of day, year, seasonal changes and even the phases of the moon and stars. These are just time based cycles but the same type of thing carries across noise like musical notes, light spectrum’s, and in liquids like waves in the ocean.
Philosophical Cycle Foundation
The financial markets are truly efficient and follow random walk principle. The fact that so many like Larry Williams and Paul Tudor Jones along with many other long term consistent traders pull money from the financial markets prove this if a more detailed analysis of the random walk theory is applied and you will see some interesting results through cycle analysis.
Understanding cycles and through tracking where they are I their current phase gives you a pretty good idea to where the financial market is headed for a short distance into the future with high level of accuracy.
Understanding Cycles & Automated Trading System Implementation
The stock market or any financial instrument chart is similar to an aerial photo of a river. There are times (sections) where the price movements appear random while other sections have distinctive cyclic pattern (waves or a snake like pattern).
No matter how good you are of a trader or investor you are, trading the markets requires us to take a leap of faith along with many assumptions to follow our trading system whether it is an automated trading system or not.
Understanding cycles is just a piece of the overall puzzle although I would account for it to be 1/3rd of my analysis for timing and position management of my automated investing system.
So what are the other pieces of the puzzle?
Glad you asked (subconsciously)!
According to my research the market is in a cyclical state roughly 20-35% of the time. Logic indicates that you should have a trading strategy that can identify and trade this type of price action.
The stock market trends roughly 25-35% of the time also. So another trading strategy is required for taking advantage of this price action also.
And then there is the random none tradable price action. This is when the market is giving off mixed signals and this typically happens during a change in market conditions from an uptrend to a down trend or from cyclical price action to a trending market.
Understanding and identifying what I just talked about will greatly improve your trading, investing and reduce stress and emotional trading.
My Automated Trading System Identifies Active Cycles and Trades
In conclusion, it took me years of studying cycles to master identification and timing of trades based around them and to be honest I am still learning and improving this process.
If this short tutorial sparked some interest then I highly recommend opting in to my free newsletter below. In a week I will be making my soon to be published book “Technical Trading Mastery – 7 Steps To Win With Logic” which is the perfect holiday read and trading education book to kick start 2014. I will be making the book available to my followers only two months before it’s available on Amazon, Barns & Noble’s etc., which won’t be until Feb.
While I am bias towards this MUST READ BOOK, I feel it will truly improve how you think, feel and trade the markets for the rest of your life.
Happy Holidays, and remember to send me your feedback and ideas on topics you would like to learn more about!
JOIN MY FREE ETF TRADING NEWSLETTER & GET MY BOOK 2 Month EARLY!

Chris Vermeulen – www.GoldAndOilGuy.com
When it comes to becoming a successful investor or your, automated trading system development process for that matter, there are some big picture things that you must have figured out. Here are some tips that will help you get started in becoming a long term consistent and profitable trader, investor or automated trading system developer.
Having A Master Plan
I’m not talking about a detailed trading plan, but a plan on what strategy or automated system you want to develop over the next 3-6 months. For example, you might have a goal to develop two trading strategies over the next 6 months. One strategy for uptrends and the other for downtrends.
Making money in both market conditions is crucial for long term success and these two strategies you should be focus. All your strategy development should be focused on reaching these two primary goals.
This master plan does not necessarily need to be detailed. It is simply your reminder to keep you focused and on the right path. You should probably review your master plan on a weekly bases. For more information on why having a master plan and treating trading as a business is important see Brian’s course which I took myself also… Trading As Your Business.
The Trading System Development Step-By-Step Process
If you’re like most people you are developing your trading strategies and automated trading systems without following a well-defined process and understand the steps and order things need to be executed for trading system mastery. If this is you, then you need to focus and figure this process out before doing anything else. You are probably missing trading opportunities, wasting time and spinning your wheels wondering why you are not seeing progress. I’m going to give you a recommendation that can really boost your effectiveness as a strategy or automated system developer.
 You must create a process on how you build and test your trading strategy. Your system development process should explain how to test and what to test. It should describe the order and flow of your development process along with check-lists on what types of orders should be used for stops, targets and exits.
Using a documented system development process will provide structure and discipline so you can get your trading system built, tested and making your money in a much shorter period with less frustration.
In short, it will do wonders for your system development process. “Trading System Mastery – by Brian McAboy” is a fantastic starting point on building your own trading strategies and automated trading systems. I took his course a few years ago to help refine my trading goals, rules, and automated trading system blue prints for my programmers. Brian and I now talk weekly and are good friends.
I’m also working on explaining this development process in more detail. When I finish I will send you an update.
Don’t Get Distracted, Have Laser Beam Focus
Distractions and procrastination is a big problem for many of us. We get distracted from what we are doing very easily. Anytime you find yourself starting to wander from your task of building, testing and running your first system, ask yourself if what you are doing is getting you closer to your goal.
Don’t start chasing every new trading idea, concept or indicator you read about, I know… It’s easy to do and exciting but DON’T! Do what I do, make a detailed note with all the thoughts you have on that idea so you know that when you finish with your first system, you can go back, review your notes and look deeper into that idea you had. Trust me, this will do wonders to your progress and mind frame.
There is no better feeling than seeing progress on a trading system and knowing you have 5 -10 other great ideas on paper to work on next… The sky is the limit, but focus on one idea/strategy at a time.
There Is No Get Rich Quick Trading System – Not many…
We all know there is no consistent get rich quick trading system, but there are some that can make you wealthy within a year if the stars align and you are extremely aggressive. What I am referring to are the futures compounding strategies some of the lucky traders were blessed with.
Yes there are some traders out there who actually turned $10K or $50K into $1, $2, or $4,000,000 within a 12 or 18 months. But they are few and far between. This type of trading requires 100% risk capital and you more or less win huge or lose it all, although I am working on a very exciting project now on how to do this with very little downside risk using one of my intraday futures trading systems. I will update on this in a few weeks once I have more solid numbers.
Anyway, back to NOT getting rich quick…
You need to expect the journey to financial freedom to be painful at times but if you follow your proven systems your success can be consistent and that is what is important. You will make mistakes and the markets will humble you at times. There are no free lunches and you will work for a strong return on your investment.
Money Management – Manage it or Lose
Once you have a solid performing trading system, you will need to start learning and testing out the best way to manage positions. This is also known as money management. Doing so can really leverage your system or simply be the difference between it making money or not. I recommend read a book or watching videos on money management on how to scale in and out of positions as that is the key to success I think.
Don’t Wait Until It’s Perfect
Perfection does not exist with any trading system. The financial markets are always evolving and you will have losing streaks and winning streaks. Just make sure the system is working correctly. Test it in simulation mode and start trading it with small amounts of money. You are system will never be perfect and it does not need to be perfect in order to make money.
Do Not Ever Fool Yourself – Fudging the Numbers is a NO NO
Do not attempt to fudge numbers while testing your trading system. Be honest in your backtesting reports and manually review all backtested trades for completeness and accuracy. General rule of thumb… double your commission costs, and factor in 25% slippage. This may sound crazy but you will be amazed at just how accurate these numbers will be with your real-time results with real money.
If your automated trading system does not post gains with commission fees and a 25% slippage, then continue to improve your trading strategies. Set Goals, Reach, Repeat… and nothing less…
Talk soon,
Chris Vermeulen
P.S. Join My Free Ideas & Education Newsletter!