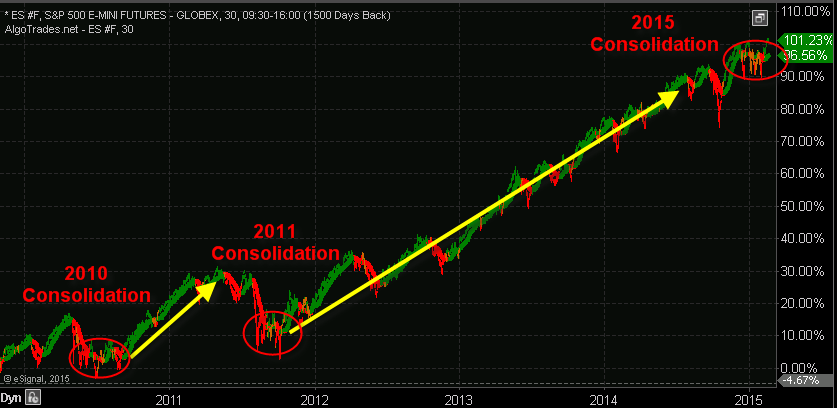
The S&P 500 stock market has been under strong rotation since mid-2014. Rotation in the stock market is when the trend changes direction from an uptrend to a downtrend or vice versa. But the really exciting part is that after strong rotations in the market similar to what we are experiencing now, the stock market always makes massive moves to profit from shortly after.
Depending how the price moves during market rotations individual traders, CTAs, hendgefunds and even algorithmic trading systems can generate large profits. But price action must be favorable to meet every ones risk/reward rules.
Unfortunately during the second half of 2014 the stock market rotation moved in a way that did not generate many trades. But no trades are better than losing trades so it’s not the end of the world, and the good news is there will always be more trades.
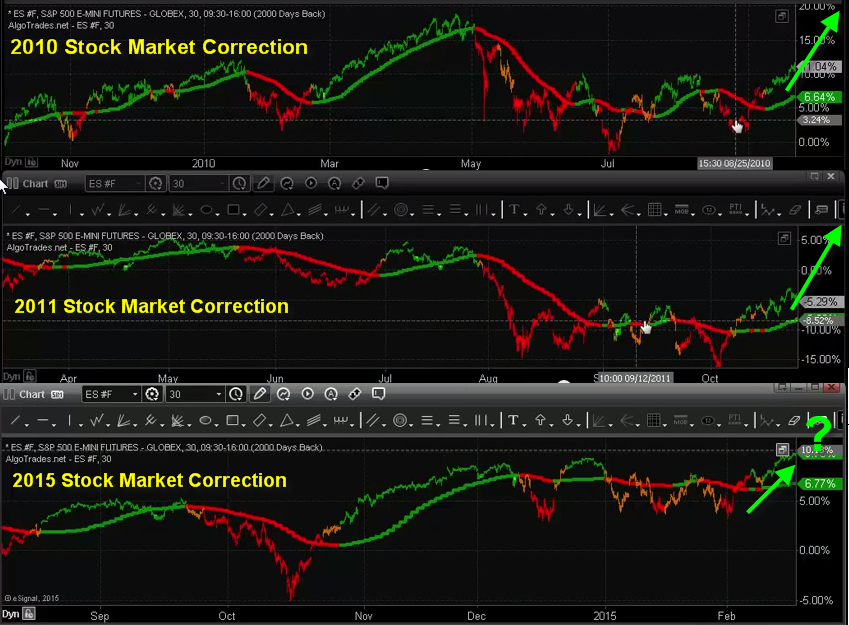
But what I want to show you here is how the current price action of the stock market we are experiencing is identical to what we saw in 2010 and again in 2011. Also keep in mind that if equities are going to have a another big move it will generate other opportunities in precious metals, energy sector, and commodities. ETF’s are what I use to take advantage of these large moves with my ETF trading newsletter.
2015 is going to be a BIG year for traders
and algorithmic trading systems!
These consolidations (pauses) in the stock market have led to substantial rallies in the stock market of 30+% gains over a six-month period and its looks like it will happen again.
My algorithmic trading system has struggled during the strong rotation of recent but so have most CTA’s and other money managers. There is not doubt that it has been hard to profit with these swings in the market because of how they formed.
When this phase of the market completes and a new trend emerges traders and algorithmic trading systems will excel and be highly active again just like they were in the first half of 2014.
https://thegoldandoilguy.com/wp-content/uploads/2015/02/corrections.png625849adminhttp://www.thegoldandoilguy.com/wp-content/uploads/2014/11/tgaoglogo.pngadmin2015-02-18 20:55:512015-02-19 18:24:452015 Stock Market Forecast And Your Trading Plan
Algorithmic trading which is also known as automated trading has changed the way I trade and invest dramatically. As you know trading is extremely difficult to be consistently profitable in. The #1 reason individuals fail is because they struggle with their emotions and end up trading with the general market sentiment. While the herd mentality/feeling can and most of the time feels like the proper (logical) way to look at the market, trading with the “herd mentality” is the silent killer.
I am going to teach you how to read market sentiment so you can swing trade and profit consistently from emotional traders to earn 1% – 3% per month trading the SP500 index. If you want to make money, you need to trade against the herd (masses) at key support and resistance levels in the market. Plus you should have a robot (algorithmic trading system) execute these trades for you. Because, you need to completely remove your emotions from the game, and because it’s not rocket science to identify key levels where you should be entering and exiting the market with your money.
You start by looking at the market completely backwards. Focus on buying positions during heavy volume sell-offs (panic) and sell your positions during heavy volume rallies (greed). This was a very tough transition for me and I still get nervous and emotional during these times when my system enters and exits positions. This strategy feels completely wrong at the beginning but the profits speak for themselves!
One Of My Algorithmic Trading Strategies
This trading strategy is my favorite because I know the masses are panicking out of positions, sweating, and having heart burn, while my automated trading system is entering a high probability position against them. This analysis may seem basic at first glance, and that is because it is, but when you combine the analysis of each indicator explained below, you end up with a highly effective trading strategy. I took things on step further and converted into an automated trading strategy. This is one of nine automated trading strategies I use.
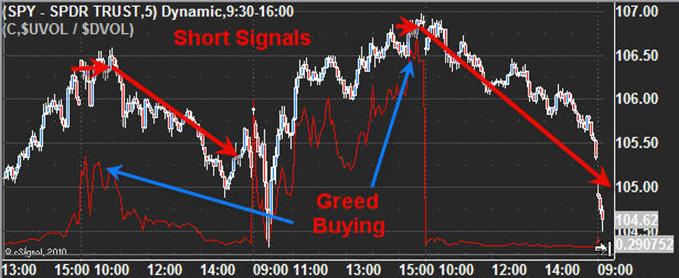
This SP500 chart shows where a high probability short trade should be executed based on the algorithm trading indicator. It is important to know that over the past 6 years the SP500 has provided a 1.25% profit on average each time one of these extreme sentiment readings occur on the charts. While that may not sound like much of a return, know this happens several times each month and better yet, if you trade the ES mini futures, you get a lot more leverage. ES trading turns a 1.25% index gain into roughly a 10% gain based on futures margin requirements for one contract.
Anyways, the red indicator on the chart is a simple volume based indicator which measures fear and greed in the market. It is very accurate at picking market tops and bottoms. And I calculate it by taking the NYSE up volume and dividing it by the down volume. When you see this indicator start to rise it tells us the majority of traders (the herd) are buying (greedy) and we should start looking for a short entry.
Let me show you how to find the trade using the market sentiment…
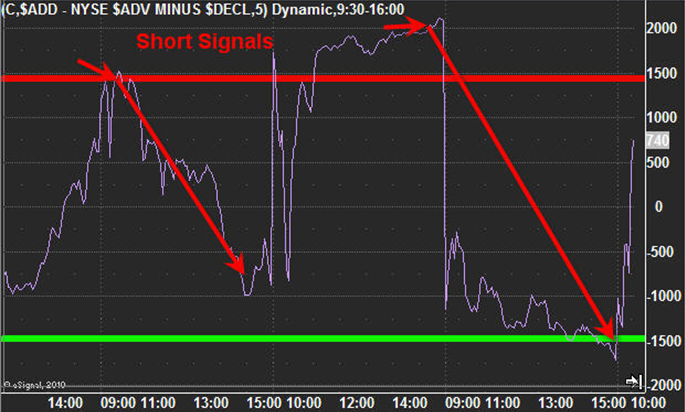
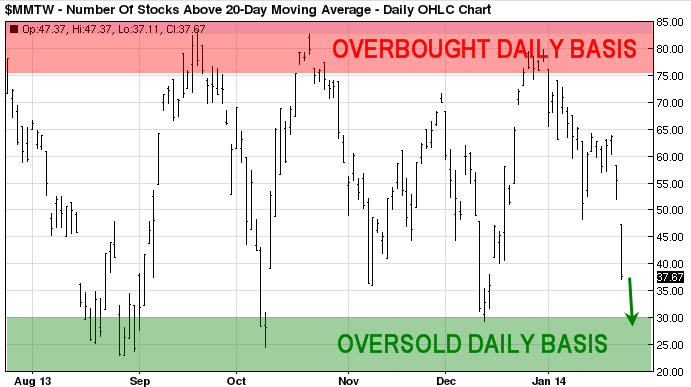
The NYSE advance/ decline line Algorithm Trading Strategy #2
How to use the NYSE advance decline indicator. It’s simple really, when there are 1500+ stocks trading up on the day then the market is getting overbought. Meaning too many stocks have moved up in a short period of time and traders will most likely start taking profits. When the other two indicators talked about in this article are confirming a short sell signal the odds highly favor a selloff in the stock market that should last 1-3 days.
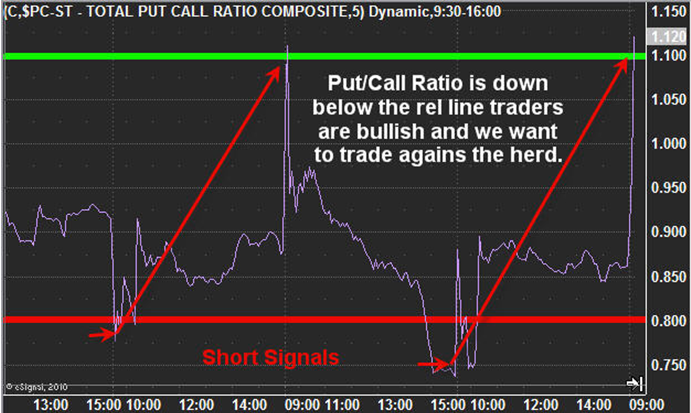
Last algorithmic trading strategy #3 is the put/call ratio
The put call trading algorithm can be a little tougher to use at times because when the market is trending down the ratio tends to fluctuate near the top. It stays near the bottom of the chart when the market is trending up but it is just the extreme spikes we are looking for.
When the broad market bounces and we see the put/call ratio drop into the lower band it’s telling me the majority of traders have finally become bullish. This tends to happen once a previous high is broken as it triggers short covering and breakout traders start to buy within a false rally during a down trending market.
Algorithmic Trading Strategies Conclusion:
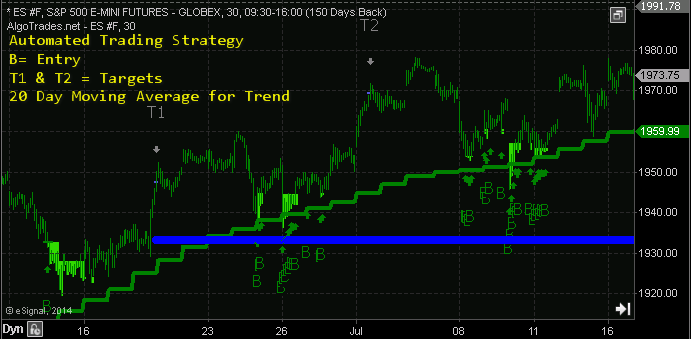
If all you do is use these three indicators, focus on the 5 or 10 minute charts, trade only with trend of the daily charts 20 day moving average, and take partial profits at 1%, again at 2%, while keeping a small position open as a trend trade, you will become a more consistent trader and be able to profit from a falling stock market.
My proven algorithmic trading strategy running live but this is in a rising market… $3200 in profits made quickly, with low stress and 100% hands-free, what else can you ask for…?
It is critical that once you take partial profits at a 1% gain, you start moving your protective stop into the money to lock in a profit for the balance of the position. All three indicators need to reach the extreme levels at the same time for a trade to be triggered. Know that I have seen the market continue a trend during extremely oversold market conditions which lasted for months at times. Do not try to bet against the market just because you think its oversold and should not be shorted, just ride the trend for all its worth. Eventually your last trade will lose as the trend reverses, but wait for it, and expect to lose a trade from time to time,
Final thoughts, this strategy works just as well during a bull market. There are some minor changes required on each of the indicators which I will cover in another automated trading strategy article soon, so stay tuned for more logical trading tips.
Have My Bull & Bear Market Strategies Automatically Traded For You: www.AlgoTrades.net
Chris Vermeulen
https://thegoldandoilguy.com/wp-content/uploads/2014/07/algorithmic-trading-strategies-5.jpg207244adminhttp://www.thegoldandoilguy.com/wp-content/uploads/2014/11/tgaoglogo.pngadmin2014-07-23 21:12:122014-07-23 22:14:43Algorithmic Trading Strategies with Market Sentiment
I apologize now for the Christmas colored charts below… Its a lot of red and green but these are the most understood colors for knowing what ranges means (bullish or bearish).
This was a very emotion week for traders. The strong selling Thursday and Friday has traders and investors running for the door and panicking out of positions. While I did close out our long SP500 swing trading on Thursday to lock in a profitable trade, I do feel as though we can re-enter next week a better price.
The only ones feeling pain today are those who do not have enough self-discipline to create rules and trade by them. Again this is talked about in GREAT DETAIL in my new book. If this is you, I recommend buying my book and reading it this weekend as it’s a quick and simple read. There is a paperback version or instant PDF download available: Get Book.
Without self-discipline no amount of courses are trading services will make you a successful trader.
Let’s get technical and jump into the charts…
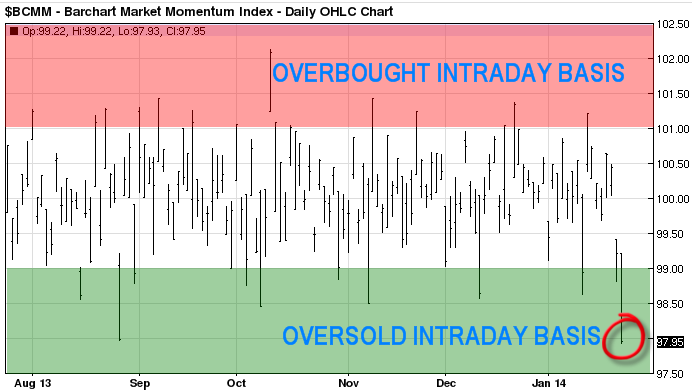
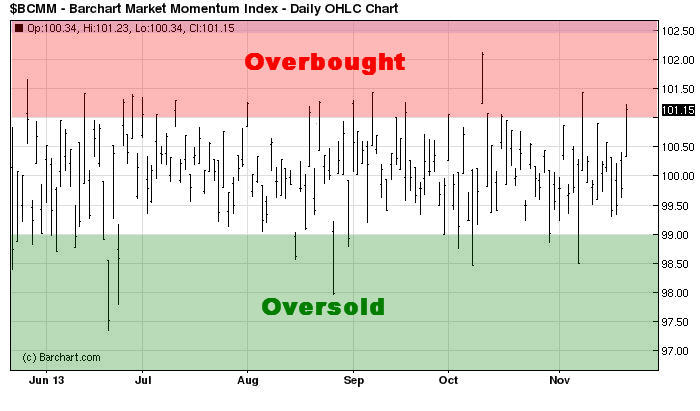
Momentum Index – The Intraday Extreme Overbought/sold indicator
This is an indicator I follow daily to understand how strong the selling is. If it is broad based or sector related. The last two sessions clearly shows is broad based and that the market has moved to quickly in one direction and is primed for a knee jerk reaction bounce.
This is a fantastic tool for timing key pivot lows and highs in the broad market. We are nearing another key pivot low but there is still room for more selling next week.
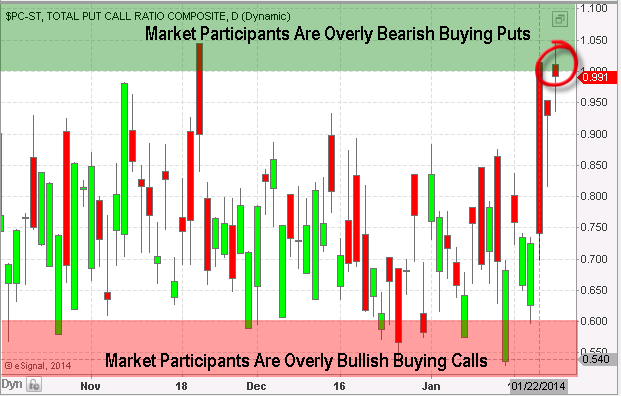
Options Traders Are Fearful of Continued Selling
If you don’t know what the put/call ratio is, in simple terms it tells us when the majority of traders are buying put options (expecting stocks to fall, ratio of 1.0+), and when they are overly bullish (expecting stocks to rise, ratio below 0.60).
The chart below shows everyone is leaning towards more selling in the stock market. I use this as a contrarian indicator.
The Fear Trade – Shorting Fear with an Instrument that Naturally Loses Value: VXX
There is a lot of interesting way to trade the stock market and once way it through shorting the VXX ETF during bull markets. Instead of buying a long position in stocks, you could simply short the VXX fund. This thing loses value over time because of the way it’s managed/constructed. So logic says, shorting it on bounces can be very rewarding during times when fear is high.
Keep in mind this fund and its underlying index moves FAST with 20-30% percent swings… Trade small position sizes if you ever touch this thing…
Weekly Technical Trading Report Conclusion:
In short, (pardon the pun) I feel the stock market is setting up for another big bounce. The technicals and longer term trend remains bullish. I trade with the trend until proven wrong. Only then will I change the direction and trade with the new trend.
Algorithmic trading is not something I ever thought I would be doing and it did not really exist 15+ years ago with I started investing. Fast forwarding to today all we seem to hear about is “HFT” high frequency trading, automated, black box trading, and algorithmic trading and how they are making people a boat load of money or almost bankrupting companies overnight like Knight Capital…
Since 2001 I have been sharing my technical analysis, knowledge, and trades with fellow traders online. And over the years through one-on-one coaching, or through financial newsletter it became very clear that emotions and human tendencies will never change when it comes to emotions (fear & greed) along with ones commitment to stick with a plan/strategy without deviating off course no matter how boring or slow it may be.
“The financial industry wants you to think investing is complex,
but the truth is: investing is and must be kept simple
and the best way is through algorithmic trading!”
After five years of personal coaching and newsletter writing for swing and day traders trying to help with their habits, techniques of what I knew worked very well for me, was not something most clients could not succeed at even when they had every step/rule identical to what I was doing to make money. This problem led to me thinking outside the box to figure out why and how I could get others to mimic what I do best so they too could enjoy the freedom and peace of mind knowing they are in control of their life.
After several few months communicating with clients, professional traders and educators across the globe and covering many different topics on education I found what I was looking for. The problem lies with us being human. You see, people are very emotional and during heightened times of excitement or fear they tend to react from instinct rather than to follow a set of rules.
People have the tendency to stop doing a task over time that is repetitive in nature, even if it’s making money for them. And it was this conclusion that triggered my thinking to build a system that will trade my strategies using my rules and execute trades automatically without myself or clients having to do anything. This is when my focus on algorithmic trading became my new passion and the driving force of my automatic investing system for individuals.
What is My Simple Automated Algorithmic Trading System?
In short, an algorithmic Trading System is a set of rules and formulas programmed into a trading platform. The algorithmic system places trades automatically according to the sets of rules we create. These rules are built to allow investors to have increased income potential that a properly traded strategy can provide without the need to watch the computer screen all day and manually enter and exit positions when you think the time is correct.
With the use of technology we can now benefit from our strategies by converting them into computer formulas and optimize them for specific investments and make complete automated algorithms. My S&P 500 algorithms were designed and built so I could have more free time while still making the same amount of money if not more and to trade without my emotions getting in the way. This strategy has worked extremely well over the year and I now want to make it available to a select group of individual investors to get the full benefits of what my system provides me with.
Investors BIGGEST Problem and How to Avoid It With Algorithmic Trading
In short, the problem we all have as traders is the fact that we are human. Riddled with bad investing habits, and responding to market fluctuations emotionally rather than logically is why we have trouble making money consistently over the long run.
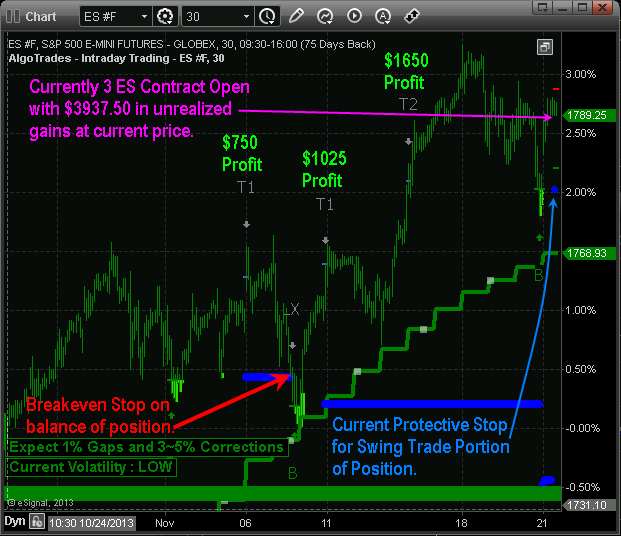
Here is a recent screen shot of my trading systems intraday algorithmic trading strategy used during an uptrend. Trading the ES mini futures this algorithm pulled $3,425 in two weeks when most traders were getting shaken out of trades. No keep in mind this is one strategy out of the twelve that are traded with my complete algorithmic trading system. Other strategies are based on the various time frames, trends and volatility to be sure we have all types of market fluctuations covered.
The rich do what’s hard; that’s why their life is easy. The poor do what’s easy; that’s why their life is hard.
Next I want to show you how to trade like an emotionless robot, how it works, why, what to trade, and how much capital is required to have this algorithmic trading automatically traded in your brokerage account to make a decent living trading the S&P 500 index which is the least volatile and most liquid investment available to traders and investors. A really exciting part about it is that you do not need to learn or installed anything. It is a truly 100% hands free investing system that provides annual results that will make your financial advisor envious!
Stay Tuned For Part II Of How & Why You Should Be Algo Trading…
Chris Vermeulen
http://www.thegoldandoilguy.com/wp-content/uploads/2014/11/tgaoglogo.png00adminhttp://www.thegoldandoilguy.com/wp-content/uploads/2014/11/tgaoglogo.pngadmin2013-12-07 14:10:442014-03-04 12:48:46How Algorithmic Trading Became My Focus, Passion & Income
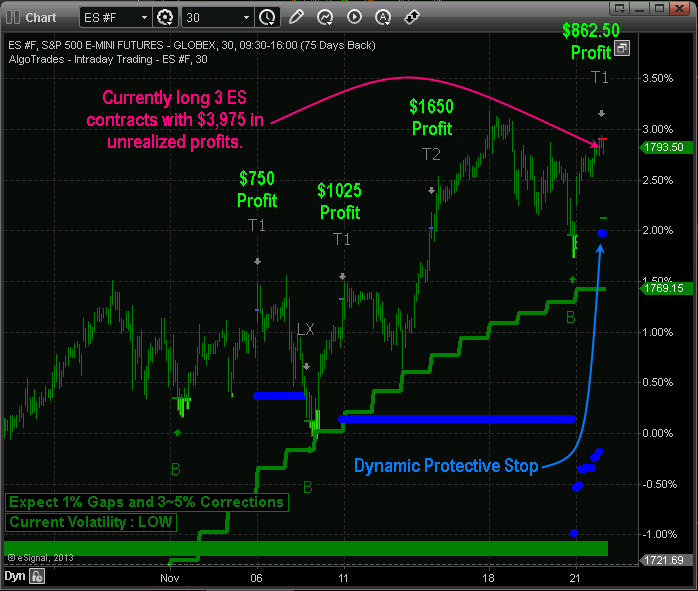
Pre Algorithmic Trading System Analysis: This week has been a little wild as stocks pulled back due to headline news. The two big drops which took place on heavy volume sent market participants into an emotional state liquidating their long positions on fear of a collapse. Even though the stock market shows no sign of the trend reversing down, traders are jumpy and quick to lock in gains with any negative new. Sounds like a “Wall Of Worry” to me.
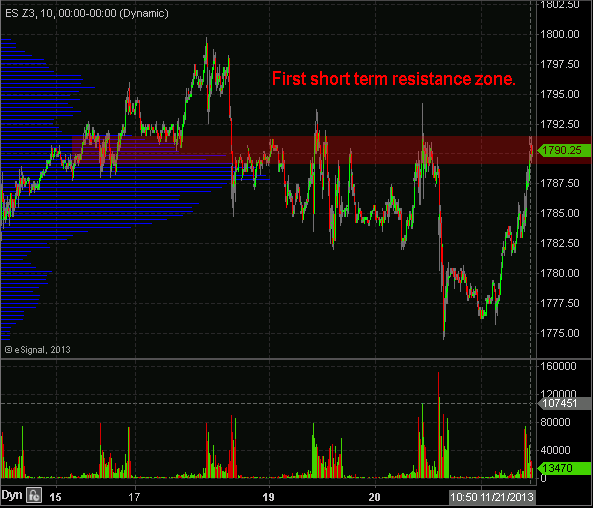
Taking a look at the ES mini futures chart below which is a ten minute intraday chart. It is clear the recent pop in price is testing high volume resistance as seen on the chart with the blue horizontal bars.
Also the previous pivot highs and consolidations on the chart highlighted in red also confirms there is price resistance at this level. Thursday’s rally is likely ready for a little pullback or sideways consolidation at this point based on this information.
If we take a look at the Barchart Market Momentum index which is something I follow closely because it tells me when stocks have moved to far too fast in either direction. In simple terms, the market is either overbought or oversold when this chart reaches either extreme.
When the market closes with this indicator in the overbought or oversold zone, you should expect a pause or 1-3 day reversal in the opposite direction.
But keep in mind, when the trend is up, the only high probability zone to focus on is the oversold. We want to buy dips within an uptrend, and take partial profits or tighten our stops when the stock market is over extended to the upside. This is exactly what members and myself did today, locked in some profits and tightened our stops, well my Algorithmic Trading System told us to do it…
Logical Market Analysis Combined with Automated Algorithmic Trading System
Reviewing the charts for high volume resistance levels, previous pivot highs and lows, and a close eye on the Barchart momentum index like we just did in this report is only the tip of the iceberg when it comes to complete market analysis.
There are many other things one should analyze for precision market timing of the broad market. The stock market has several different forces at play which move price and using a type of analysis which I call INNER-Market Analysis allows us to capture all the market moving forces within one indicator. This February when my book is published on INNER-Market Analysis and algorithmic trading systems all this information will be available if you would like to learn more.
Some other areas of the market which must be analyzed are trends, active cycles, volatility, volume flows, and market sentiment to name a few.
Over the years I have been converting the way I analyze the market into an algorithmic trading system that catches each overbought and oversold market condition on specific chart timeframes. I have also implemented position and money management rules for the algorithm to trade in my brokerage account completely hands free which I must admit is the coolest feeling thing to experience.
What is an algorithmic trading system? A trading algorithm is nothing more than a bunch of rules which you create (your trading strategy) converted into a computer language so a financial charting platform can run your trading strategy automatically. Everything is done for you including the trading. The only thing the system creator needs to do is monitor the algorithmic trading system for technical issues and possible tweaks here and there.
Take a look at the 30 minute algorithmic trading results
Since Oct 30th the S&P500 index has been chopping around and shaking traders out of their long and short positions with intraday price whipsaws (nominal new highs and lows which runs the stops of the average market participant). The index is only risen by 1.2% in the last 23 days while my algorithmic trading system which trades the S&P 500 index futures (ES Mini) and/or (3x Leveraged ETFs UPRO & SPXU) has been pulling money out of the market at an incredible rate.
Remember these trades in the example chart above are just two types for algorithms trading within my system. There are 12 algo trading strategies covering all market conditions automatically managed in one complete solution.
Conclusion About Using an Algorithmic Trading System:
Trading or investing for that matter is no easy task. And I know firsthand that even if one has a proven winning strategy it’s almost impossible follow the rules and catch every trade setup generated. I do not know how many times I see perfect setups about to unfold and then miss them because I was reviewing other charts, sending an email, going to the washroom or grabbing a bite to eat.
These missed opportunities along with a few other reasons I will explain in my next post, is what got me started programming my trading strategies to do exactly what I showed you here.
I will admit, it has been a major learning process, ridiculously expensive to create and I can safely say that I now know several of the main stream programmers available. I also know who can make miracles happen and who cannot.
This post is to share with you some new and exciting things unfolding based around my index trading strategy. Over the next week I will share my story of how algorithmic trading became my focus, passion and automated income stream and how you can do it also.
Chris Vermeulen
http://www.thegoldandoilguy.com/wp-content/uploads/2014/11/tgaoglogo.png00adminhttp://www.thegoldandoilguy.com/wp-content/uploads/2014/11/tgaoglogo.pngadmin2013-11-21 23:30:532014-03-04 13:38:31When To Trade? My Algorithmic Trading System Shows You