How to trade technology stocks or the technology sector moving forward may not be that complicated. This report shows you where the big technology stocks are likely to go in the coming week or two. This is based strictly on technical analysis not fundamentals as fundamentals typically lag the market drastically.
If you have been following my analysis for some time you will recall the detailed report on AAPL and RIMM shares last year when I called the top in Apple shares and the bottom for RIMM (BBRY). In that report I walked you through the stages which stocks go through and where each of these stocks were trading at then. Be sure to review the charts quickly here: http://www.thegoldandoilguy.com/collapse-of-apple-rise-of-the-blackberries-stock-market-cycle/
In this week’s report I talk about the technology sector in more detail using the tech giants like Apple, Google, Yahoo, BBRY, and the XLK tech sector exchange traded fund. A picture says a thousand words so here are a few thousand words in picture format with my analysis and thinking as of this week.
Keep in mind that the market changes each day so forecasts and outlooks can flip within a couple days so nothing is set in stone and subject to change.
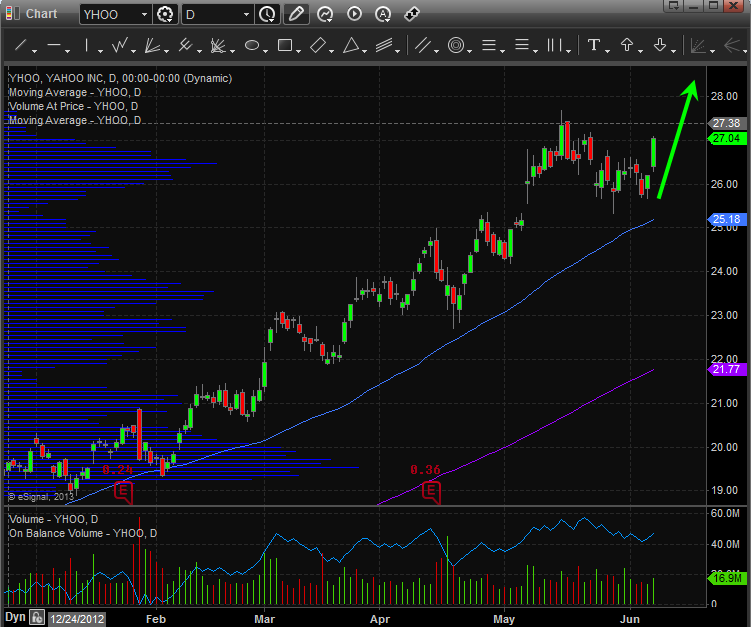
YAHOO – Daily Chart
Yahoo is in an uptrend with strong share accumulation. It continues to form bullish price patterns and points to higher prices in the coming week.
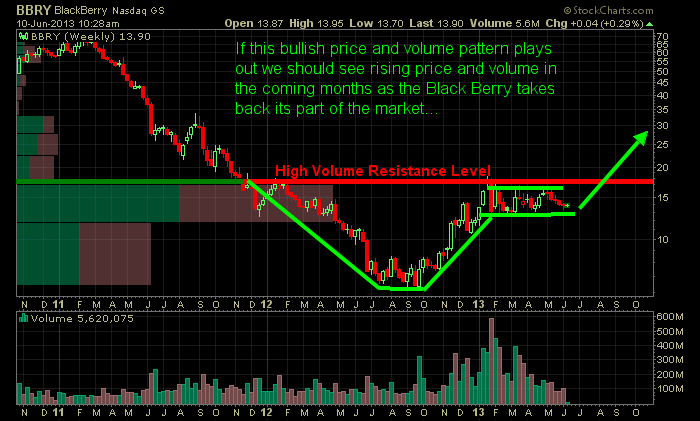
Research In-Motion/Back Berry WEEKLY Chart:
This is a weekly chart so things move much slower. But overall the pattern on BBRY is very bullish and if the broad market does not start a correction this stock price should test $30 per share this summer.
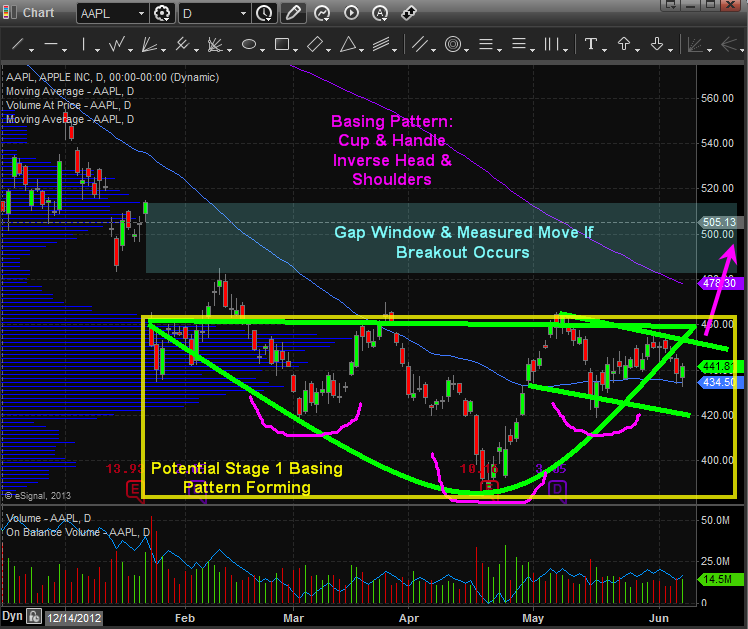
Apple Daily Chart:
Apple topped out months ago but is now starting to look ready for a bounce. It is forming a possible stage 1 base, and an inverse head & Shoulders pattern. Both point to higher prices and a gap window fill which is the next higher volume resistance zone.
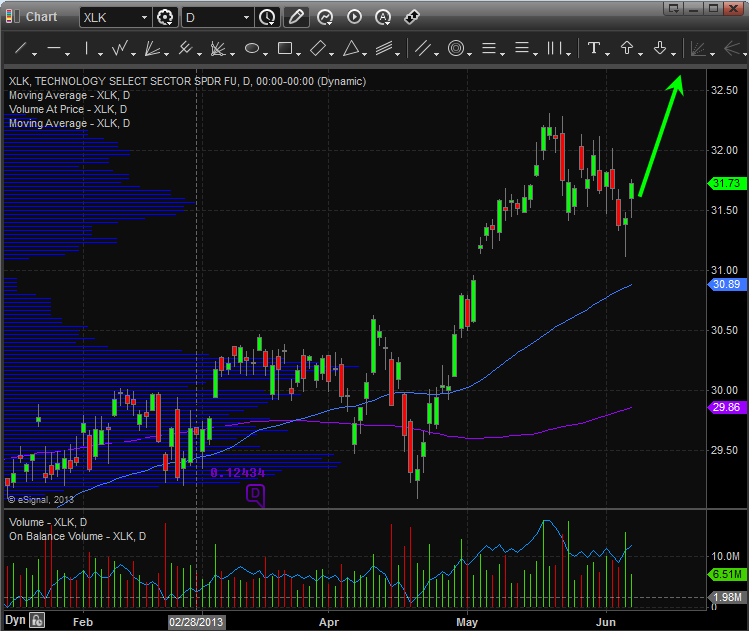
XLK – Technology Sector Exchange Traded Fund
While I like the potential of individual stocks you are subject to individual news etc… which is a little to risky for my blood but my trading partner specializes in this type of trading and has been making a killing this year with his subscribers at www.ActiveTradingPartners.com. The more conservative trader can focus on a basket of technology stocks using the XLK ETF which shows higher prices in the next week or two also.
Another way to play this is through options which is technically the least risky trading strategy there is when done correctly. You can see from these results options are VERY powerful – Options Trading
Technology Trading Conclusion:
In short, I like how the technology sector is looking for a continued move higher. Keep in mind the report I did a week ago talking about the intermediate cycle topping out for the SP500 soon. Stocks may just reach their recent highs then roll over in a big way. So any gains should be protected with partial profit taking and a protective stop.
I know most Apple enthusiasts will be rolling their eyes with my analysis and that’s fine because the rest of us need people to buy our shares as we unload long positions or sell Apple short ?.
All joking aside, the charts below clearly show some very interesting information you cannot afford to overlook. At minimum, take a quick glance at the charts which tell the full story on their own…
The Four Stages of AAPL & RIMM
Markets are cyclical in nature. There is a constant process of expansion and contraction, rally and decline that continues as the market determines the theoretical fair value of a security. The sum of these moves forms an unquestionable cyclical pattern consistent within all time frames.
During a cycle a stock enters different phases of support, from irrational exuberance typically found before its peak, to periods of widespread discontent where its price is continually punished. However there are never distinctly good or bad stocks.
Every “good” stock will eventually become a bad one and vice versa. There are however good trades; trades that reward an investor who has correctly anticipated a move and positioned himself accordingly.
It is important to note that this works with commodities like gold and silver which are trading at a VERY interesting point in their life cycle. Looking at various time frames in GLD and SLV you can see this.
Classic economic theory dissects the economic cycle into four distinct stages: expansion, trough, decline and recovery. A stock is no different, and proceeds through the following cycle:
Stage 1 – After a period of decline a stock consolidates at a contracted price range as buyers step into the market and fight for control over the exhausted sellers. Price action is neutral as sellers exit their positions and buyers begin to accumulate the stock.
Stage 2 – Upon gaining control of price movement, buyers overwhelm sellers and a stock enters a period of higher highs and higher lows. A bull market begins and the path of least resistance is higher. Traders should aggressively trade the long side, taking advantage of any pullback or dips in the stock’s price.
Stage 3 – After a prolonged increase in share price the buyers now become exhausted and the sellers again move in. This period of consolidation and distribution produces neutral price action and precedes a decline in the stock’s price.
Stage 4 – When the lows of Stage 3 are breached a stock enters a decline as sellers overwhelm buyers. A pattern of lower highs and lower lows emerges as a stock enters into a bear market. A well-positioned trader would be aggressively trading the short side and taking advantage of the often quick declines in the stock’s price. More times than not all of stage 2 gains are given back in a short period of time.
While these stages are historically defined over long time periods they actually exists in all time frames, allowing traders to take advantage of a cycle regardless of their trading time frame. Fortunately this phenomenon, known as a “fractal”, exists within all security markets. A fractal is simply a rough geometric shape that can be subdivided into smaller parts that have the same properties; a smaller version of the whole.
This is important to understand because through technical analysis as we are often analyzing multiple time frames. In the short term, the four stage model may repeat itself many times. The combination of these short term cycles form a medium term cycle, and the combination of multiple medium term cycles form a long term cycle. Recognition of these cycles is paramount in trading success.
The Four Stages Profile: This signature profile happens over and over again in the market and all the great leaders eventually become laggards.
REAL LIFE PROFILES:
Variety in Trading
Investment securities (stocks, ETF’s, options, futures) can be described as being similar to different types of athletes, each with their own unique style and personality. Some can be characterized as sprinters, participating in quick bouts of movement but tiring quickly. Others could said to be more similar to a marathoner, enduring prolonged courses in one direction without pause or interruption.
When I look to make a trade I look for sprinters as historically I have had the most success with them. Other investors like pension and mutual funds are more interested in the long term marathoner that provides steady performance. There is no one way to trade; each method can be equally profitable or unprofitable. It ultimately comes down to what style works best for you, and the only way that can be determined is through trial and error.
Different phases, different strategies
As noted above, the market alternates between periods of trending activity and periods of consolidation. In a trend (stages 2 and 4) there will be an expansion of the price range in one direction. An uptrend will have a series of higher highs and higher lows (stage 2), while a down trend will produce lower highs and lower lows (stage 4). In a consolidation there will be a contraction of price range prior to a reversal in trend. This neutral stage is avoided by trend traders.
A stock in stage 1 or 3 is typically correcting itself after having experience a prolonged move in one direction. These corrections are found after periods of extreme movements that often conclude with emotional and undisciplined trading at peaks and troughs. Trading these two stages is quite different than 2 and 4, and this book will teach you how to manage your risk and trade these stages responsibly.
A short term consolidation within a primary trend is one area where we want to study the price action of a security for clues as to whether there will be a resumption in the trend, continued consolidation, or reversal. Sometimes however it is difficult to identify any order or consistency on any given time frame.
If you are a trend trader these periods should be avoided. Trading has enough inherent challenges already and at all times a successful trader will only be searching out those trades that have a high probability of being profitable.
Trading is all about finding an edge or an advantage and exploiting it for maximum profit. If there is no such edge than there is no reason to be involved. I will say this now and again many other times: Sometimes the best trade is no trade!
Naturally, regardless of the stage a stock is in or your conviction of its direction, risk of financial loss is always inherent in trading and this is critical to always keep in mind. The most successful traders are not immune to this and they too will have unprofitable trades. The key is to minimize those loses by only trading those stocks that have the highest probability of being profitable. This is what separates the profitable and professional traders from those that lose money.
Emotions and Lifecycle Analysis
History has an uncanny ability to repeat itself. Whether it’s the rise and fall of an empire or the rise and fall of a stock, there are clear cycles that are prevalent throughout history.
People may change, but human nature, and our ability to act, react and overreact is simply an innate part of our being. This predictability is what forms the basis of technical analysis and provides a trader with an edge with which to trade upon. When we are analyzing cycles we really are analyzing emotions, trying to gain insight as to how market participants are behaving.
Upon conducting such analysis it can at times seem that markets are be behaving “irrationally” and out of order. Undisciplined traders often fall victim to their emotions and lose control of their objectivity. As people behave irrationally, so too does the market, and unfortunately these conditions can persist for long period of times.
John Maynard Keynes is often quoted for suggesting that “The markets can remain irrational longer than you can stay solvent.” This is a harsh reality and puts great emphasis on the importance of discipline, risk management, and a keen eye for price action.
Emotions are what separate the successful traders from those that lose money. They can be regarded as a relentless opponent, often showing up without warnings and striking you at inopportune times. The successful trader is able to recognize their presence and maintain objectivity, constantly assessing their own strengths and weaknesses.
There will ultimately be times where you can’t control your emotions; however you can always control how you respond to them. Any time you recognize that your emotions are influencing your outlook you are already one step ahead of the average market participant. It is at this point that you step back, refocus your perceptions, examine the price action, and then take the appropriate action.
An understanding of herd or mob mentality is important in trading and can provide you with an edge over the average participant who doesn’t contemplate what is happening around them. In a mob or riot, we never know what the feelings and motivations are of all the individual participants.
There are however certain emotions that seem to appear at distinct times and a certain predictability in their development. A stock’s price action is no different. While we never know the underlying feeling and motivations of all participants, there are distinct emotions that are shared by the herd at various stages of a stock’s life. An understanding of these emotions and their implications on the price action of a stock is an advantage that the profitable trader maintains.
The Stock Market Lifecycle could be explained in much more detail, but this report gives you the foundation of stock / index trading cycles. I will be covering this topic in a future video with much more detail.
The Apple Money Tree Is Losing Its Leaves…
The Fruit War – Apples Top While Berries Bottom
It is very interesting that AAPL shares topped the same week rim shares bottomed. Could the BB10 be the turnaround for Research in Motion? Either way the market is somewhat predictable as traders and investors buy the rumor that BB10 will be good, and they sell the news once it arrives no matter the outcome good or bad. Jan 30th is when it’s unveiled so we could see RIM shares continue to claw its way out of the grave.
RIM – Daily Chart Look of Price Pattern
Conclusion:
Knowing this information is crucial to survival as this cycle happens on all time frames (1 minute chart all the way up to yearly charts). Harnessing this information for trade selection and timing greatly reduces the amount of trades you take, while focusing only on new leaders which have massive upside potential. You can see some of my trade ideas which are in Stage 1 Accumulation mode getting ready for takeoff here: http://stockcharts.com/public/1992897
Judging from the recent price action in the broad market (SP500, NASDAQ, DOW, IWM) along with AAPL shares which have a large impact on index price direction. I feel the market is setting up for a strong Santa Clause rally in the coming week.
2013 looks like it will be a VERY exciting year for trading and investing as several sectors, stocks, and foreign country indexes are in Stage 1 Basing patterns about to start a new bull market. These major plays will become part of my trading alert service at www.TheGoldAndOilGuy.com from this point forward.
http://www.thegoldandoilguy.com/wp-content/uploads/2014/11/tgaoglogo.png00adminhttp://www.thegoldandoilguy.com/wp-content/uploads/2014/11/tgaoglogo.pngadmin2012-11-23 14:29:152014-03-06 12:53:05The Golden Nugget That Makes Traders Wealthy Trading AAPL, RIMM And Gold Stocks
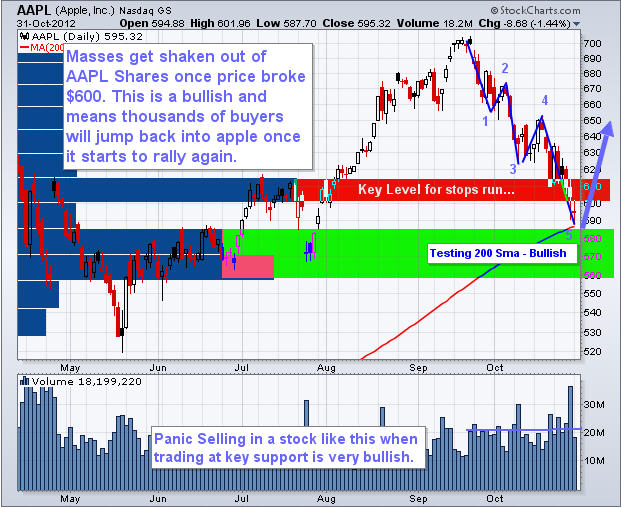
AAPL shares have been in free fall mode all October spooking investors with a $120 drop from the all-time high in September. As well all know, though it’s hard to follow without a proven trading strategy to keep us focused but the key is that you must buy when others are selling and then sell when everyone is buying.
Apple shares really have helped in holding the overall stock market up in the past but recently it has been a big drag on the broad market. Taking a look at the chart below you can see my analysis and thoughts of this giant.
The red horizontal line shows the key level where high volume traded in the past. For the market to reset (flush out investors/traders) it must shake as many longs out before it can start rising again. By the price breaking below that level which also happens to be a Century Number $600, most of the stops were placed down around this level. The volume spike of 40,000,000 shares clearly shows it triggered stops once that $600 level was broken. We want stops run because it give more power to the next rally/bounce.
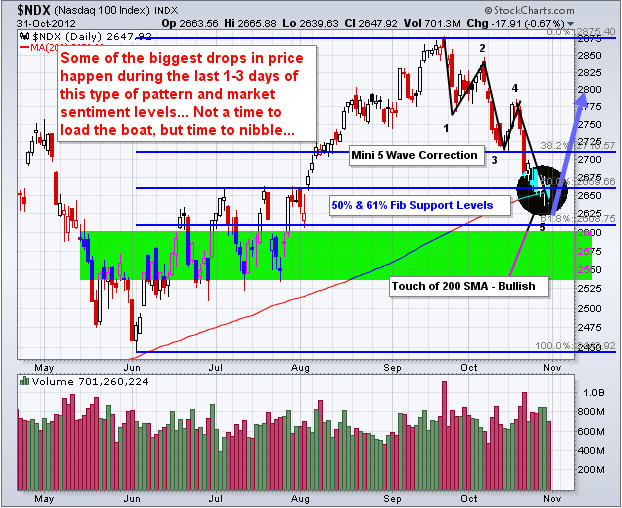
NASDAQ Index:
The NASDAQ has formed a similar chart pattern and is heavily weighted with AAPL shares. Trading NQ futures, QQQ, QLD or the XLK exchange traded fund as a much more affordable way to play a bounce/rally in the coming weeks.
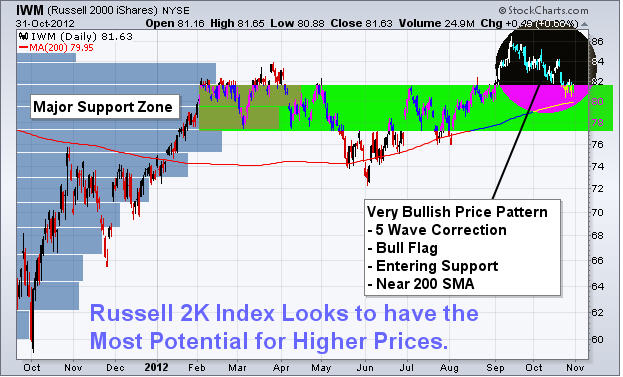
Russell 2000 Index:
I really like the Russell 2000 index because small cap stocks can rally hard and fast outperforming the large caps like AAPL, SP500, NASDAQ and DOW. This index is looking ripe for a bounce in the coming days which could trigger the next major rally to new highs. You can plan this index through TF futures contract, IWM, TNA, UWM exchange traded funds.
Trading Conclusion:
While this setup looks very promising because the election is almost over and the Santa Clause rally is just around the corner. Know that some of the biggest drops in the market happens during times when the market is running the stops. It is a natural tendency to take big positions which things look great, but that is not how you do it… Take calculated position sizes knowing indexes could fall another 2-3% before putting in a real washout bottom.
http://www.thegoldandoilguy.com/wp-content/uploads/2014/11/tgaoglogo.png00adminhttp://www.thegoldandoilguy.com/wp-content/uploads/2014/11/tgaoglogo.pngadmin2012-11-01 07:28:472014-03-04 12:44:04AAPL Looks Ready Bounce & the Next Best Trade Ideas