
The New Bull Market of 2017!
I cannot stress strongly enough the importance of understanding where the markets are currently technically located, with regards to different time frames and which help to guide all my trading and investing decisions.
The longer that the SPX is inside a ‘consolidation pattern’ and going sideways, the bigger the ‘Break Out’. There is a very strong bullish posture on all time frames within the markets. A unique ‘Sentiment Indicator’ has now been reset from being overbought to oversold, therefore, there is huge potential to the upside. Momentum has been reset! In my market article review, from last February 28th, 2017, I discussed that the “Stealth ‘Bull Market’ In Stocks Is Still In Progress!”.
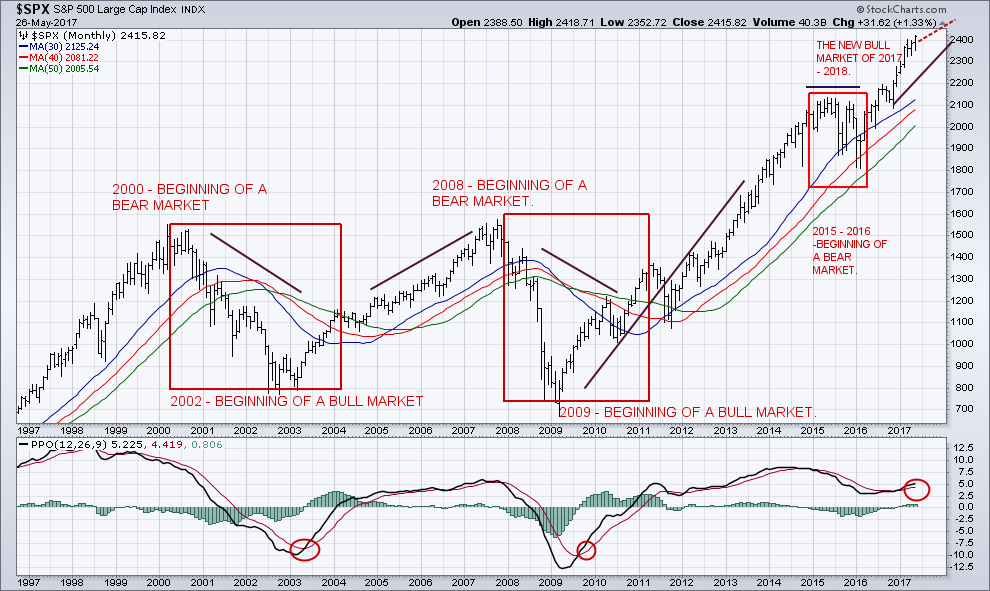
Additionally, I also wrote about how “Elliott’s theory is based on the Dow theory in that stock prices move in waves. Because of the “fractal” nature of markets, I have broken them down so that you can trade a daily complete wave count”.
The below chart was originally posted in April of 2017 with the potential price paths for the SPX to reach the next price target of 2500. The overall forecast points to higher prices this summer with the potential of a major top forming in late July or August.
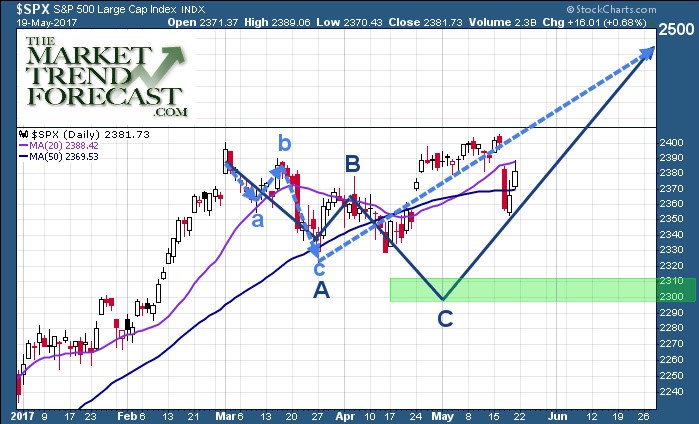
Courtesy of TMTF website.
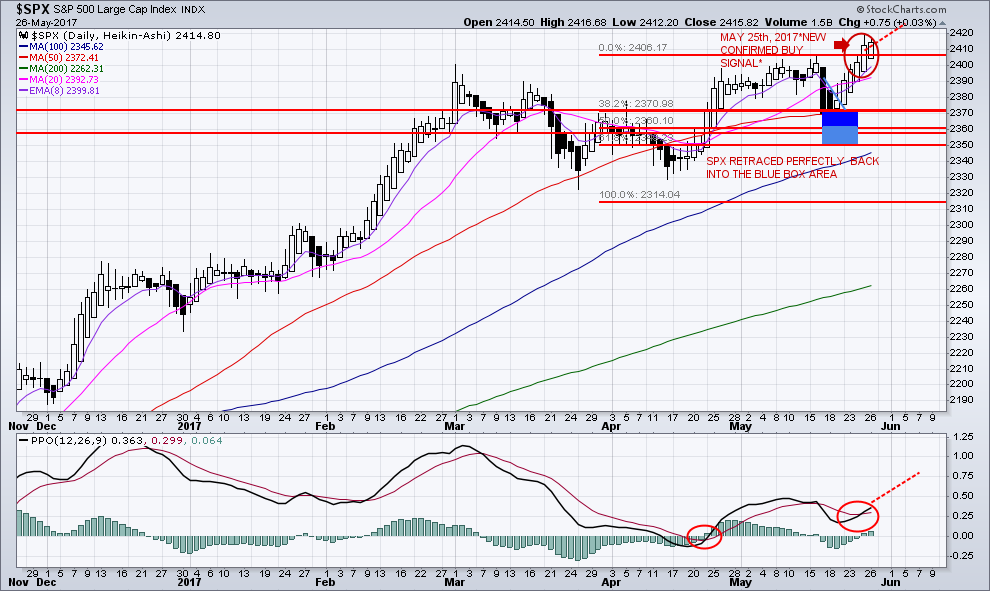
A close above 2424, of the SPX, would trigger a NEW ENTRY POINT, as well as indicating the continuation to the SPX 2500 level. The next potential target is 2430.
Have The Markets Changed?
The “FAANGS” describe five major stocks in the index: Facebook, Apple, Amazon, Netflix, and Google. The “FAANGS” could create a huge ‘Melt Up’ in our current stock market environment! The “FAANGS” and other large technology stocks will send the SPX much higher.
The U.S.-listed ETFs had inflows of $7.8 billion during the week ending Thursday, May 25th, 2017. The year-to-date inflows are $188.6 billion.
These five stocks (FAANGS) represent 9.25% of the SPX index. They also represent 31.45% of the NDX – 100.
Stocks Have a Long Way To Go!
The Bank of Japan (BOJ) and the European Central Bank (ECB) are sending the SPX to even newer highs. Easy money policies, and provide cash to invest into the markets, while adding more liquidity.
Therefore, we are in a “risk on” environment. This is fueling the ‘market bubble’ and will continue for some time yet. The markets have been resilient as traders “buy the dips”!
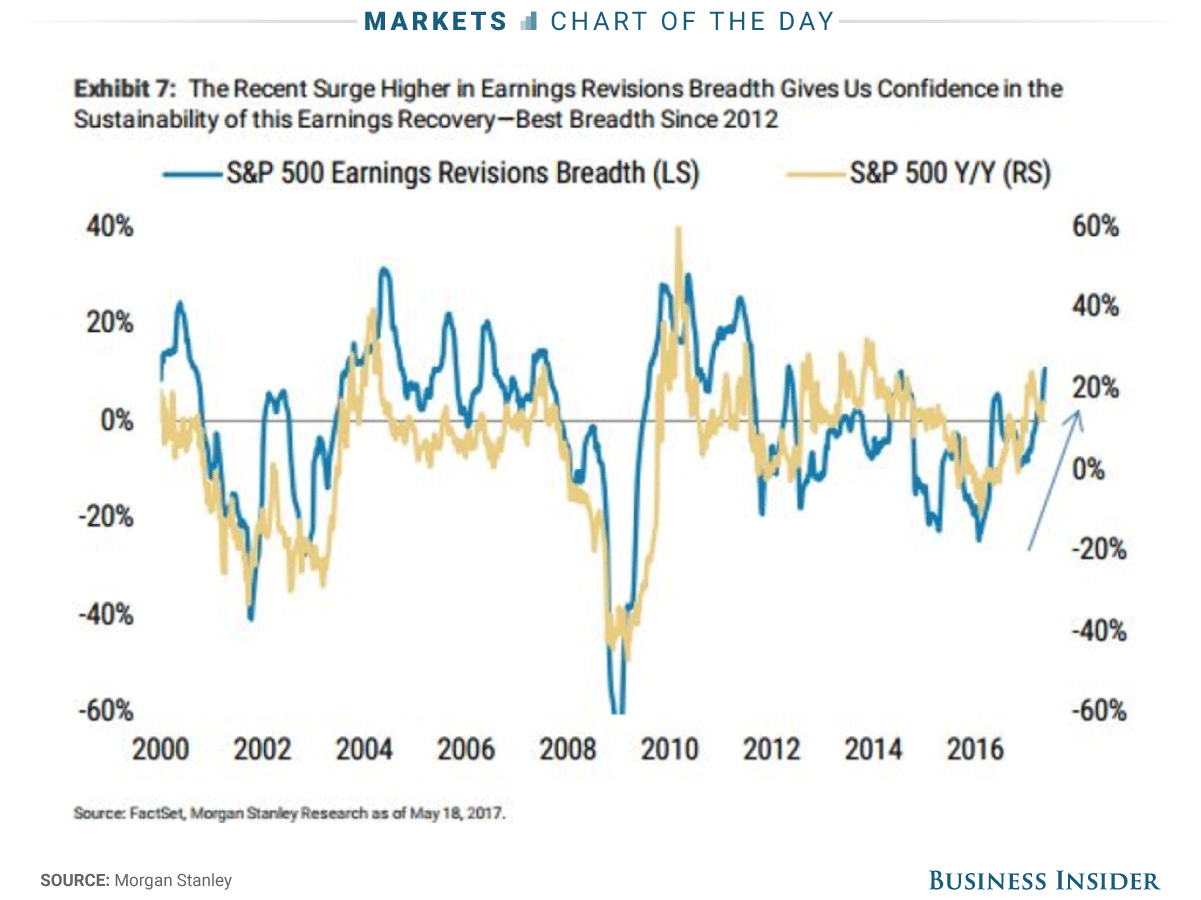
Analysts at Morgan Stanley believe that “profit expansion within the S&P 500 is growing at its best rate in nearly six years. Specifically, ratio of companies raising internal earnings estimates versus those lowering future earnings expectations is reaching its highest level since 2012”.
Michael J. Wilson, Morgan Stanley Equity Strategist, wrote in a client note, “The momentum of earnings revisions breadth like that seen recently is often synonymous with higher equity prices over a 12-month horizon.”
Intermarket Analysis:
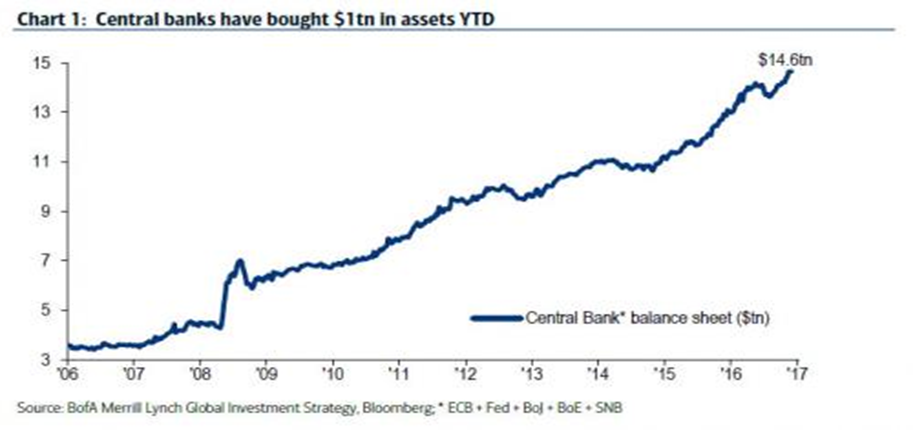
Global Central Banks have injected a record $1 trillion in 2017… they will be required to continue to inject more as the year progresses.
The current focus is on the fundamental key drivers that move the market. The current drivers are Trumponomics, the FED rate hikes, Quantitative Easing and ZIRP.
‘Correlation’ is when you look at one market and it can forecast another markets’ behavior. For example, if the USD turns higher, it is likely that commodity prices will soon begin to fall. If commodities do not drop right away, they have diverged from their natural relationship and we can expect them to start to fall soon.
Correlations offer useful information for traders. Linear correlation analysis presupposes the effects which are linear in nature in a one-to-one causal relationship. The correlation of any two markets can range between +1.0 (the price behavior of the two markets is the same) and -1.0 (the price behavior of the two markets is exactly the opposite of one another).
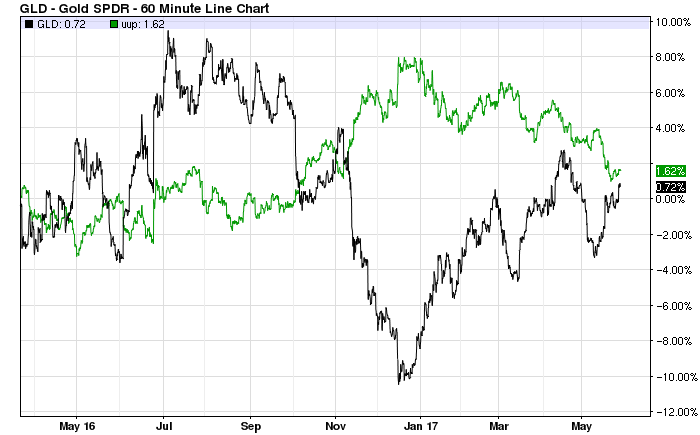
The historical correlation between GLD and the U.S. dollar has been -0.59.
IS GOLD DUE FOR A BREAKOUT?
Gold is the ultimate hedge for setbacks in the Trump agenda. If the administration fails to get its’ agenda enacted, gold prices will likely move higher.
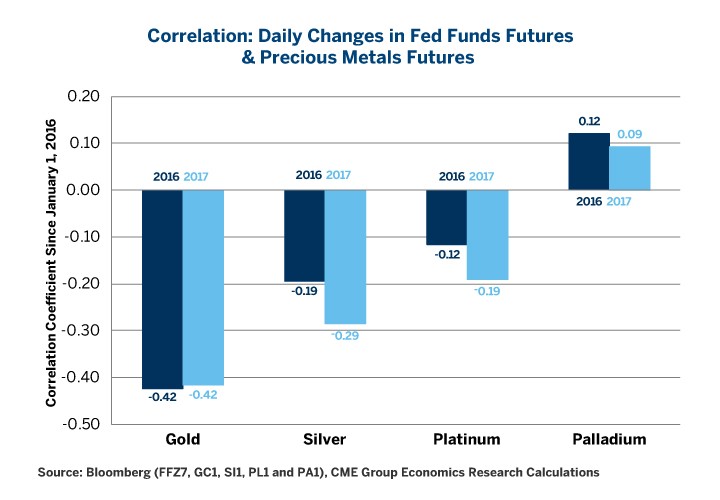
Gold is the most (negatively) sensitive precious metal to react to changes in the Federal Funds Futures.
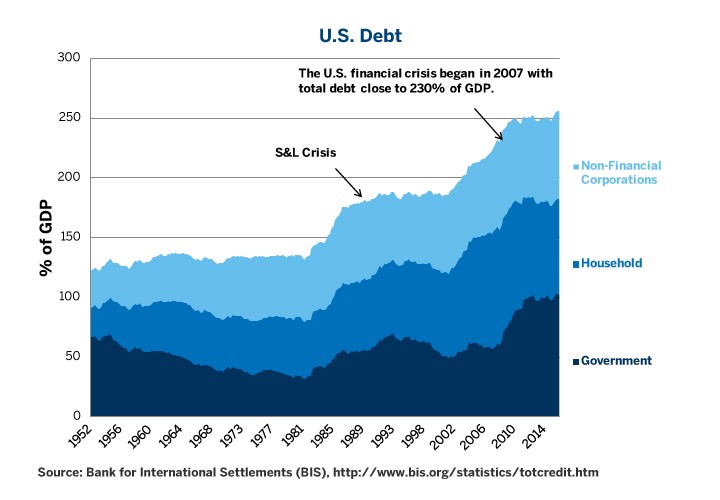
The FED cannot raise rates, aggressively, without harming the U.S. economy: U.S. debt levels remain ‘astronomically high’. There has been no deleveraging since the Great Financial Crisis of 2007/ 2008.
Total U.S. debt remains above 250% of GDP. This explains, better than any other factor, why the Federal Funds target rate is still below 1%.
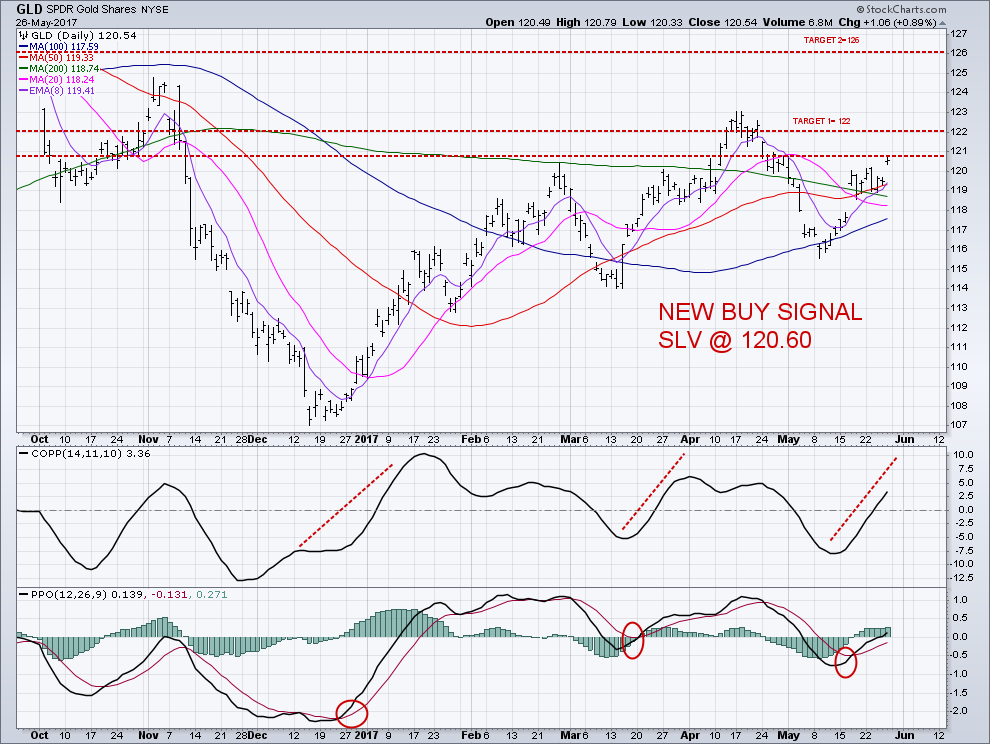
GLD broke through an important resistance level and remains above all key moving averages. GLD out-performed other safe havens last week.
A close above GLD 120.60 would indicate a great swing trade to GLD 122 and then GLD 126. This would also reflect the continuation of the bearish move on the U.S. dollar to the 94 and 95 levels.
In Conclusion:
Tune in every morning for my video analysis and market forecasts at TheGoldAndOilGuy.com to now where the main ‘asset classes’ are headed tomorrow, this week, and next month.
Short-term aggressive traders may want to look at our premium newsletter ATP where we alert our clients to weekly opportunities and attempt to keep our members aware of new trade setups using our proprietary Momentum Reversal Method trading system.
TRADES IN MAY:
ERY 4.75%, in 2 Days
SLV 3.2%, in 6 Days
MOBL 15%, in 7 Days
FOLD 9.5% in 40 Days
If you want to take FULL Advantage of All Our insight and expertise tune in every morning for BOTH our daily market forecasts video and our Stock & ETF Trade Alerts services now!
This week will be most interesting in the markets. It is vital that you understand what the markets are telling you. Attempting to trade stocks, bonds, commodities, and the currency markets, without intermarket awareness, can be very costly.
Chris Vermeulen
TheTechnicalTraders.com

