
How to Spot Short Term Market Tops & Bottoms with Ease

Yesterday the US stock market posted massive gains with indexes closing up 2-3%. We don’t see that very often. This type of price action is what causes most traders and investors to become bullish at the wrong time
I could write a book on the characteristics of a bear market but the important point for today is to know that some of the strongest rallies is stocks happen during bear markets. It’s just the way the market moves because of fear, greed, and short covering.
When traders and investors see these massive price gains the think the bull market is back and price will continue higher. While they may be correct for some time, the overall longer market trend clearly remains down and price will weaken and drop over time.
Take a look at the chart below because they paint a simple picture of short term market trend and timing of minor market tops and bottoms.
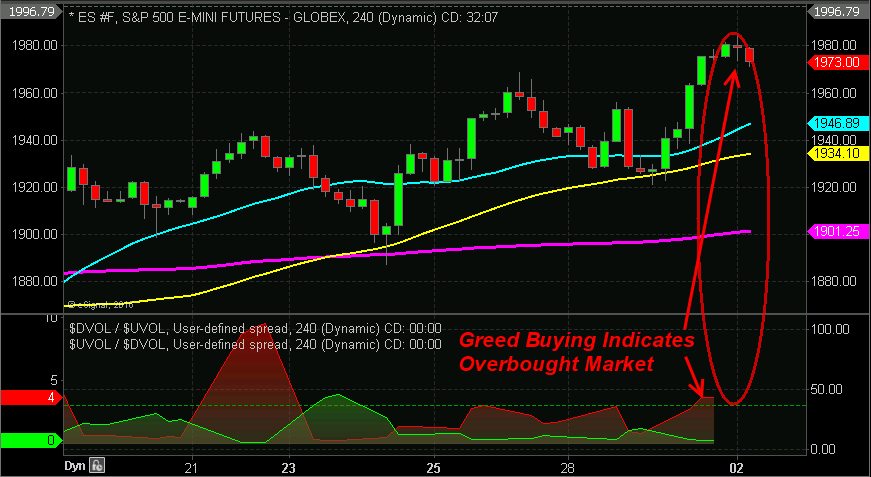
SP500 Futures 240 Minute Chart (4 hour bar chart)
This chart shows the overall trend is up by looking at the moving averages. And more importantly the bottom custom RED indicator line which moves above the dotted line threshold.
I use tells us when market participants are becoming greedy and buying at high price s because they fear they will miss more of a price rise. This is blatant greed and it typically signals a top is very close.
On the contrary, the GREEN line indicates fear/panic among traders and that they are dumping shares because they fear price is going to continue to drop.
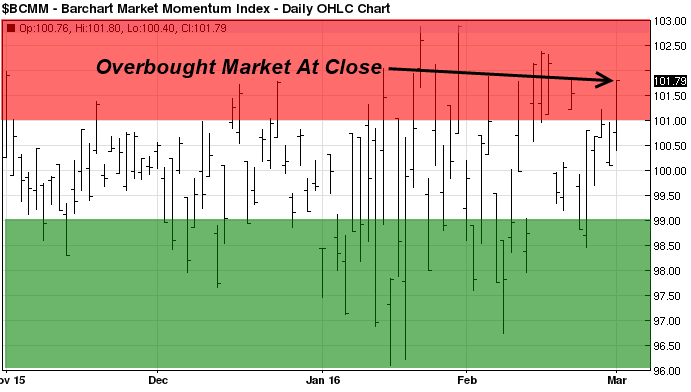
Now let’s take a look at the Barchart.com market momentum index.
This is a simple free online chart I follow closely so I know if I should be looking to get long, short or just avoid day trades or momentum trades. I like to only take positions during extreme levels because it typically means price will have a strong reversal and trend vs a slower, choppy and more unpredictable movement.
This indicator is simple yet highly effective. If the price is over 101 then the market is overbought and we should see price pullback the same day or the next session. When its is below 99 then the market is oversold and a bounce or bottom is likely.
It is important to understand that if the trend is up with the broad market, then you should be looking buy into the oversold dips and be taking partial profits during overbought times. And Vice-versa in a down trend. See this momentum index chart live here.
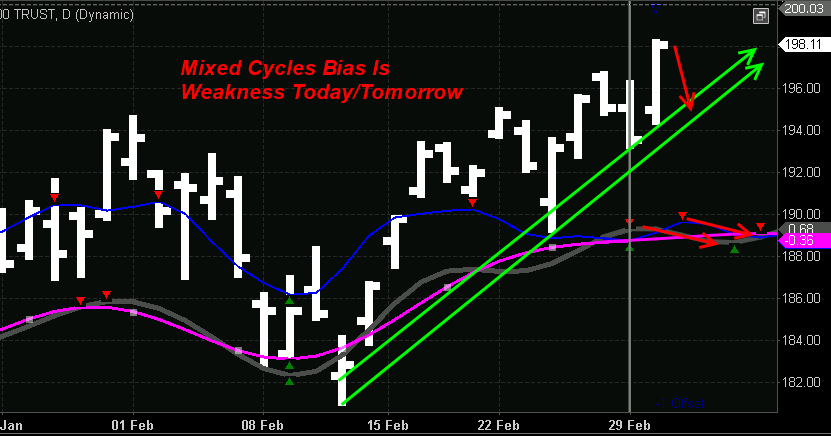
My Cycle Analysis and Trend Forecast
It’s tough to see the dark blue cycle line and the dark grey line point to a pullback for a couple days. A pullback to first support level is highly likely.
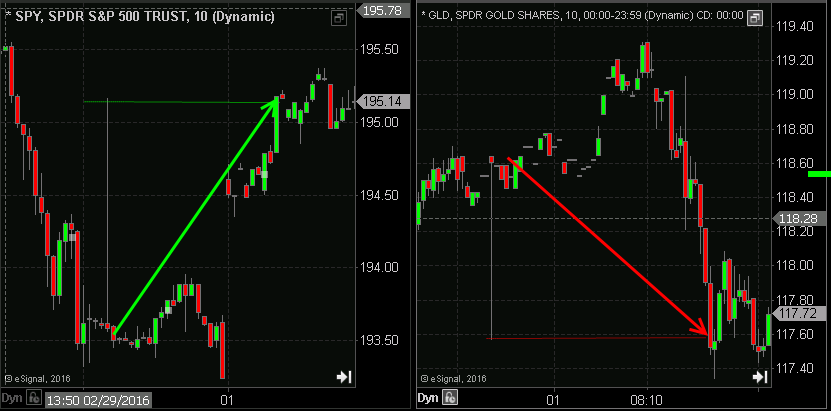
Price Spikes Provide Steady Stream of Intraday/Momentum Trades
Yesterday March 1st was a great day for day traders and momentum traders who followed my price spike trade setups in the SPY and GLD. Both of these setups played out and reached their targets in the first day.
Market Forecast Tips and Analysis Conclusion:
Hopefully, this short article helps shed some light on how to identify market tops and bottoms. Trading is not rocket science but it does take extreme discipline, patients and practice.
Get My Daily Analysis at: http://www.thegoldandoilguy.com/etf-trading-newsletter/
Chris Vermeulen

