Fibonacci Support May Signal Bounce in Oil & Equities
We want to take a moment to point out that a Fibonacci 100% price move setup may prompt an upside price swing over the next few days and weeks. Many traders fail to identify this setup and get caught up in the current price trend. This happens because we lose focus on the fact that price always moves in segments or legs – from one peak or trough to another peak or trough. The process of creating these segments or legs is usually structured in these types of Fibonacci price increment, and Fib targets I have personally found to be the most accurate for spotting profit taking and turning points.
We provide two very clear examples of this type of setup and how it has worked in the past. We urge all traders to understand there are many examples of larger Fibonacci price expansion legs throughout history. These examples of the 100% Fibonacci price leg are unique instances of price movement and, after confirmation of a base/reversal, can become very valid trading signals.
This first example is the ES (E-Mini S&P Futures). You can see from this chart the earlier examples of the 100% Fibonacci price legs working in the October 2018 downward price move. The current downward price legs have set up a perfect 100% Fibonacci price expansion leg and we believe support may form near $2732.
We would normally wait for some type of price confirmation that this level is going to act as support – for example, a solid reversal bar or Japanese Candlestick price pattern. After confirmation is achieved, a price rotation equal to 60% to 95% of the last downward price leg can be expected.
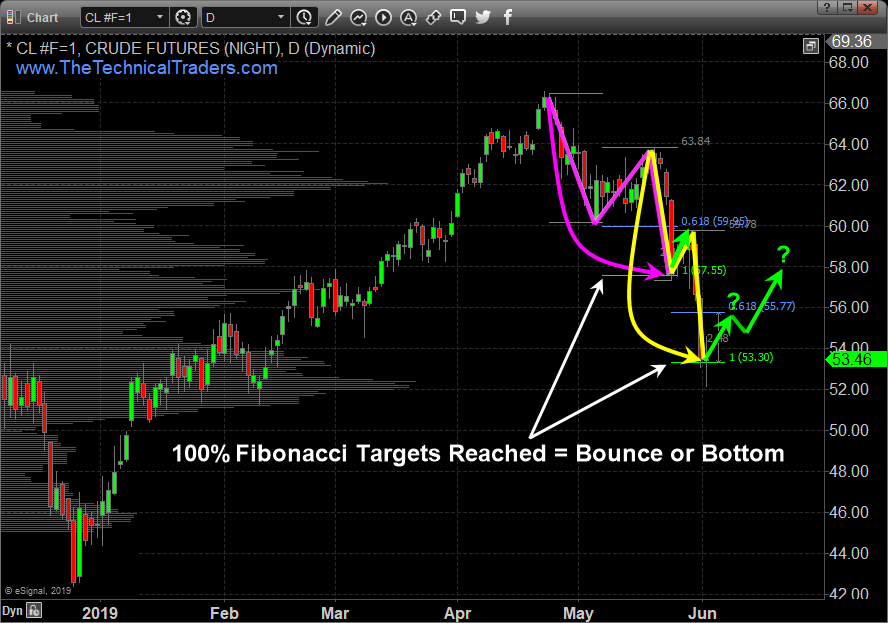
This next example shows Crude Oil and the most recent downward two Fibonacci Price Legs. The first resulted in a very quick upside price rotation (highlighted by the green arrow near May 20). The second downside Fibonacci Price Leg just ended near $53.30.
It is our belief that Oil will find support near this $53.30 level and rally back above $56 from these lows. The only thing we are waiting for is some type of technical price confirmation of this bottom setup and we can expect a 4% to 8% upside price swing in Crude Oil.
Over the past 21+ months, we’ve highlighted some of the best tools and techniques we use to find great trading signals. This one technique, the Fibonacci 100% Price Expansion Leg, is just one of the tools we use to find trades and targets for our trade alerts for members.
The more one understands how price works and how the markets operate as a Symphony of price actions, one can find opportunities for great trades almost all the time. Skill and experience make the difference when deciding when to trade and what to trade and that’s what we provide.
More eye opening charts on currencies and gold here
We’ve now shown you two different price setups using Fibonacci price theory and the only thing we have to do is wait for a technical price confirmation before finding our entry trade. We’ll see how this plays out over the next few days and weeks. Remember, we are not proposing these as “major price bottoms”. They are “upside pullback trades” (bounces) at this point. A bullish price pullback in a downtrend.
https://thegoldandoilguy.com/wp-content/uploads/2019/06/6.png623888adminhttp://www.thegoldandoilguy.com/wp-content/uploads/2014/11/tgaoglogo.pngadmin2019-06-03 20:42:582019-06-03 20:47:25Fibonacci Support May Signal Bounce in Oil & Equities