Fibonacci Price Amplitude Arcs Predict Big Gold Breakout
Precious metals have become the focus of many researchers and traders recently. Bank of America recently raised its target to $3000 for gold (source: https://www.bloomberg.com). In December 2019, we published a research article suggesting precious metals were setting up a long-term pattern that should result in a big breakout to the upside for gold. Every trader must understand the consequences and market dynamics that may take place if Gold rallies above $2500 over the next few months.
An upside price breakout in precious metals that has been predicted by our researcher and dozens of other analysts suggests broad market concern related to future economic growth and global debt. There is no other way to interpret the recent upside price move in Gold. Back in 2015, Gold was trading near $1060 per ounce. Currently, the price of gold has risen by nearly 64% and is trading near $1740. If gold breaks higher on a big upside move (possibly to levels above $2100 initially), this would complete a 100% upside price move from 2015 lows and would set up an incredible opportunity for further upside price legs/advancements.
Before we continue, be sure to opt-in to our free market trend signals
before closing this page, so you don’t miss our next special report!
DAILY GOLD CHART
FIB ARCS & TESLA PRICE AMPLITUDE ARCS
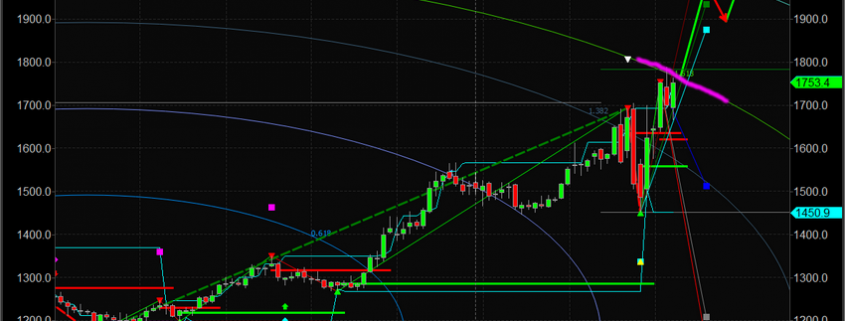
This Daily Gold chart highlights our proprietary Fibonacci/Tesla Price Amplitude Arcs and our Adaptive Fibonacci Price Modeling system. Although the chart may be a bit complicated to understand, pay attention to the GREEN ARC with the MAGENTA HIGHLIGHT near current price levels. This is a key price resistance arc that is about to be broken/breached. Once this level is breached with a new upside price advance, the $2100 price level becomes the immediate upside price target.
These Fibonacci Price Amplitude Arcs have become a very valuable tool for our researchers. They act as price resistance/support bubbles/arcs. When they align with price activity as price advances or declines, they provide very clear future price targets and levels where the price will run into resistance/support. Currently, the Price Amplitude Arc is suggesting that once Gold rallies above $1775, the next leg higher should target the $2000 price level, then briefly stall before rallying to levels above $2100.

WEEKLY GOLD CHART
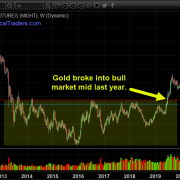
This Weekly Gold chart highlighting the longer-term price picture paints a very clear picture for Gold traders. Once $1775 has been reached and the Magenta level has been broken, Gold should rally very quickly to levels above $2000, then target levels above $2100 within a few more weeks.

CONCLUDING THOUGHTS
Our researchers believe Gold will eventually target $3750 from research that was completed in 2019. We suggest taking a moment to read our “Crazy Ivan” research post from early August 2019. It is critical to understand how the price setup originated near August 2019 and how it has matured recently.
It doesn’t matter what type of trader or investor you are – the move in Gold and the major global markets over the next 12+ months is going to be incredible. Gold rallying to $2100, $3000 or higher means the US and global markets will continue to stay under some degree of pricing pressure throughout the next 12 to 24 months. This means there are inherent risks in the markets that many traders are simply ignoring.
I keep pounding my fists on the table hoping people can see what I am trying to warn them about, which is the next major market crash, much worse than what we saw in March. See this article and video for a super easy to understand the scenario that is playing out as we speak.
If you want to learn more about the Super-Cycles and Generational Cycles that are taking place in the markets right now, please take a minute to review our Change Your Thinking – Change Your Future book detailing our research into these super-cycles. It is almost impossible to believe that our researchers called this move back in March 2019 in our book and reports.
As a technical analyst and trader since 1997, I have been through a few bull/bear market cycles in stocks and commodities. I believe I have a good pulse on the market and timing key turning points for investing and short-term swing traders. 2020 is going to be an incredible year for skilled traders. Don’t miss all the incredible moves and trade setups.
Subscribers of my ETF trading newsletter had our trading accounts close at a new high watermark. We not only exited the equities market as it started to roll over in February, but we profited from the sell-off in a very controlled way with TLT bonds for a 20% gain. This week we closed out SPY ETF trade taking advantage of this bounce and entered a new trade with our account is at another all-time high value.
I hope you found this informative, and if you would like to get a pre-market video every day before the opening bell, along with my trade alerts. These simple to follow ETF swing trades have our trading accounts sitting at new high water marks yet again this week, not many traders can say that this year. Visit my Active ETF Trading Newsletter.
We all have trading accounts, and while our trading accounts are important, what is even more important are our long-term investment and retirement accounts. Why? Because they are, in most cases, our largest store of wealth other than our homes, and if they are not protected during a time like this, you could lose 25-50% or more of your entire net worth. The good news is we can preserve and even grow our long term capital when things get ugly like they are now and ill show you how and one of the best trades is one your financial advisor will never let you do because they do not make money from the trade/position.
If you have any type of retirement account and are looking for signals when to own equities, bonds, or cash, be sure to become a member of my Long-Term Investing Signals which we issued a new signal for subscribers.
Ride my coattails as I navigate these financial markets and build wealth while others lose nearly everything they own during the next financial crisis.
Chris Vermeulen
Chief Market Strategies
Founder of Technical Traders Ltd.

