Watch Chris Vermeulen run through the markets in pre-market trading live and how he applies technical analysis to spot new trades, trends and market sentiment…
Learn More About Chris’ Technical Analysis Strategy

Watch Chris Vermeulen run through the markets in pre-market trading live and how he applies technical analysis to spot new trades, trends and market sentiment…
Learn More About Chris’ Technical Analysis Strategy
Chris Vermeulen
Many investors and traders make the same mistakes assuming that one needs a complex trading system to consistently profit from the stock market. On the contrary, some of the top performing strategies are the ones with the least amount of moving parts and are simple. Because their simplicity they can be easily and consistently followed.
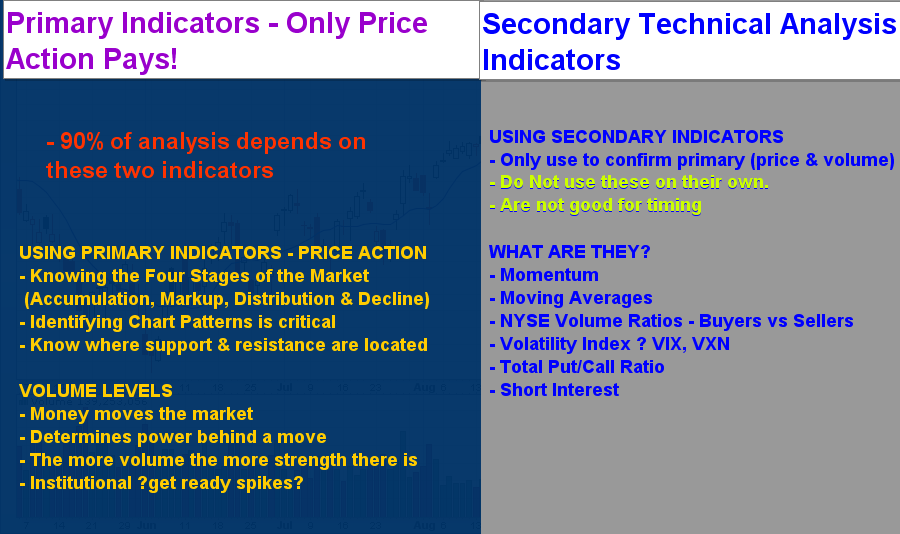
The methodologies we use for timing the market, picking stocks and option trades are very simple because we focus mainly on price, volume and momentum. These three indicators are the key to success. When these are used together you are able time your entries and exits during key turning points, clearly define risk and reward levels while maintaining a clear unbiased state of mind which allows one to trade almost emotionless.
As my Trading System Mastery coach (Brian McAboy) taught me, if you do not have a detailed trading plan which a five year old could trade, then you do not have a solid strategy and will have unnecessary losses and emotional stress.
So here are a couple tips to keep things simple and emotionless:
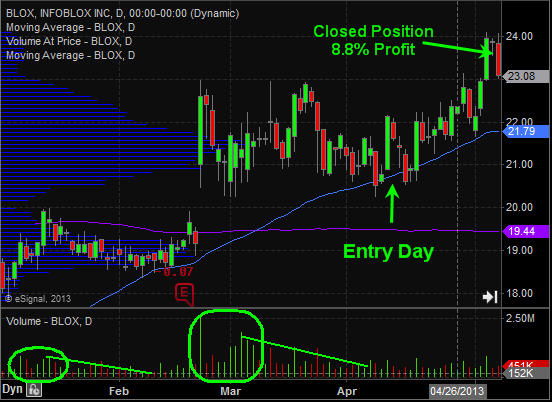
Our recent trade in Infoblox Inc. (BLOX) with our ActiveTradingPartners Newsletter:
This stock was flashing several signals (price, volume and momentum) that a bounce or rally was likely going to happen within a few weeks. This is a good example of a swing trade based purely on our main indicators.
Our Broad Market Outlook:
Current stock market prices are starting to warn us that a market correction is near. You can read more about this in detail in our last report “Stocks Preparing for a Pullback, Buy Bas News, Sell the Good”.
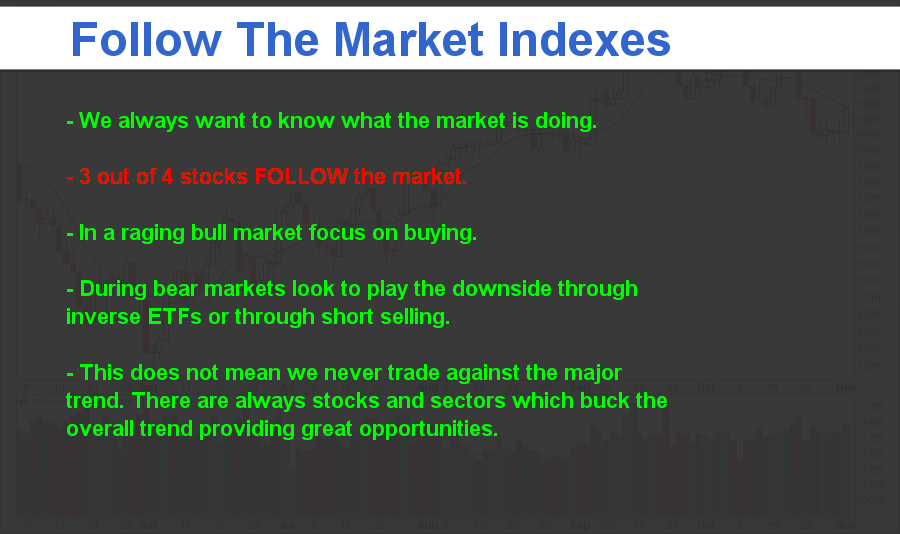
We all know the market works with the saying:
“If the market doesn’t shake you out, it will wait you out”.
How does this work? Simple really, during down trends and just before a market bottom we tend to see capitulation spikes in selling. These scare the last of the long positions out of the market and suck in the greedy shorts after the move has already been made.
During an uptrend which is what we are in now the market makes spike highs designed to scare out the shorts and get greedy long traders to buy more. Once again after the move has already been made and likely near the market top.
If you are the type of trader who always tries to pick tops and bottoms against the current trend then you may like to know this little tip… The largest percent moves typically happen during the last 75% of the trend. What does this mean? It means when you take your position against the trend trying to pick the dead top or bottom you are most likely going to get be caught on the wrong side of the market in a big way.
Most traders I know based on recent emails have been short the market for 1-3 weeks and many keep emailing me that they are adding more shorts each day because they feel the market is going to top. So me being a contrarian by nature in terms of what the masses are doing, if everyone is still holding on to their shorts we likely have not seen the top just yet. Another 1-2% jump from here should be enough to shake them out though…
If you like this article join my free newsletter to receive more timely trading insight at: www.TheGoldAndOilGuy.com
Chris Vermeulen
I have put together a very detailed video this morning coving bother some long term, short term and market cycles. The video is a little longer than normal but I want you to understand fully where the market is trading and what to look for in the coming days.
Pre-Market Analysis Points:
– Dollar is trading higher this morning which is putting pressure on stocks & commodities.
– Fed Chairman Bernanke Testifies at 10am ET which will cause all investments to move wild.
– Oil is trading slightly lower and oil inventory numbers come out at 10:30am ET.
– Natural gas is flat and continues to build a base at resistance for a possible future breakout.
– Gold, Sold Miners and Silver continue to consolidate within a multi month pattern. A major move is brewing but has not been triggered as of yet.
– Bonds are trading up from yesterday’s close after pulling back from reaching our double top price target on Monday.
– SP500 is nearing a couple resistance levels (previous pivot high, down trend line) Momentum, short term and intermediate cycles are starting to top and that means we should be prepared for a pullback/down trend which could last 4-6 weeks.
Watch Video For Clarity
Chris Vermeulen
Good Morning,
Looks like today will be an exciting with stocks and commodities jumping in price up 1-3% as the US dollar pulled back in overnight trading. The SP500 is setting up for another short play which is showed in the video.
Yesterday our protective stop was triggered on the SP500 which was set at the previous day’s high. We locked in quick 7% on that position in only 5 trading sessions. You should be in cash at the moment.
Pre-Market Analysis Points:
– Dollar index has pulled back and is now at support. Looks as though it may bounce or rally any day now which means more selling in stocks and commodities.
– Oil is trading at major support on the weekly chart but overall the intraday price and volume action remains bearish at this time.
– Natural gas has bounced the past three sessions and is not trading at resistance. Lower prices are to be expected though Nat Gas is more of a wild card.
– Gold, Gold miners and Silver are moving higher by 1-3% this morning but volume is not behind the move and higher highs and lows have not yet been formed.
– Bonds have pulled back the past few sessions and could bounce or consolidate for a few more days yet. Price is floating in no-man’s land so it’s more of a wild card at this time.
– SP500 just continued to move higher in overnight trading up over 1%. This is going to put stocks in an overbought market condition at the open. Sellers may step in today or tomorrow and force prices back down for a 1-2% drop as talked about in the morning video.

Chris Vermeulen
“You can’t understand what lays ahead if you don’t understand the past”
~ Satellite, Rise Against ~
Members of my service as well as long time readers know that I do a lot of analysis based on the past. I am constantly looking at long-term historical price charts and data. As a trader, I am always looking for an edge.
Obviously the keys to long-term success involve proper position sizing, risk management mechanisms, and ultimately leveraging probability. Professional traders are masters of these tenets. These characteristics are what separate successful traders from average traders over the long haul.
Sometimes through my rigorous analysis I come across price charts and oscillators that help put together a picture that helps shape my view of the marketplace. The past few months have been some of the most difficult market conditions that I have seen in some time.
The “wall of worries” permeates the financial landscape as risk at present seems unprecedented. The list of macroeconomic concerns ranges from the European sovereign debt crisis to escalation of military action in the Middle East.
I could probably write an entire article about the various risks that plague global financial markets at present, but I try to focus on the positive in any situation. Right now remaining optimistic is a daily battle amid the constant barrage of depressed economic data. Instead of focusing on all of the various risks, I focus on finding opportunities where probabilities are favorable based primarily on historical price data, cycle analysis, and tape reading.
Back on April 9th I proffered an article that discussed my expectation that the U.S. Dollar Index would rally while risk assets such as equities and oil prices would collapse. Additionally I commented on my expectations for weakness in gold, silver, and the entire mining complex. I was wrong about the timing of the U.S. Dollar’s advance, but the ultimate price action analysis was correct.
The following quote came from that article, “As shown above, I believe that short term targets to the downside are likely somewhere in the 1,475 – 1,525 price range. I think gold will find a major bottom near these levels and a strong bounce will play out.” (Click here to view the entire article)
When I originally wrote that article referring to a decline in gold prices gold futures were trading around 1,630 an ounce. Price rallied sharply higher after my article went public, but fast forward to today and my concerns appear to be well founded. I am a long-term gold bull and I ultimately believe that new highs will occur in the future. However, gold and gold miner’s may have further to fall before they find major support.
As stated above, my original expectations for the Dollar Index did not happen in the time frame I was anticipating. However, the belief that a rally was forthcoming proved to be accurate as can be seen from the price chart of the U.S. Dollar Index shown below.
U.S. Dollar Index Daily Chart

As can be seen above, the price action is confirming serious strength. The weekly close on Friday saw the Dollar close above a key short-term resistance level. Additionally I would point out the double bottom that has been carved out on the chart above which is also bullish. Should resistance near 80.76 give way to higher prices a test of the recent highs is quite possible.
The technical picture suggests higher prices in the near term for the greenback. From a fundamental viewpoint, recent economic data also suggests that higher prices may await as one the largest weekly debt issuance of 2012 among sovereigns within the Eurozone will transpire next week. If any of the debt auctions go poorly it will reflect negatively on the Euro currency and help push the Dollar higher.
Most of the debt issuance is outside of the 3 year maturity window so the LTRO justification to encumber risk does not apply. Next week we will find out just how serious investors are about accepting default risk on European debt instruments. I would be shocked if the ECB sits idly by, but the sheer amount of capital required to safeguard debt issuance next week is extreme, even for a major central bank.
The Euro currency continues to fall and has broken key resistance around the 1.30 price level on the EUR/USD currency pair. Price is not collapsing as of yet, but we are seeing a slow and steady slog lower for the Euro. This price action serves to boost the Dollar which ultimately places downward pressure on risk assets such as equities and oil. Additionally, it reduces the valuation of gold. The daily chart of gold futures is shown below.
Gold Futures Daily Chart

The recent price action in gold has been quite ugly and price is resting at key support stemming from an intermediate-term descending channel shown above. Should the lower bound break to the downside a sharp move lower could play out.
It is important to remember that gold is coming off a monster multi-year bull run and it only serves to make sense that a nasty pullback that shakes out the bulls would be forthcoming. I continue to believe that strong support and buyers will come back into gold around the 1,450 – 1,550 price range as significant long-term support levels should hold up prices. The key support zone is clearly illustrated in the chart above.
I continue to wait for price to reach that key support level and based on the current proximity those support levels are magnetizing price toward them. When long-term support / resistance levels are near price a test is a common occurrence. The most important question to ask is whether the support zone shown above will hold, or will even lower prices ultimately play out?
Gold and silver both are starting to become oversold on the daily time frame. While the gold bugs have been feeling pain the past few weeks, the gold miners have been taken out back to the woodshed for a good whipping. The miners have been absolutely crushed in 2012 .
My long term analysis revealed something quite extraordinary on the longer term weekly chart of the HUI gold mining index which I believe is critical for readers to watch and monitor. We are nearing valuation levels based on the true strength index that have not been seen since the market crash that took place back in 2008. The weekly chart of the gold bugs index is shown below.
Gold Bugs Index Weekly Chart
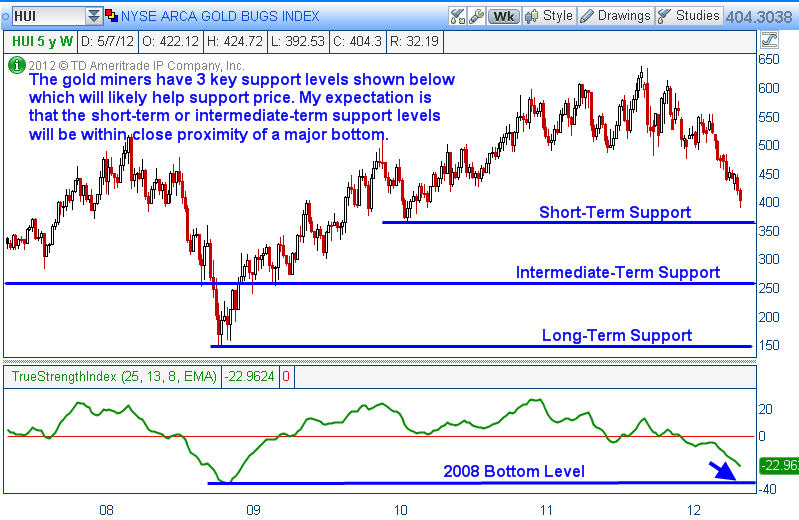
As can be seen above, the Gold Bugs Index (HUI) has been under considerable selling pressure since early September of 2011. However, note how low the True Strength Index is based on 5 years of price data. We are nearing the same level that we saw back in 2008 which marked a major bottom that ultimately resulted in a monster move to the upside for the gold miners.
I am of the opinion that this chart demonstrates quite clearly that a great buying opportunity for gold, silver, and the miners is likely going to present itself in the near future. I will be watching this price relationship over the next few weeks waiting for a strong entry point for a longer-term purchase. After this pullback concludes, the potential returns that could occur in gold, silver, and the miners could be breathtaking.
With 3 clear support levels, a defined risk approach could be used in order to scale in or to reduce market risk should prices continue to move below each support level. While the time is not right just yet, more than likely a solid long-term risk / reward trade may very well present itself in the precious metals and mining space. I am likely a bit early, but the ultimate end game as it relates to fiat currency is documented throughout history. The final result has a finality that few truly comprehend.
If you enjoyed this article and analysis, you can get our detailed trading analysis videos every Sunday, Monday, Wednesday and Thursday here risk free: http://tradersvideoplaybook.com/risk-free-30-day-trial/
Happy Trading and Investing!
JW Jones & Chris Vermeulen
This material should not be considered investment advice. J.W. Jones is not a registered investment advisor. Under no circumstances should any content from this article or the OptionsTradingSignals.com website be used or interpreted as a recommendation to buy or sell any type of security or commodity contract. This material is not a solicitation for a trading approach to financial markets. Any investment decisions must in all cases be made by the reader or by his or her registered investment advisor. This information is for educational purposes only.
Over the weekend I had an interesting conversation with a local trader. We typically meet a few times a year to share our market outlooks, new trading tools and techniques, and usually finish our session off in a debate about the US market manipulation and how to trade around it.
Talking about market manipulation always opens up a can of worms and sparks some interesting theories… And while everyone has their own views and opinion on this subject I thought I would briefly share the main points I pulled from our conversation.
I did talk about the dollar index last week, but the recent price action unfolding today is important so I’m going to recap on it again.
My Weekend Conversation Key Thoughts:
Point form thoughts supporting Lower Equity prices and a Higher Dollar:
– Dollar index looks ready for a major rally (high dollar means lower stocks)
– SP500 may have just formed a double top
– SP500 closed strongly below the 20 day moving average
– First week of May for the past two years have been intermediate market tops
Points supporting Higher Equity prices and a Lower Dollar:
– Countries around the globe are trying to keep their currency value low including the United States.
– Presidential cycle strongly favors higher stocks prices which means the dollar should not rally until Nov.
What do all these points mean? Let’s take a look at the dollar charts below…
4 Hour Dollar Index Chart:
This chart time frame allows us to see all intraday price action while being able to zoom out several months for patterns along with key support and resistance levels.
As you can see over the past few months the dollar has been consolidating sideways. Within this consolidation it has formed two bullish falling wedges with the most recent one breakout last week right on queue.
Using this 24 hour futures dollar index chart we can see where things are trading through the weekend. On Friday the dollar index closed around the 79.50 level. As you can see the dollar has surged Sunday night by more than half a penny breaking through its down trend line.
The next few weeks will continue to be exciting ones as strong moves in the dollar will create wild movements in stocks and commodities.

Long Term Weekly Dollar Index Chart:
If you zoom WAY OUT using the weekly chart this shows you the two major areas where the dollar index is likely to reach come November. Also with these levels are my SP500 price points which are simply numbers I pulled from the charts using basic analysis. I say this because I’m not into long term forecasting but rather shorter term price movements. A lot can change between now and then.
So, if the dollar index rallies to the 86 – 88 level then I would expect the SP500 to be trading back down at the 1000 level. If this takes place, the Fed will likely issue QE3 to jam the dollar back down and boost equities.
The flip side of the coin is that the dollar rolls over here and gets pulled down. This will boost stock prices in favor for the president’s election. After that the dollar would likely rally which in turn would put a major top in the stock market, kick starting a bear market.

The big question…
Do you short the market in anticipation of rising dollar and falling stock prices? OR do you buck the trend and stick with the theory of a lower dollar value and presidential cycle?
The charts above clearly show how we are entering a major tipping point for the market and the next couple months are likely going to provide some big price swings for stocks, commodities and currencies.
If you want to get my thoughts and market ideas each morning before the opening bell be sure to join my video newsletter www.TheGoldAndOilGuy.com
Chris Vermeulen
Investors and traders just can’t seem to catch a break when it comes to economic news. For example Tuesday in the United States we saw strong ISM manufacturing numbers which surprised the market. The numbers were way above expectations and it triggered a feeding frenzy in US based investments like stocks and the green back.
The following session Italy reported terrible PMI and unemployment rate numbers which took most of the wind out the European and US stocks. One day the data is great, next day it’s bad…
The strong numbers in the US have everyone including myself thinking that this week’s jobless claims (unemployment rate) will be down. If this is the case then we will see stocks jump along with the dollar, much like what we saw trader do last Tuesday which is what Jim Cramer says best – BUY BUY BUY.
Normally we do not see the dollar index rally along with stocks but if EU continues to show signs of weakness then it is very likely the dollar and equities inverse relationship could decouple. Reason being investors around the globe will focus their money on the more stable US investments like the dollar and US stocks.
You can learn how to trade economic news with my free Economic Indicator Trading Tool: http://www.thetechnicaltraders.com/economic-indicators.pdf
The Dollar is Trading at a Major Tipping Point – Weekly Chart
The dollar index is something that I watch very closely on a daily basis. Focusing on the weekly and 8 hour charts I look for support and resistance levels along with price patterns.
As you can see from the weekly dollar chart below, a large bull flag has formed. This pattern typically means higher prices and in this case the price target is between the 86 and 88 level.
There are few wild cards to toss into the game on what will unfold next:

Dollar Index 4 Hour Chart
I find the dollar index to be a great trading tool in helping me time short term reversals in the equities market.
Taking a look at the 8 hour chart below you can see recurring bullish falling wedge patterns. The most recent brake out was this week and I anticipate the 79.50+ levels to be reached in the near term. If the dollar does continue to move higher then I expect sideways to lower stock prices for a couple more sessions.
That being said, the mixed economic data between the US and EU is going to cause this scenario to be unpredictable. Depending on the jobless claims this week stocks could actually rally while the dollar moves higher. Unfortunately, this week’s mixed data does not provide any trading opportunities that I feel comfortable making.

Mid-Week Market Conclusion:
In short, I feel a higher dollar is likely to happen. As for stock prices, well they are more of a wild card at this time but my analysis slightly favors higher prices.
To quickly touch on precious metals, they are likely to be under pressure for a few sessions simply because of the rising dollar.
I hope my analysis helps paint a picture of what to expect in the coming days.
Happy Trading,
Chris Vermeulen
www.GoldAndOilGuy.com – ETF Trading Analysis & Alerts
Hey Trader’s!
The next few trading sessions should be interesting with precious metals on the verge of a rally which should get the attention of traders and investors once again. If we can get investors to start looking at gold and silver again instead of high dividend paying stocks we will see gold hit $1800 an silver $37.
The SP500 has been pulling back and looks about ready to bounce going into the afternoon.

I recorded my morning analysis explaining what to expect in the market this week and the key support and resistance levels.
Chris Vermeulen
By: Chris Vermeulen – www.GoldAndOilGuy.com
The past two months we have seen all the focus from traders and investors be on the equities market. And rightly so and stocks run higher and higher. But there are two commodities that look ready to explode being gold and oil (actually three if you count silver).
Below are the charts of gold futures and crude oil 4 hour charts. Each candle stick is 4 hours allows us to look back 1-2 months while still being able to see all the intraday price action (pivot highs, pivot lows, strong volume spikes and if they were buyers or sellers…).
The 4 hour chart is one time frame most traders overlook but from my experience I find it to be the best one for spotting day trades, momentum trades and swing trades which pack a powerful yes quick punch.
As you can see below with the annotated charts both gold and silver are setting up for higher prices in the next 1-2 weeks from a technical point of view. That being said we may see a couple days of weakness first before they start moving up again.
4 Hour Momentum Charts of Gold & Oil:

By: Chris Vermeulen – www.GoldAndOilGuy.com