The US Federal Reserve is one of the only central banks to attempt to raise rates consistently over the past few years, has possibly learned a very valuable lesson – no good comes from raising rates to the point of causing another market collapse. The news that the US Fed will leave interest rates where they are, temporarily, is good news for a number of reasons.
First, this allows the markets to shake out weaker players and weaker components of the corporate world. Where corporate debt levels are concerned, interest rates are tied to debt repayment liabilities and refinancing costs. Firms that are unable to manage at current interest rates certainly would not be happy about rising rates. This allows these corporations to either struggle to resolve their debt issues or collapse under the weight of their own debt. This will also play out in the foreign markets as well.
Second, it allows the housing market and private debt markets to shake out some of the “at risk” consumers. We authored an article a few months ago about how foreclosures and pre-foreclosures were starting to increase in nearly all markets. At the time, many people in the real estate field shrugged off these increases as par for the course. With the decreasing foreign investment in real estate and the increasing pressures on the local consumer markets, we saw a dramatic slowdown in housing starts and sales activities recently. This is because the demand side of the market is falling much faster than the supply capacity.
The uncertainty in the foreign markets, global central banks, and foreign investments have prompted many people to pull out of the local markets – even the hot markets. The at-risk consumers that were trying to sell near this top suddenly found the buyers were just not there or ready to make the commitment. This put the at-risk consumers in a difficult position as they could not flip their houses as easily as they could 6 months ago.
Yet, in the global equity markets, investors can sell or buy with much faster transaction times – at the click of a mouse button in most cases. This allows equity investors to pull capital away from risky investments and migrate that capital into more secure investments in a matter of minutes or hours – not weeks or months. And that is exactly what has been happening over the past 30+ days in the global markets.
Capital is repositioning for the next phase of this market; where the US economy is strong, housing continues to weaken and at-risk consumers continue to feel the pressures of the US Fed interest rate policies. Where foreign consumers attempt to deal with their own version of “central bank hell” and asset devaluations in an attempt to find more secure investment vehicles for their capital. Money market funds, investment funds and, of course, the US value/blue-chip equities are looking very promising right about now.
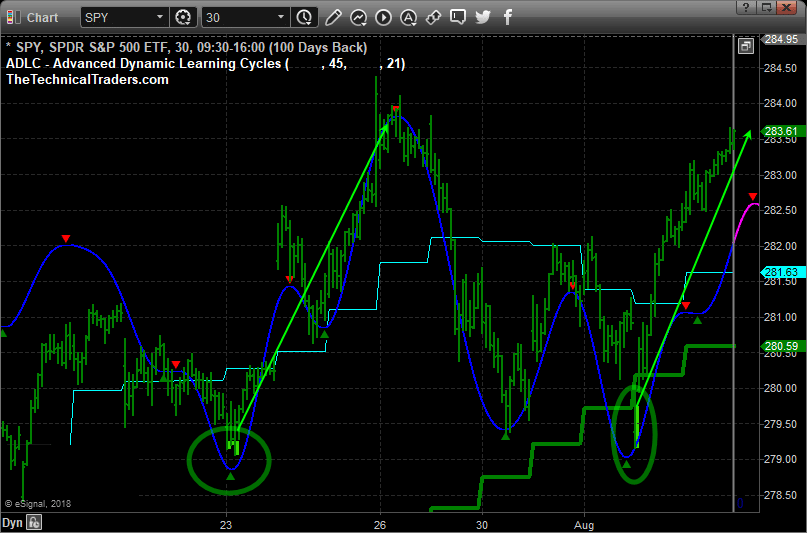
This Daily SPY chart shows our recent ADLC indicator (price cycle turning points) and our oversold extreme price levels shaded with lime green. When these two things align the market tends to rally for 1-3 days with strong momentum. During pre-market last week, we told our followers that the big gap lower in price was going to be bought and price should rally for 2-3 days, which is exactly what has unfolded thus far.
Global capital will continue to rush into the US markets as long as the US Fed does not do anything to derail things. Our research team believes the US Fed may even decrease the interest rates by 0.25% before the end of the year depending on how much pressure is placed on the economy by these “at risk” participants.
We will continue to keep you updated as to our findings and we want to urge you to visit www.TheTechnicalTraders.com/FreeMarketResearch to read all of our most recent research posts. You really owe it to yourself to understand what is happening in the global markets right now and how we have continued to stay 30~60 days ahead of these moves for our valued members. There are so many opportunities setting up in the markets for traders it is almost hard to understand the dynamics at play right now. If you want a dedicated team of researchers and traders to help you navigate these markets, then visit www.TheTechnicalTraders.com to learn how we can provide you with even more detailed daily research and support.
Chris Vermeulen
https://thegoldandoilguy.com/wp-content/uploads/2018/08/spy-cl1.png533807adminhttp://www.thegoldandoilguy.com/wp-content/uploads/2014/11/tgaoglogo.pngadmin2018-08-05 22:02:192018-08-05 22:02:19Technical Analysis and Rates Unchanged – Here We Go
Now is the time for traders to really pay attention to the rotation in the US Stock market as well as the continued price rotation in certain sectors. As we have been warning for the past few months, this really is a stock pickers market. Take a minute to review our past articles highlighting these sector moves and the general market sentiment over the past few weeks: June 24: Could A Big Move In The Global Markets Be Setting Up? & Q2 GDP vs. Technology Concerns vs. Foreign Markets. As traders, we need to understand how capital migrates towards opportunities and safety and how it migrates away from risks and price collapses.
Over the past months, our research team at Technical Trades Ltd.has been pouring over the charts to identify these moves and to keep our subscribers ahead of these trends. The US Dollar and the recent Q2 earnings season reporting have acted like pouring fuel onto a burning fire. BOOM. We highlighted the potential for increased volatility and price rotation weeks ago and we continue to try to identify the best opportunities for our subscribers.
Today, our research has really paid off with moves in sectors that we’ve highlighted and been trading for weeks. Our proprietary price modeling systems have shown us what to expect in the markets going forward many weeks and months. We’ve been calling for the NQ to hover near 7400 while we’ve been expecting the DOW and S&P to continue to rally higher. We’ve been sharing our research that we believe the Transports, Russell and many of the Blue Chips will perform much better than the hot technology sector and other sectors and its starting to happen now.
Capital appears to be migrating out of technology on weakness and expected continued pricing pressures and that capital will be attempting to find new sources of security and growth. Earnings numbers have been generally strong, therefore, we expect this capital to migrate into stronger, dividend producing and transportation based equities. With the 4.1% GDP number, the expectations going into the end of this year should be that the economy may stay hot and these sectors could continue to rally.
This Weekly IWM Chart shows dual Fibonacci extension levels that coincide near $184. These levels show us that the upside potential for this move in the Russell 2000 ETF, which is really only an 8~10% price rally) could accelerate upward throughout the end of this year as the US economy continues to push harder and the migration of capital continues to roll out of the hot technology sector and into more traditional sectors.
We’ve highlighted the projected price point where this targeted level seems to be a key element of our analysis. This level also coincides with key Fibonacci price projection points. It makes sense to us that as capital moves out of technology and other risky sectors, this capital will be seeking a safe and secure investment in stocks that have the opportunity to perform well throughout the end of the year with a strong US economy. Retail, Transportation, the Russell 2000 and more traditional Blue-Chip equities seem to be the renewed targets for this capital.
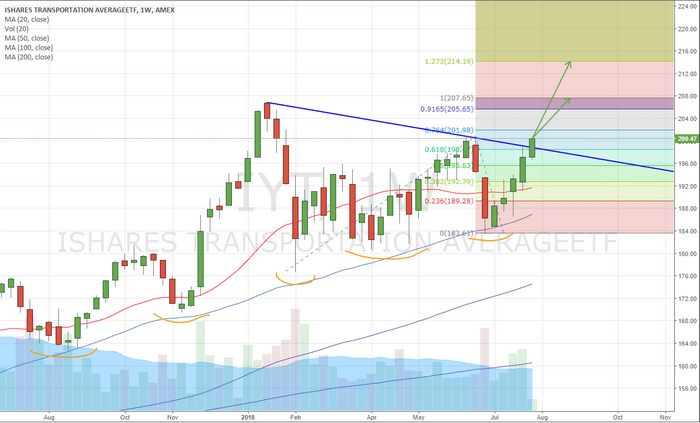
This Weekly chart of the IYT (Transportation ETF) highlights the continued higher low price rotation patterns that have driven continued rallies in price. The last three low price rotations were key to setting up a new Pennant Formation Breakout that has just started. This breakout pattern is key to understanding the upside potential for the Transportation Index. These upside targets are 3.6% & 6.8% higher than current prices. This represents a very solid opportunity for traders over the next 4+ months as we head into the Christmas and Thanks Giving holidays – the Santa Rally.
What was hot over the past 4+ months, may start to flatten out and rotate lower over the next few months as capital migrates into newer opportunities headed into the end of 2018 with a strong US economy. Our opinion is that technology will become a weakening market sector for at least the next 30~60 days as revisions to earning and expectations, as well as continued issues from China and globally, drive a capital re-balancing process across the globe. This migration of capital will move into new, more traditional, equities as a source of security and growth. Capital always attempts to find the best environment for security, growth and limited risks.
For example, we just locked in a 12% profit on the financial sector using FAS, and we feel it is still headed higher, all this happened while technology stocks sold off.
If you want to see what our proprietary modeling tools are saying about the markets and what to expect in the near term future, then visit www.TheTechnicalTraders.com to learn how we can help you find and execute better trades while staying ahead of these market trends and cycles. Our proprietary price modeling tools are second to none and have proven to be extremely accurate over the past 6+ months. Don’t miss the next big moves in the markets. Learn how we can help you find and execute better trades with our specialized research, daily videos, proprietary modeling systems and more. Watch how these markets rotate over the next few weeks to see how accurate our analysis really is.
This past week has been very interesting in the US markets for a couple of reasons. It is time we took a hard look at what to expect going forward and how this news will likely drive future market moves.
First, the Q2 GDP number came in as a huge boost to the US economy and for the future expectations of economic growth in the US. 4.1% GDP for Q2 is massive compared to the previous administrations GDP levels. Granted, these levels may not be sustainable in the long term above 4%, but we can only assume levels above 3% are going to last for a while unless something dramatic changes the economic footing within America.
Secondly, Facebook and Twitter both missed on earnings and growth numbers. These two stocks got crushed in the process. One thing to consider is that Facebook is within a transitional phase with the Federal government and the SEC investigating the company for illegal activity and for illegally allowing external firms to data-mine the user base. These issues have likely resulted in a decrease in the total user base for Facebook and in a general dissatisfaction for existing users. A certain group of people will simply stop using Facebook because they don’t agree with or condone these activities and don’t want to be a part of these issues.
Twitter, on the other hand, has had a rough go of it for years. With a failure to properly monetize the company and users on top of recent concerns that “shadow banning” and “political bias” has infiltrated the SOP (standard operating procedures) of the company’s leadership, it appears Twitter is not being targeted as a “biased social platform” that could result in further headwinds for success.
The end result is that these two stocks don’t make up the entire stock market – they are just relatively large components of a much bigger market of stocks.
As we have been stating for months, the capital migration from foreign sources into the US markets have been a major driving force over the past 24 months. This capital is searching for safe and equitable growth opportunities. We are certain that a large portion of this capital found a home in Facebook and Twitter – as well as other stocks. These investors may be shocked by the recent collapse of FB and TWTR, but we are relatively certain that these investors will likely continue to hold their positions for one reason – the expectations that the US economy is strong and the recovery of these two stocks will likely take place over the next 6 to 12+ months without much issue.
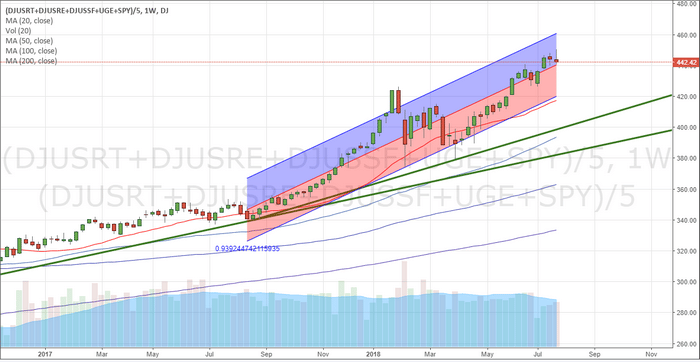
When we take a look at the longer term charts, we can see a fairly clear picture of the recent price rotation (January 2018) and the most recent upswing in prices. This, our Custom US Index Weekly chart, shows exactly what we see in terms of trend and expectations. The Std. Deviation channel is key to understanding future price rotation, if it happens. As long as the lower Std. Dev channel is nor breached, price should find support and rotate higher as expectations continue to drive prices higher and as foreign capital continues to rush into the US markets.
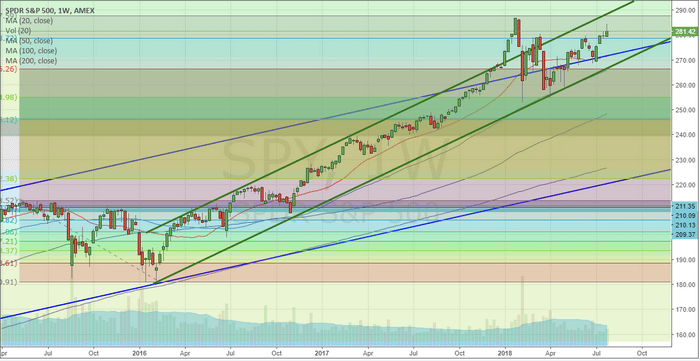
This Weekly SPY chart shows a similar price channel setting up from 2016. Actually, there are two price channels at play. The Blue levels originate from the lows in 2009 and track price trends all the way through 2015~2016. The upper Blue channel is currently creating support for prices moving forward. The Green channels are more recent and originate from 2016. Ideally, as long as price stays above the lower Green price channel, the trend is Bullish and we should expect mild price rotation.
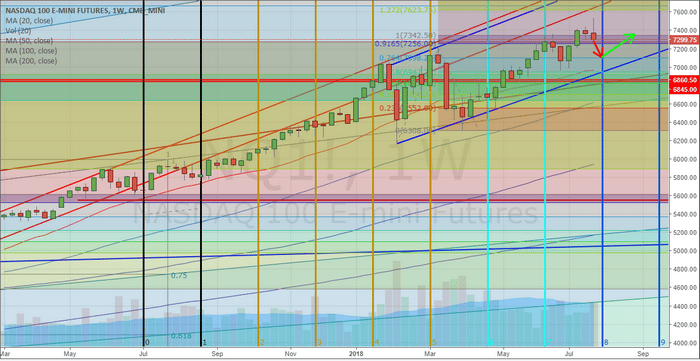
Lastly, this NQ Weekly chart shows a bit more detail including our Time/Price cycles that indicate we should see some moderate price rotation over the next few weeks. We don’t expect this rotation to be deep or excessively volatile, but we do expect some type of narrow price rotation to occur. You can see from the arrows we’ve drawn on the chart that we expect prices to hover below or near 7400 for the next 3~5+ weeks – as we’ve been warning about for the past 30+ days. The NQ will likely become range bound below 7400 for the next few months – possibly throughout the end of 2018.
The price channels shown on this chart, in Blue, are still critical to the longer term trends. Once these channels are broken to the downside, then we would be more concerned of further and deeper downside price pressures. As of right now, nothing is showing us any real concern and the Q2 GDP numbers will act as a booster rocket for the US economy unless something derails over the next 3~6 months.
The short sellers that have been setting up for a massive and deep price correction may see a bit of profits in some stocks that rotate lower, like FB and TWTR, but our analysis is showing these traders are taking a risky position getting setup for a deeper and broader market rotation downward. At this point, with incredible GDP growth, strong earnings, a strong US economy and foreign capital rushing into the US market/stocks – we just don’t see the downside potential that others seem to see.
For months we have been posting our analysis stating the markets would push higher from the February lows. We have stood by our analysis and weathered some criticism over the past few months. Still, the markets continue to push higher and the news just seems to support our predictive modeling systems analysis. Currently, a unique sector rotation is taking place that traders need to be aware of. This will likely not become a broad market rally where everything goes up for weeks of months. This will likely become a select sector rally in the markets based on expectations and opportunities. Last week to locked in 12% profit on the financial sector using FAS, and we feel its still headed higher!
If you want to learn more about our analysis and our opinions regarding what will move and when, then visit www.TheTechnicalTraders.com to learn how we can help you find greater profits in these markets. Our predictive modeling systems have been calling these markets almost perfectly for the past 8+ months. Isn’t it time you invested in your future success and take advantage of the features and benefits we can offer to you?
https://thegoldandoilguy.com/wp-content/uploads/2018/06/howimage.png506900adminhttp://www.thegoldandoilguy.com/wp-content/uploads/2014/11/tgaoglogo.pngadmin2018-07-31 13:42:432018-07-31 13:42:43Q2 GDP vs. Technology Concerns vs. Foreign Markets
Our research team has been watching the foreign currency markets with great interest. Recently, the strength of the US Dollar has put extended pressures on many foreign currencies. The recent crash of the Chinese Yuan has alerted many traders to the concerns that China could be edging over the precipice in terms of debt and credit market collapse.
As traders/investors, we need to understand how these currencies move, and future moves may drive the global equity markets to new highs or lows. Let’s take a brief look at how some of our proprietary indicators are set up on these Weekly charts.
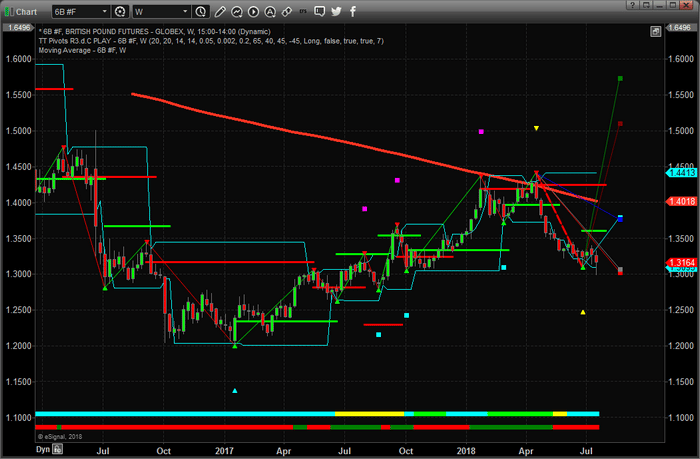
Weekly British Pound chart
This Weekly British Pound chart showing our proprietary Fibonacci Price Modeling system presents a very clear picture that the current trend is Bearish and that price is contracting. The Weekly Fibonacci price modeling system functions as an adaptive price modeling system – allowing the price rotations (peaks and valleys – highlighted by the yellow, cyan, magenta and white markers on the chart) to develop into a concise and efficient current model of price expectations and projections. The multiple price projection levels (the six projected lines to the right of the current price bar) show us where price may attempt to target should a breakout move happen.
Notice that the current British Pound price has reached and stalled near the 1.3100 level – which is exactly where two of our Fibonacci price modeling system has predicted with the Red and Grey projection levels? Also, notice how the Blue and Cyan projected levels are aligning near 1.3775? This would be a proper expected price level should price find some support near the 1.3000 level and attempt a short recovery.
As get further into these charts, please understand the key elements of these charts and what they are attempting to illustrate to all of us. With each pivot high or low, this price modeling system identifies a “trigger price level” that is used to confirm a trend reversal (if it happens) as well as to identify key future support/resistance. These are drawn as Green and Red horizontal lines. You’ll notice a Green trigger price level near the current price bar – this is the “upside price trigger level” that would have to be breached if we were to see any further upside price advance. As long as price stays below this level, we should continue to expect a downside price move with a strong potential for new lows.
Summarizing this charts analysis, the current trend is Bearish. The current bullish trigger level is near 1.3600. Price is trending lower from a previous Bearish price trigger level near 1.4240. Price has reached the two (Red & Grey) projected price levels which means we should expect some price consolidation near these levels before establishing a new price trend (extending lower or rotating higher). Recent, new price bar lows show a very strong potential for further downside price activity. At this point, we see that support from a previous bottom, near 1.3060, will likely cause the price to stall near this level. We believe the price will continue to fall below the 1.3000 eventually as the strength of the US Dollar continues to push higher and the Brexit issues continue. The British Pound could fall well below 1.2500 before finding real support. Wait for this consolidation period to end and watch for lower prices to continue.
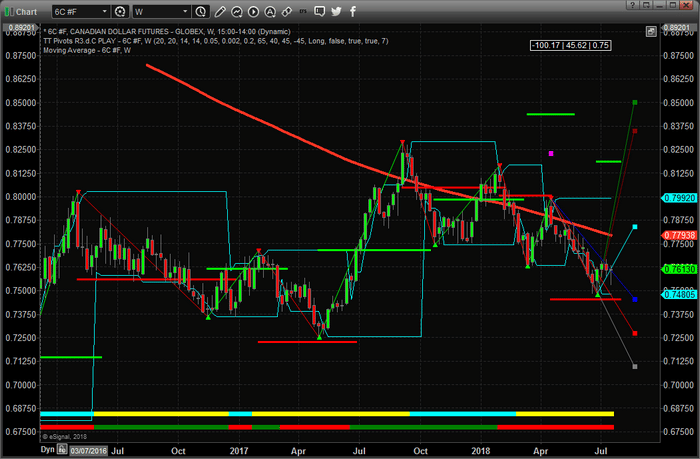
Weekly Canadian Dollar chart
This Weekly Canadian Dollar chart below shows a very interesting setup with our proprietary price modeling system. Notice the wide range between the trigger price levels (Green and Red) near the right edge of this chart? This extended range of the trigger price levels happens when the adaptive price modeling system finds price trend rotation. Previously, on this chart, we can see the trigger price levels were closer to price and within rotational ranges – the most recent breached trigger level being a Red (Bearish) trigger – indicating the start of a new bearish trend near February 5, 2018.
At this point, should price fall below 0.7450, we should expect price to continue to drop towards 0.7250. Upside resistance should be near the Cyan projected price level – near 0.7850. Unless the Canadian Dollar finds support near 0.7500 and rotates higher to breach 0.81875 – this is nothing but extended price rotation. Typically, as price sets up an extended Top or Bottom, the trigger price levels will eventually tighten to establish a breakout trend setup. Right now, the extended ranges of these trigger levels is showing us that volatility and price rotation should be expected and the downward sloping Moving Average level will likely operate as a key resistance zone. The YELLOW markers at the bottom of the chart show us that price range is expanding and volatility is increasing. We could see some bigger swings in the Canadian Dollar over the next few weeks and months – but the trend is still bearish.
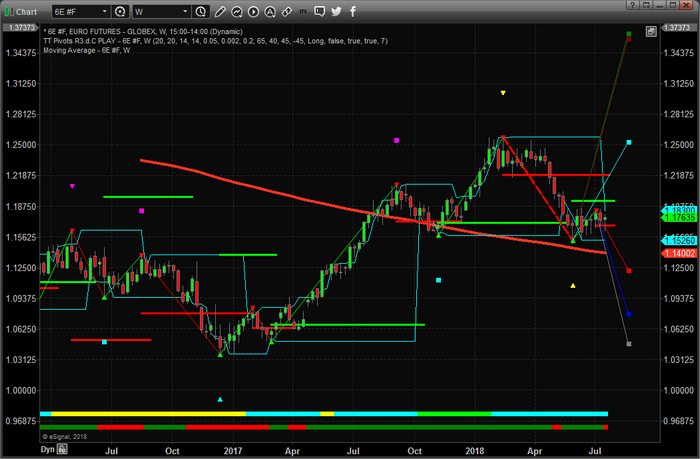
Weekly Euro chart
This Weekly Euro chart shows a more traditional price rotation setup with our Fibonacci price modeling system. Notice how the trigger price levels are very narrow and close to the current price. You’ll also notice the Cyan price trend indicator, near the bottom of the chart, that is indicating that price range is contracting. The two price trigger levels (Red and Green) provide very clear breakout trigger levels (bullish near 1.1913 & bearish near 1.1687). The most recent trigger level to be breached was the Bearish level near 1.2200. A recent low price rotation has established a new low price pivot that is projecting much higher price projection points. Additionally, a more recent high price rotation has established new lower price projection points.
This sideways price rotation will be broken and a new trend will be established in time. At this point, we know the 1.1913 level is the bullish trend trigger point and the 1.1687 level is the bearish trend trigger point. Price trend is still bearish and any lower price breakdown below 1.1576 would be a strong indication that price is breaking below current support and should attempt to move to near 1.1000. To summarize, the Euro appears to be under extended pressure and any price breakdown could be a great short for traders.
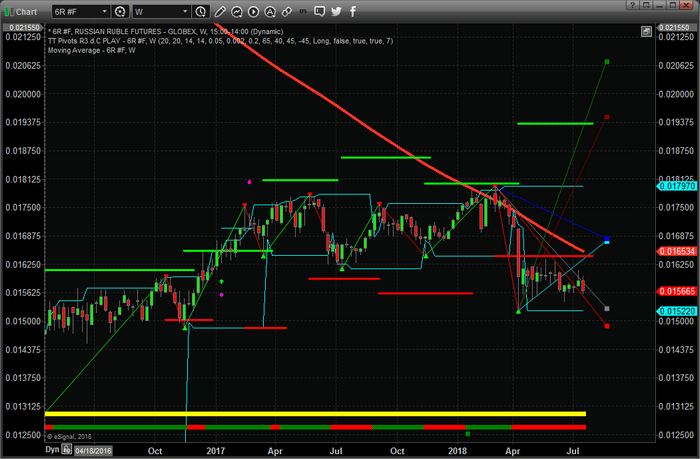
Russian Ruble Weekly chart
Lastly, this Russian Ruble Weekly chart shows, again, price rotation and volatility. Notice how the bullish trigger price levels have been expanding throughout this sideways price rotation for the past year or longer?
As we stated early, the adapting modeling component of our proprietary Fibonacci price modeling system identified this rotation as “extended price congestion” and attempts to identify broader market breakout levels as a means to confirm a true change in price trend. The most recent bearish trigger price level was breached on April 9, 2018. Price is trending lower/bearish and the price trend indicator near the bottom is showing yellow – price volatility is expanding. We should expect further downside price moves with expanded volatility. Any price move below 0.01520 will indicate a very strong downside price move with the potential for price to reach 0.01250.
Concluding Thoughts:
Overall, we need to remember the recent political, economic and geopolitical conundrums are reflecting in expectations within global economies and currencies to be put under greater concerns. What was once a given, that the world would continue to operate without much disruption in the global balance of thing, is now open for debate. We are watching global concerns and liabilities as a result of China’s recent downturn and currency devaluation reflect in additional concerns throughout the global currency markets. We have to be aware that these issues typically don’t end quickly or without some form of government intervention. This means we may have quite a bit of time to play these moves and find good trades.
Right now, the Russian Ruble, British Pound and the Canadian Dollar appear to be poised for a breakdown in prices in the immediate future – breaking through support and possibly dropping to recent historical lows. The Euro is setting up for a breakout/breakdown move with a very narrow trigger price level range. The Euro may follow rally, briefly, if the US Dollar retraces a bit from current levels. Remember, these are weekly chart and help to understand the broader price trend. A breakdown in the Russian Ruble, British Pound and Canadian Dollar would likely coincide with a rally in the US Dollar and possibly the Euro. Therefore, watch for weakness in these markets and strength in the US Dollar as these moves happen.
If you’ve been follow our research recently, you already know why our members and followers stay dedicated to our team and our services. We have called nearly every move in the markets over the past 8 months perfectly. We urge you to visit www.TheTechnicalTraders.com to read some of our most recent research and to stay ahead of the markets by joining our membership services where we provide access to our most advanced predictive analysis tools and research. You owe it to yourself to have a dedicated team of professionals that can help you find success and stay ahead of the markets if you want to build greater success in your future.
53 years experience in researching and trading makes analyzing the complex and ever-changing financial markets a natural process. We have a simple and highly effective way to provide our customers with the most convenient, accurate, and timely market forecasts available today. Our stock and ETF trading alerts are readily available through our exclusive membership service via email and SMS text. Our newsletter, Technical Trading Mastery book, and 3 Hour Trading Video Course are designed for both traders and investors. Also, some of our strategies have been fully automated for the ultimate trading experience.
Get our advanced research and market reporting, Daily market videos, detailed trading signals and join the hundreds of other traders that follow our research every day and profit.
Chris Vermeulen
Technical Traders Ltd.
https://thegoldandoilguy.com/wp-content/uploads/2018/04/fib.jpg10932048adminhttp://www.thegoldandoilguy.com/wp-content/uploads/2014/11/tgaoglogo.pngadmin2018-07-24 11:28:522018-07-24 11:28:52Foreign Currencies Show Massive Volatility/Rotation Setup
The following Weekly charts are illustrations of one of our proprietary price modeling systems that shows trends, market breadth and much more. We use this almost exclusively on longer-term (Weekly, Monthly, and Quarterly charts) to help us understand where longer-term support and resistance levels are, where the market ranges are truly important and to determine true market breadth. When we are studying Daily chart or intra-day charts – the shorter term price rotation can often clutter our interpretation of the long term expectations. Yes, we have other modeling systems, predictive analysis systems, Fibonacci systems, Adaptive Cycles systems and more. Our collection of proprietary analysis tools is very deep. Yet, one has to know how to use these tools and what value they can provide at different times.
This proprietary modeling system is designed to model price swings/rotation and provide clear overall objective analysis of key price levels/pivots. We call it “TT Charger”.
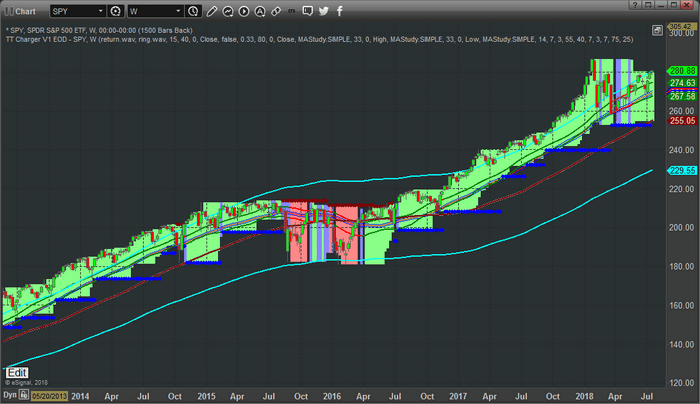
Weekly chart of the SPY using our TT Charger modeling system
This first Weekly chart of the SPY using our TT Charger modeling system is clearly still bullish. The price breadth contracting a bit near the current prices and support is currently functioning near $252. The current market price has recently broken higher above the short term price channels in addition to the longer term price channels. This is a pretty good indication that price may attempt another rally attempt that may extend for many weeks. In 2017, we witnessed more than 5 to 15+ weeks of extended price rally above both of these channel levels at times. The recent rotation in February 2018 may operate as a “recharging of price” in terms of a future rally attempt.
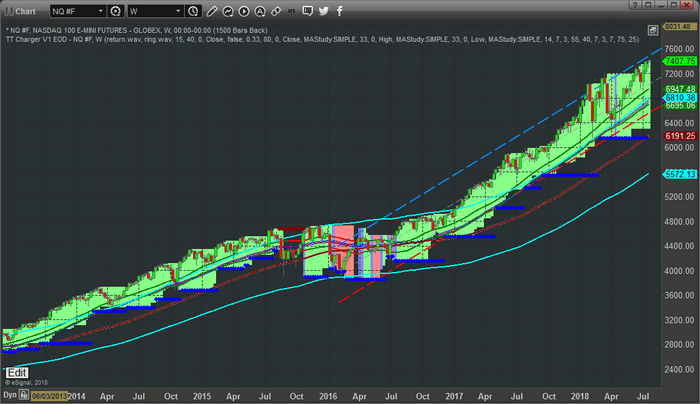
Weekly NQ chart with the TT Charger
This Weekly NQ chart with the TT Charger applied for shows an even more incredible setup. Support is currently setting near $6190 and price has extended beyond both of the price channels for more than 11 weeks now. Market Breadth is expanding, therefore the implied volatility is increasing as well. Although we may not see a very big volatility rotation in price, the capability of increased volatility is still valid.
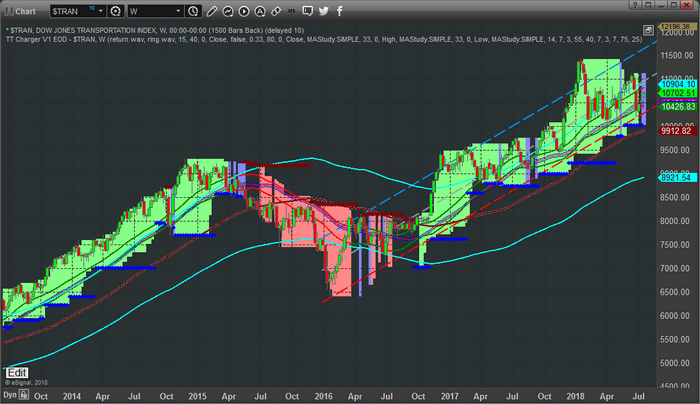
Weekly Transportation Index chart
This Weekly Transportation Index chart paints a clearer picture of the struggling Transportation Index in terms of the recent price rotation. The TT Charger analysis still shows a solidly bullish price trend with support at $10,005. Price is within the longer term price channels and just above the shorter term price channel. The Transportation index typically leads the US equities markets by about 4~8 months, so it is important that we see the Transportation index rally in support of the equities markets rally. If this fails to happen, then we are likely experiencing a “capital appreciation” that is not supported by economic fundamentals. In other words, without a rally in the Transports, any price advance in the equities markets is likely short-lived (3~6 months at best) before one of the two will break.
At this point, our interpretation of these charts is that the US earnings season should drive equities prices higher, within and above these price channels, and create a real opportunity for investors/traders. Yes, support is quite a bit below the current price levels, but these support models will adjust as price advances. Unless a reversal trigger is generated, which does not seem likely right now, or the support levels are broken, which is not likely right away, we should be looking for advancing prices and breakout rallies over the next few weeks or months.
Our members have access to much greater insight and analysis than we can share with the general public. We reserve our most advanced price modeling systems, predictive analysis and research for our exclusive membership levels. We are warning you that a massive upside swing is about to setup and you’ll want to be prepared for it because this could be a true “once in a lifetime” type of move. We also urge you to consider joining www.TheTechnicalTraders.com as a member to receive all of our detailed updates, daily videos, trading signals and more. If you don’t believe we can assist you in your future with our research, analysis and other features and benefits, you can cancel your subscription and move onto something else.
Either way, we urge you to be prepared for this next move higher and take a few minutes to read over our most recent public research posts at www.TheTechnicalTraders.com/FreeMarketResearch/.
Chris Vermeulen
https://thegoldandoilguy.com/wp-content/uploads/2012/09/NewTradingIndicator.jpg665695adminhttp://www.thegoldandoilguy.com/wp-content/uploads/2014/11/tgaoglogo.pngadmin2018-07-22 09:00:512018-07-22 09:00:51Proprietary System Shows Rally Could Extend Higher
Over the past 4+ months, we’ve been working away trying to keep our readers aware of the risks and concerns that were originating out of some foreign markets and how that might relate to the US markets. We remember a point in time back in June or July 2017 when we, suddenly, started receiving emails and calls from moderately large Indian, Indonesian and other foreign development companies asking to schedule time for an “introduction call”. It is not unusual for us to receive cold calls from development firms looking for new projects, but at one point we were getting 2 to 3 calls a week.
The point behind what we are sharing is that sometimes the signs are right in front of you if you are paying attention to the messages. In this case, a number of things had recently transpired – the biggest of which was the recent US Presidential elections as well as a renewed US equities market and increased volatility in certain currency markets. We also believe the currency controls in India (near November 2016), as well as the Chinese cash restrictions imposed shortly before this, were also factors that played into the current outcome. Our opinion is that these dynamic factors in the global economy, as well as the fact that many government reporting/news agencies are slow to catch onto a dramatic shift in market sentiment, resulting in a latent and somewhat aggressive price rotation in the global markets.
Which brings us to January/February 2018 – when the US and Global markets tanked, unexpectedly, by nearly -13.5%. While many analysts throughout the globe were concerned this rotation could be the start of a much deeper and potentially catastrophic global market collapse, our proprietary predictive price modeling systems and analysis systems kept telling us the US markets climb out of this rut and attempt to rally to new highs. In some ways, we took a lot of flack from others calling for this type of market rally when everyone else was calling for a breakdown in price. Still, look at where the US markets are now in comparison to all of those short-sellers that were convinced the markets were going to tank?
Right now, there is a very interesting dynamic at play that may not last forever – and most of the industry analysts are starting to catch onto what we’ve been talking about for months. That fact is that capital is very fluid and will migrate to the healthiest and most suitable investment environment possible when the environment where this capital currently resides is unfavorable or deteriorating. As we learned in the movie “Wall Street” – “Greed, for lack of a better word, is good” (Gordon Gekko: 1987 “Wall Street”). In our interpretation, Greed is the essence of the survival of capital in different market environments. Greed and Fear are two very similar emotions and they both, at times, are very good to have in measured levels. Both of these emotions drive capital into and out of markets as a natural occurrence of the global markets.
This dynamic, the capital migration that has been taking place for approximately 12+ months, may come to an end at some point in the near future and we have to be prepared for it. If we think about this scenario, what would cause this capital migration to subside or end and change dynamics? We can think of two scenarios that would be likely to play out to result in this transition :
Emerging markets stabilize, forming near-term bottoms and establishing some optimism regarding opportunities for upside price advances. This, in our opinion, may be enough of a catalyst for capital to move back into these markets in an attempt to capture returns with diminished risk factors – resulting in GREED outweighing FEAR.
Something decreases the US and major global market standing in terms of currency strengths and global market dominance. In this case, we believe some massive credit or debt risk factor would have to occur that greatly decreases the capabilities of the mature global markets (US, UK, Canada, Japan & Europe). Should something like this happen, where the biggest and most stable markets on the planet are diminished, then capital may aggressively move away from these markets and into any other market that may appear to benefit from these diminished expectations.
Until either of these things happen, we believe continued pricing pressure will exist in China/Asia, the BRICs markets and, to some degrees, in the European Union markets.
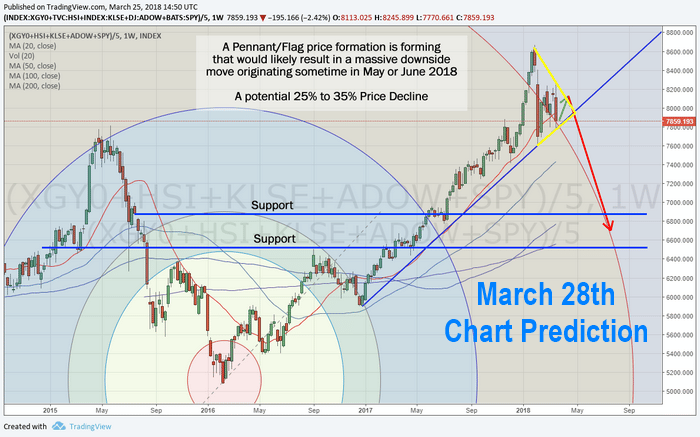
Take a Look at Our Previous Forecast on March 28th
Now, let’s start off by checking this Weekly chart of our China/Asia custom index and where it is today. One can clearly see the pennant/flag formation (the Green lines) that originated in early 2018. This pennant formation recently broke out to the downside and has already fallen nearly half way to our downside target which is incredible.
The current downside move aligns with a 38.2% retracement from the highs and we believe this move could be just starting. In other words, we believe a full 50%, or more, a pullback from these highs could be in the works if the data originating from China/Asia recently is correct. The entire region of China and SE Asia is open to interpretation and legal issues with little certainty about anything.
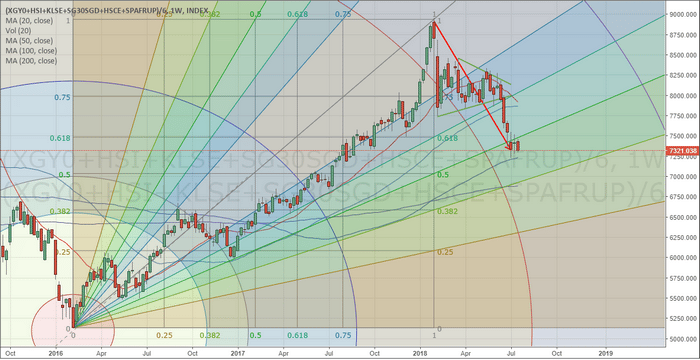
This next Weekly BRICs chart shows a similar pattern. A sideways pennant formation originating in early 2018 that broke out to the downside. A clear breach of price support and a more than -38.2% price drop so far. Our Blue price support line, originating from 2016/2017 lows, shows us that critical support is currently about -11% lower than the current price. You can see from our drawn arrows that we believe this level will create price support and price will rotate well into the end of 2018 before breakout out of this new pennant formation and moving dramatically lower. Right now, time will tell how this plays out 5+ months into the future, but at this time, unless the global market dynamics change dramatically, this is what we believe is the most likely future outcome.
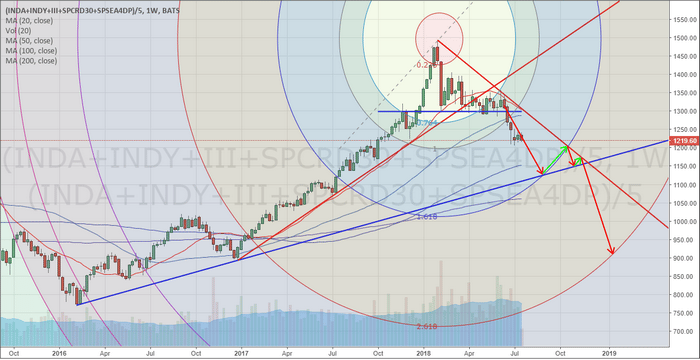
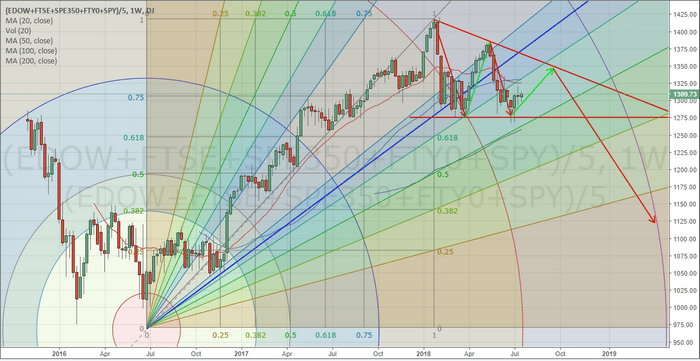
Lastly, this is the Weekly European Custom Index that shows, yet again, a somewhat similar pattern without the recent price breakdown. Originating in early 2018, a deep price rotation has created a very clear price rotational cycle. This rotation is forming a very clear pennant formation, again, and we believe the final outcome, at this point, will be a breakdown of price in the European markets as the Brexit and other regional economic and political issues continue to play out. As a word of warning, our last Red arrow (drawn on this chart) does not point to a target price level – it is just indicating that we believe a breakdown in price is the likely outcome.
If we were to add a simple Elliot Wave count to this in an attempt to isolate potential future moves, our estimate (with limited data) would be that we are in the midst of a Wave D correction. In other words, this is a corrective price trend “in an uptrend”. The move lower, as we are predicting, may not drop below the 50% retracement levels shown on this chart before finding support and attempting to start a new upside price move.
Pay attention to the global market news and the news of certainty or uncertainty originating from the global economies. Capital is “Greed and Fear and work every day”. Capital will always attempt to exit hostile or dangerous economic environments and find a more suitable environment for growth and stability. As the continued global market turmoil continues to unfold, understand that Trillions of dollars will be sourcing the safest and best returns on the planet. As these dynamics play out, there are tremendous opportunities for traders and investors to follow the cash and ride the waves. There may, certainly, be some wild rotations and waves as this capital moves around, but the longer term trends that should establish as this capital moves around should be substantial. Get ready for some excellent trading opportunities over the next 12 to 24 months.
Our exclusive member service provides detailed market research, daily market video analysis, detailed trading signals and much more to assist you in developing better skills and greater success in your trading. One of our most recent trades is already up over 12%, we already took some partial profits, and we believe much higher share prices is just around the corner. We urge you to visit www.TheTechnicalTraders.com to learn how we can assist you in finding new success.
53 years experience in researching and trading makes analyzing the complex and ever-changing financial markets a natural process. We have a simple and highly effective way to provide our customers with the most convenient, accurate, and timely market forecasts available today. Our stock and ETF trading alerts are readily available through our exclusive membership service via email and SMS text. Our newsletter, Technical Trading Mastery book, and 3 Hour Trading Video Course are designed for both traders and investors. Also, some of our strategies have been fully automated for the ultimate trading experience.
Get our advanced research and market reporting, Daily market videos, detailed trading signals and join the hundreds of other traders that follow our research every day and profit.
Chris Vermeulen
Technical Traders Ltd.
https://thegoldandoilguy.com/wp-content/uploads/2016/08/china.jpg418618adminhttp://www.thegoldandoilguy.com/wp-content/uploads/2014/11/tgaoglogo.pngadmin2018-07-19 16:09:262018-07-19 16:09:26Custom Global Market Indexes May Be Sounding Alarms
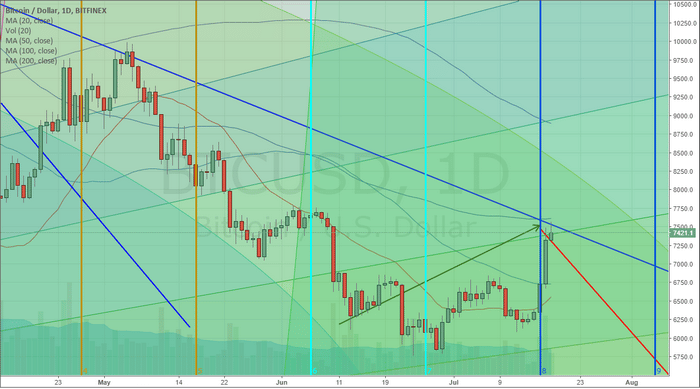
Even we were concerned with Bitcoin briefly traded below $6k in late June. Yet, the recent upside price move was incredibly quick and the price of Bitcoin ran right up to our upper price channel. We believe this will become a new price peak over the next few days/weeks where the price of Bitcoin should continue to drop from these levels near $7500. We know there are many Bitcoin investors that want to hear us state that it should continue to push higher, but there are other factors at play here that may limit this movement.
The price channels that are currently constraining the price of Bitcoin originate back in February and March of 2018. The low and high price rotation within these months start the points of interest for our research team. From these points, we have continued to identify key price levels that appear to contain breakouts.
You can see from the chart below, the upper BLUE channel line is our downward sloping price channel that is acting like an upper ceiling for the price. Additionally, you can see our “drawn Red and Green arrows” showing what we believed Bitcoin would potentially do over the next few months. We believed that Bitcoin, as it traded lower, towards $6k, may find support and rally (based on our time/price cycles) towards a peak near July 16 (showing as the end of the Green Arrow). From this point, we believe the price of Bitcoin will trail off, heading lower, with the intent to retest channel support near $5700 if the price cannot break through and hold above the blue upper channel.
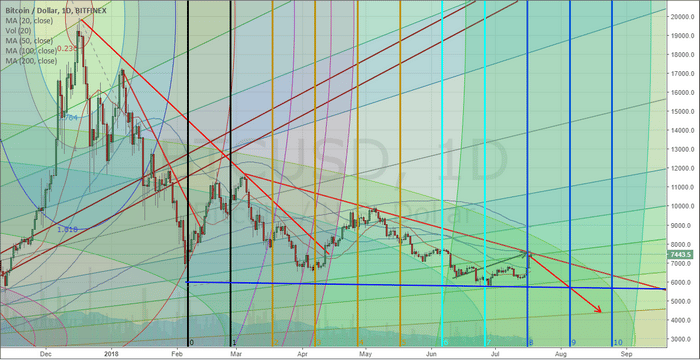
This longer-term daily Bitcoin chart shows a larger picture of our analysis work. You can clearly see the channels that are constraining price at the moment – the BLUE support channel and the RED resistance channel. The most recent lows established a new lower price point for the Blue channel – which indicated a downward sloping pennant formation is in place.
There are two things we want to caution Bitcoin investors and traders about. First, the rotation that we are expecting to complete this pennant formation could happen very quickly within a fairly tight range ($7400 to $5700). For traders, this is an excellent range for some quick profits. For investors, this could create some stress as price rotates.
Second, by our estimates, at least one more low price rotation is required before any real breakout will be attempted. If our analysis is correct, this current price peak will end with prices falling back below $6k, forming another “lower bottom” and rallying again to near the upper price channel (near $6700 or so) before trailing off for the last time – nearing the apex of the pennant formation. We believe the current outcome of this price setup will be a low price breakout, forming a potential wave 5 that should end near or below $5500. After that bottom is reached, we should be looking for a new bottom formation setting up a new advancement leg higher.
Could our analysis change, of course, it could depending on what price action shows us. Right now, this pennant formation and the wave counts are driving our analysis. The Time/price cycle analysis helps us to determine when and where price target/peaks/troughs may happen, but they are not set in stone. If you are a trader and are long Bitcoin, this may be the highest price you will see over the next few months. If you are an investor and think this is the start of a bigger move higher – we don’t agree with you. We believe we are very close to the final leg lower that should form the new price bottom – at least for a while. Once this bottom forms, we’ll be able to provide a better understanding of what we believe will happen in the future. For right now, our target low for the bottom is $4400 on or near August 20, 2018. We’ll see how it plays out.
We keep a close eye using our proprietary ADL Fibonacci and ADL Cycle forecasting systems using the Bitcoin investment trust which trades like a stock/ETF, the symbol is: GBTC.
If you want to learn how we can help you stay ahead of these global market moves and help you plan for and execute greater trades, please visit www.TheTechnicalTraders.com to learn how we assist you. We offer comprehensive research, analysis, daily video, trading signals and much more to our valued subscribers. We also offer access to our specialized proprietary price modeling systems that have proven to be timely and accurate.
Chris Vermeulen
Technical Traders Ltd.
https://thegoldandoilguy.com/wp-content/uploads/2016/07/bitmoney.jpg16822500adminhttp://www.thegoldandoilguy.com/wp-content/uploads/2014/11/tgaoglogo.pngadmin2018-07-18 22:58:022018-07-18 22:58:02Bitcoin Rallies to Upper Channel – What Next?
Our weekend analysis of the markets continues to amaze our research team simply because we see so many other researchers continue to miss the signals. We’ve been calling this market bottom since the middle of February 2018 and we have stuck to our analysis even though we’ve taken some flack from others about it. Now, with earnings nearly upon us and the markets poised to either breakout higher or rotate lower, our longer-term analysis shows the markets are in pretty good shape for a continued upside rally.
This week, there are 214 companies reporting earnings data. Next week, there are 781 companies reporting earnings data. The following week, another 1003 companies release earnings data. Combined, we are going to have 1998 companies releasing Q2 earnings data and each of these, to some extent, could drive the markets higher or lower as this data is digested.
US Real Disposable Income has increased from $12,570 (December 2016) to $13,009 (May 2018) (source : https://fred.stlouisfed.org). Gross Private Domestic Investment has risen from $3,126.18 (Q4 2016) to $3,379.11 (Q1 2018) (source : https://fred.stlouisfed.org). Personal Income has risen from $16,027.03 (December 2016) to $17,005.4 (May 2018) (source : https://fred.stlouisfed.org).
Think about those core factors of the US economy as well as the facts that US companies have been able to rebuild and restructure – often running leaner and meaner than years ago. Of course, US corporate debt levels have risen in tandem with these personal income levels. US corporate debt levels have risen nearly 20% in 2017 alone. Yet, we continue to believe the overall health of the US economic is much stronger than many people believe, and we continue to believe a huge influx of foreign capital is driving the US equities markets to higher values in the face of any isolated economic concerns. The fact is that the US equity markets are really the only location on the planet where protection from currency devaluation and localized economic/equity deflation concerns can be thwarted (at the moment).
Onto the charts…
Monthly SP500 chart
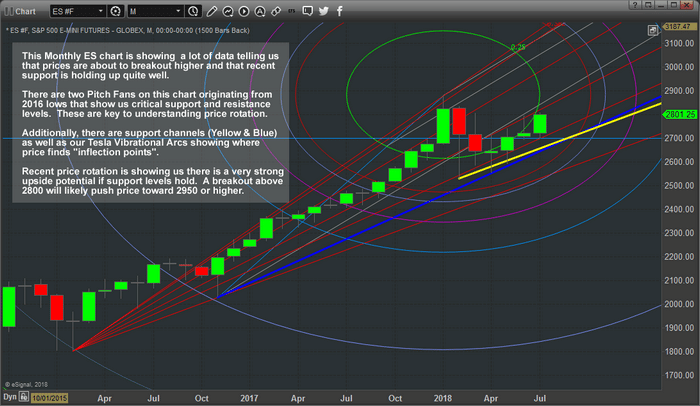
This Monthly ES chart may be a little complicated to understand when you first look at it but pay attention to our analysis of this data and it will become easier to understand.
The two support channels (Yellow and Blue) are critical to understand price support. These longer-term price support levels are key to understanding how and when this current upswing in price may end (if it ends). Right now, these support levels are telling us that price has established a low rotation point and advanced higher setting up these support channels as key price levels should it break lower. As long as these support channels hold, price should continue to push higher.
Additionally, pay attention to out proprietary Tesla Vibrational Arc (circles) on this chart. They are showing us that price has recently exited the inner (25%) arc and is currently rallying outside of this price level. In theory, as long as the support channels hold and price attempts to move towards the next Tesla Arc, we can expect price to advance towards $2950 or $3080 throughout the end of this year. The current level, near $2800, can be seen as an “inflection point” where the outer RED arc crossed our Pitch Fan level. This would indicate that any move above $2800 would likely prompt a bigger upside move towards $2950 or higher.
Lastly, the Pitch Fans are drawn from 2016 low points and are used to attempt to identify and highlight price support and resistance levels. In this case, we are using them to identify “crossing points” where these fan levels cross our Tesla Arcs and other drawn lines to see where price may be targeting in the future. Just above the current price, we see a Red and Grey Pitch Fan level that is acting like resistance near $2850. Understand that these levels, once breached, will likely propel the ES price much higher.
Monthly Nasdaq chart
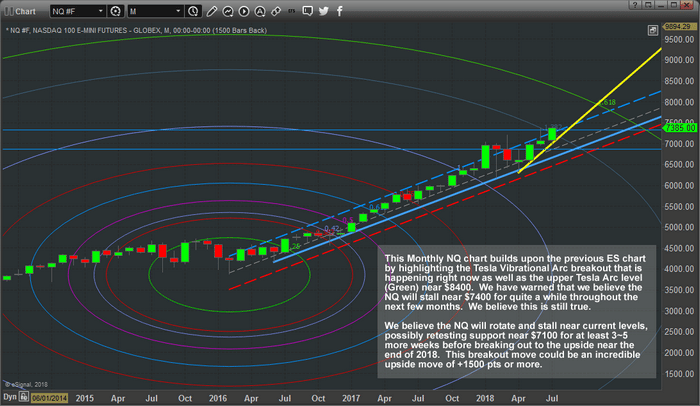
The Monthly NQ chart below shows similar price action to the ES chart – yet we see a more defined uptrend in place. As we’ve been warning, we believe the NQ will stall/rotate near the $7400 level for at least the next few weeks (3~5+ weeks) before attempting a further upside move into the end of 2018 and possibly longer. Right now, the NQ has rallied to all-time highs this month and is sitting very close to our $7400 target level. We can see from this chart we have two upward sloping price support channels (Yellow and Light Blue) that provide us with a very clear understanding of where price support is located. The current, Yellow, level is more recent and will likely be broken if the NQ stalls as we expect.
The Std. Deviation channel (the Dashed lines) on this chart shows that price has been rotating near the upper levels of this price channel and that price is attempting a breakout upside move currently. Notice the Tesla Vibrational Arc that is sitting very near to the $7375 level? This arc will likely result in some lower price rotation in the NQ over the next 3+ weeks with the potential that we could see a rotation to near $7100 or lower before another upside move sets up. Generally, when the price exits the upper Std Deviation channel and coincides with one of our Tesla Arcs, one of two things will likely happen; a. price will stall and rotate lower a bit before breaking out of this congestion or, b. price will blow right past this arc level in a massive price breach.
Right now, we believe our earlier estimate that price will consolidate and stall near $7400 is the correct interpretation.
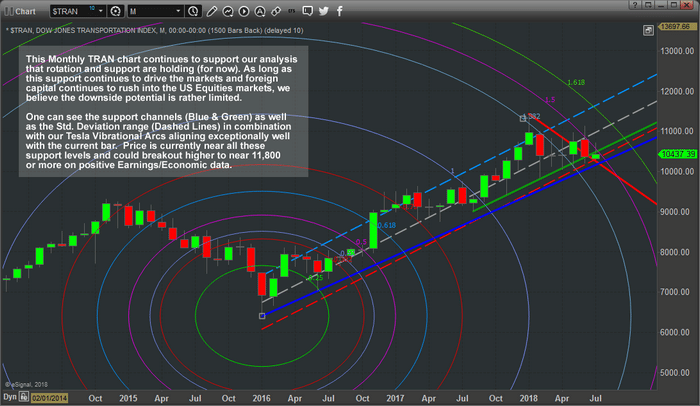
Monthly TRAN (Transportation Index) chart
This Monthly TRAN (Transportation Index) chart below provides one of the clearest pictures yet of the true underlying market dynamics (in our opinion). Feb 2018 highs are still in place – they are still the critical component from a technical basis for any further upside price moves. Support channels, both the Green and Blue solid lines) are indicating that price is currently within these support channels and has not broken lower (yet). The Std. Deviation channels (the Dashed lines) are showing us that price is currently sitting near the lower Std. Dev levels (near dual support).
Additionally, the Tesla Vibrational Arc (the Purple arc near the current bars) is showing us that price has recently broken through the previous arc (the Light Blue arc near the Jan/Feb 2018 highs : 1.382%) and is struggling to break out of this new Purple Arc (1.50%). What this means to us is that price is “coiling near support and will likely make an explosive move – one way or the other”.
Now, take into consideration the Red Resistance Channel Line that created a Pennant/Flag formation recently. We’ve seen price, over the most recent 3+ bars, rotate above this Red Resistance level and rotate back into it. Now, with the Month of July, we see price struggling near these lows, yet very near to the support channels and Std. Deviation channels, as well as very near to the Purple Tesla Arc. Knowing that we have nearly 2000 earnings data points hitting the markets over the next 3 weeks and the correlation of support/upside breakout analysis that we’ve identified in the ES and NQ markets, only one analysis can be made for the Transportation Index….
As long as the $10,100 support level holds and the ES/NQ do not break their immediate (YELLOW) support channels, the Transportation Index is setting up to be one of the best buy opportunities (with low risk) that we’ve seen in a very long time. Yes, there is downside risk should the markets break lower – we understand that. The fact that all of these longer-term charts are aligning with the potential that earning could drive the market to fresh highs, the Transportation Index appears to be one of the most opportunistic setups we’ve seen so far.
Now, are you ready for these next few weeks with earnings about to hit the markets? Are you prepared to take advantage of these setup and potential moves? Do you understand what we are attempting to illustrate to you and how these types of setups can dramatically improve your trading success?
Want to know how we can help you even more than just showing you these nice charts? Then visit www.TheTechnicalTraders.com to learn how we can help you stay aware and ahead of these markets moves and how our team of researchers can help you find greater success.
The markets are going to move over the next 2~5+ months and our analysis has already shown us that the markets want to continue to “melt higher”. The only concern we have, at this point, is if some external news/crisis event disrupts the price advance and breaks support. If not, then this market should rally from these support levels and attempt new/fresh highs within the next 20~45+ days. Don’t miss it.
53 years experience in researching and trading makes analyzing the complex and ever-changing financial markets a natural process. We have a simple and highly effective way to provide our customers with the most convenient, accurate, and timely market forecasts available today. Our stock and ETF trading alerts are readily available through our exclusive membership service via email and SMS text. Our newsletter, Technical Trading Mastery book, and 3 Hour Trading Video Course are designed for both traders and investors. Also, some of our strategies have been fully automated for the ultimate trading experience.
Get our advanced research and market reporting, Daily market videos, detailed trading signals and join the hundreds of other traders that follow our research every day and profit.
Chris Vermeulen
Technical Traders Ltd.
https://thegoldandoilguy.com/wp-content/uploads/2018/07/2-2.png406700adminhttp://www.thegoldandoilguy.com/wp-content/uploads/2014/11/tgaoglogo.pngadmin2018-07-17 22:24:172018-07-17 22:24:17Longer-Term Charts Show Incredible Potential
Crude Oil has been a major play for some traders over the past few months. With price, rotation ranges near $5~$7 and upside pressure driving a price assent from below $45 to nearly $75 peaks. This upside price move has been tremendous.
Over the past few weeks, many things have changed in the fundamentals of the Oil market. Supply continues to outpace demand, trade tariffs and slowing global economies are now starting to become real concerns, foreign suppliers have continued to increase production, US Dollar continues to strengthen and social/political unrest is starting to become more evident in many foreign nations.
When we consider what could happen with oil in the future with regards to over-supply and the potential for constricting global markets, we have to understand that support will likely be identified at levels that are much lower than current price – possibly below $60. Yet, at the same time, we must understand that disruptions in supply and/or regional chaos, such as war or political turmoil, in specific regions could cause the price of oil to skyrocket as these disruptions continue.
Right now, three key issues are driving Oil lower:
– A stronger US Dollar is making it more expensive for foreign nations to purchase Oil on the open market as well as moving capital away from foreign local investments and migrating capital into the US Equities markets
– Supply issues (the increased capacity for greater supply) is resulting in a glut of oil available on the open market when we have dozens of supply ships still waiting to offload throughout the world. In other words, we have an over-supply of oil at the moment.
– A lack of any urgency or crisis event to support Oil above $65 at the moment. Given the slow, but consistent, transition towards cleaner more energy efficient vehicles and energy as well as the lack of any real conflict or crisis event to disrupt supply, it appears there is no real support for Oil above $65 – at least so far.
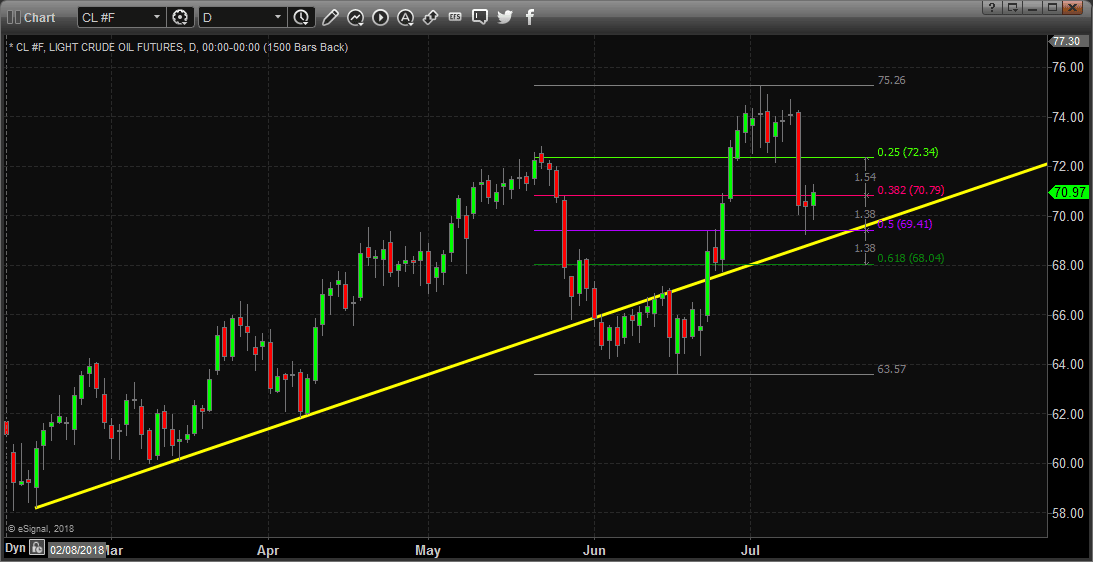
Daily Crude Light Chart
This Daily Crude Light chart shows a simple price channel that correlates recent price lows into a channel and shows a Fibonacci Retracement range for recent price rotations. We can see that the price of Crude is holding just above the 50% retracement level right now and any breach below $70 would be a very strong downside price breakout. Should price drop below $68, we could see a selloff to below $64 as price may attempt to establish a new “price low” to the downside.
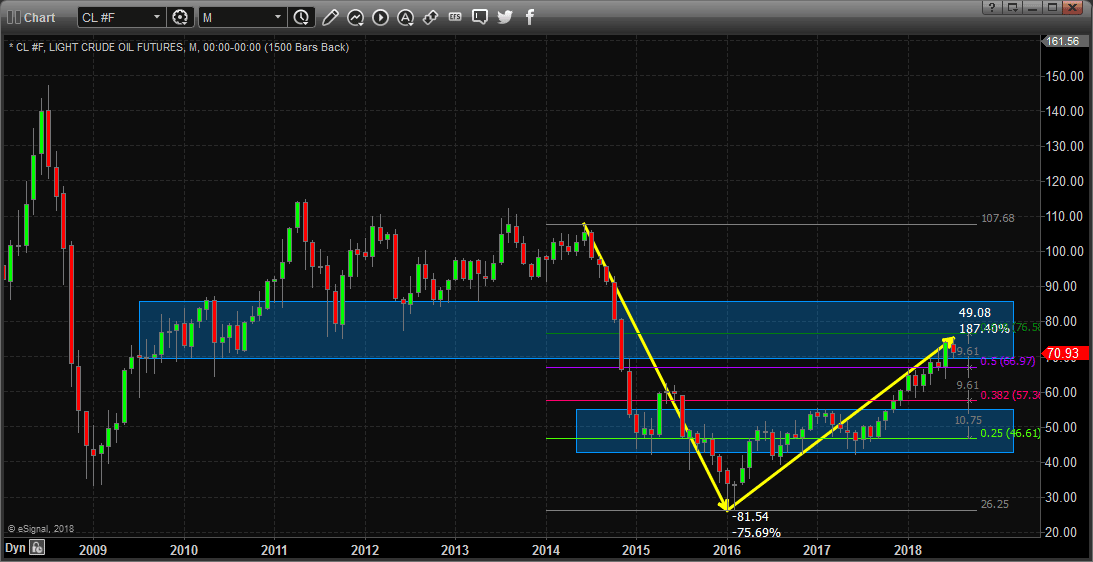
Monthly Crude Chart
This Monthly Crude chart below shows us where we believe support and resistance price zones are located. You can see from the highlighted areas that resistance is located between $70~86 and support is located between $44~56 on this longer-term monthly chart. You can also see that the Fibonacci retracement levels for the current upside move are currently nearing 55~57% (above the 50% level and nearing the 61.8% level). The combination factor that Crude has recently rotated lower, near the upper price channel, within the resistance zone, above 50% and nearing 61.8% Fibonacci level, strongly suggests that we could see a stronger downside price swing in the near future. Until $60 is breached, consider this move simple rotation. Once $60 is breached to the downside, then consider this a deeper downside price move.
With so many factors in play throughout the world, one has to be aware that Crude Oil is a commodity that correlates to expected economic activities, global crisis events, and supply/demand factors. Right now, an almost perfect storm is setting up for Oil to continue to fall to new lows which will likely push Crude below $60 ppb (eventually) and may push it down to near $55 ppb (our upper support zone). We caution traders/investors through – any crisis news item, war or other disruption in supply could dramatically alter the factor that makes up this price prediction. Right now, without any of these issues, we see Oil continuing to fall towards the $60 price level.
Also, visit www.TheTechnicalTraders.com/FreeMarketResearch to read all of our most recent free research posts. We believe you’ll quickly see the value in what we provide our members and our visitors by reading and understanding how we have continued to stay ahead of these market moves for months.
53 years experience in researching and trading makes analyzing the complex and ever-changing financial markets a natural process. We have a simple and highly effective way to provide our customers with the most convenient, accurate, and timely market forecasts available today. Our stock and ETF trading alerts are readily available through our exclusive membership service via email and SMS text. Our newsletter, Technical Trading Mastery book, and 3 Hour Trading Video Course are designed for both traders and investors. Also, some of our strategies have been fully automated for the ultimate trading experience.
Get our advanced research and market reporting, Daily market videos, detailed trading signals and join the hundreds of other traders that follow our research every day and profit.
Chris Vermeulen
Technical Traders Ltd.
https://thegoldandoilguy.com/wp-content/uploads/2013/04/oilslide21.png4341128adminhttp://www.thegoldandoilguy.com/wp-content/uploads/2014/11/tgaoglogo.pngadmin2018-07-16 16:27:302018-07-16 16:27:30Crude Oil May Not Find Support Above $60 This Time
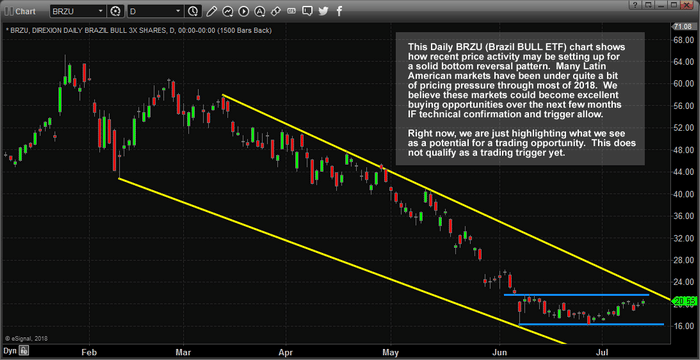
Over the past 4+ months, many emerging markets have come under pressure as the global markets were roiled by the sudden and relatively deep market retracement in early February. For many, this downward price trend has been frightening and somewhat disastrous. Recently, though, something new appears to be on the horizon that may be the early signs of renewed life for many Latin American, South American and Indian markets – early signs of support and a potential bottom formation in the works.
Our researchers have been following the recent moves in these emerging market ETF for Brazil, Latin America, and India with great interest because we believe in finding opportunities when many others may not be looking for them. We believe these early warning stages of a market bottom could be an excellent time to “forward think” any possible price recovery that may occur in the near future and to prepare for any success opportunities that may arise. Heck, we are traders and if the opportunity exists for a decent profit with little risk, we’ll investigate it.
Let’s get started with this Daily chart of the BRZU (Brazil Bull 3x ETF). We can see from this chart the extended downtrend channel that has existed for nearly 4 months. Near the bottom right side, pay close attention to the horizontal price channel that is setting up – this could be an excellent bottom rotation channel resulting in an upside breakout eventually. With only 3 to 7 days to go before the upper price channel may be challenged and a clear double bottom formation near $16, any downside rotation below $17.50~18 would be an excellent buying opportunity range with $16 being our protective stop level. Assuming this channel continues as price reaches this apex, at some point price will either rotate higher or continue to channel lower (below the $16 level). So, buying near the lower range of this horizontal price channel may be a great opportunity for an upside move.
Additionally, the GAP between $26 and $28 is a clear upside target. We would hope this move would be quick and simple, buy below $18 with a target above $26. A quick $9 profit per share (50%+) and we could manage the remainder of our trade by moving our stop to $23 or $24 to protect against any unwanted losses.
Yet, in order for this trade to really have any teeth, we would need to see some correlation across multiple emerging market ETF. Then we could really say that we may be seeing some type of bottom rotation starting to form. Let’s look for more correlative signals.
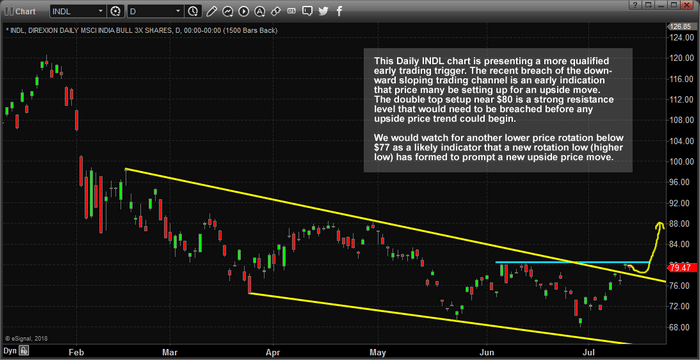
This next chart is a Daily INDL (India Bull 3x ETF) and it is showing a similar pattern that has recently broken above the downward sloping price channel. This is a good sign that price may be attempting a rotational upside move in the near future. Yet, upon closer inspection, we can see that a double top is setting up $80 that may unsettle this move. Additionally, the range of the price channel is rather deep – $68 to $80. That $12 range may include a bit more RISK than we want to consider at the moment. Certainly, this trade looks like it may have some potential, but there are still concerns that this trend may be a false flag type of move.
We would like to see more pronounced and defined “higher low” rotations in the process of creating this double top formation. Currently, we have a few moderate higher low setups, but the deeper low near the end of June is concerning. Ideally, we would wait for a low price move below $72~74 and watch for price rotation back to the upside as a better sign that price is “technically conforming to Fibonacci price rotation theory”.
Still, this pattern is setting up as resistance near $80 with a clear sign that a bottom could be forming in INDL at the moment. Our opinion is to watch it and wait for a better setup before taking a position. We believe we can identify a better entry point by waiting for price to show us it is ready to move higher instead of presuming this rotation WILL move higher.
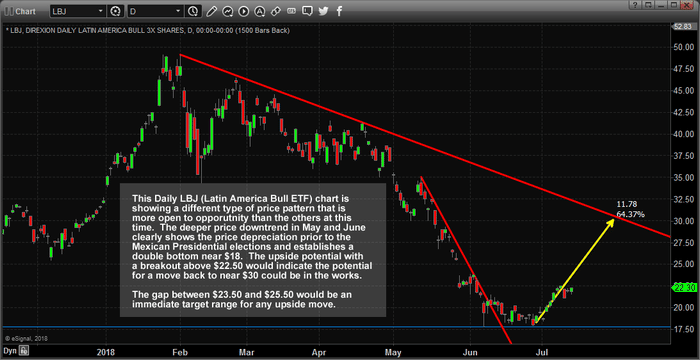
Lastly, let’s take a look at this LBJ (Latin America Bull 3x ETF) Daily chart. We find this chart very interesting for one simple reason – the big “U” shaped bottom formation near $17.50 and the clear upside price swing that is taking place right now. You can clearly see the RED price channel slopes that are key to understanding price resistance and the more aggressive downward slope that was breached in mid-June. Yes, should this ETF rally back to near $30 from this level, we would be looking at a 50%+ increase in value. Yet, again, we have to learn to be patient and wait for the price to show us that it is preparing for an upward swing higher.
As of right now, we have “higher highs”, which is a great sign that the trend has changed to the upside. Yet, we also have a clear GAP between $23.50 and $25.50 that could become immediate resistance. We also don’t have any “low price rotation points” that we can use as a technical confirmation of price trend and price rotation. In other words, we have what may be an impulse move higher with no real confirmation of longer-term upside potential.
We would caution investors from jumping into this trade at this time and urge them to wait for better confirmation – likely after the breach of the price GAP is filled and price rotates back below, or near to, $20. Short and simple, this is a very interesting bottom formation in the works that has not qualified as a solid uptrend yet. There are still too many unanswered concerns to allocate capital towards this trade.
While all of this is interesting and possibly a bit early in terms of bottom formation expectations, we believe the correlation across these multiple markets shows enough evidence of a potential emerging market bottom in select markets as it relates to these under performing Latin American and Indian markets. Obviously, we still have to be cautious of any downside rotation that could be dangerous – these percent ranges still show quite a bit of risk. But the upside potential for a perfectly timed entry may be just around the corner.
Want to learn more about what we do and how we help traders find success in the markets? Visit www.TheTechnicalTraders.com to learn how our research team, with more than 50 combined years of trading experience, can assist you in finding tremendous trading opportunities each month as well as provide you with detailed market research, Daily market videos and much more. Our job is to help you find and execute successful trades in the future and to help you stay aware of future market moves.
Visit www.TheTechnicalTraders.com/FreeMarketResearch to see how our research team has been ahead of these turns in the global markets for the past 8+ months. We have an incredibly deep research library of posts available to all members/visitors at the link above. We are certain you will find value in our work and our abilities to accurately predict the markets. We’ve been calling for upside price moves in the US Equities markets since the middle of February when everyone was warning about a collapse. We called the downtrend in China months before it happened and we recently called the downward rotation in Crude 4 days before it happened.
https://thegoldandoilguy.com/wp-content/uploads/2018/07/1-2.png360700adminhttp://www.thegoldandoilguy.com/wp-content/uploads/2014/11/tgaoglogo.pngadmin2018-07-15 22:15:192018-07-15 22:15:19Emerging Markets Could Be Starting A Relief Rally