Get Chris’ Trade Alerts at http://www.thetechnicaltraders.com/
Produced by https://www.HoweStreet.com
Don’t miss out – Stay Informed!

Produced by https://www.HoweStreet.com
Don’t miss out – Stay Informed!
As we mentioned in an update to members Sunday night, over the next 30-60 days we are working to implement and automate some of our best trading setups (Trend/Swing trades, spike alerts, and gap trade) so they post instantly for you in the member’s area. Our goal is to provide members with 1-3 trade setups each week like clockwork.
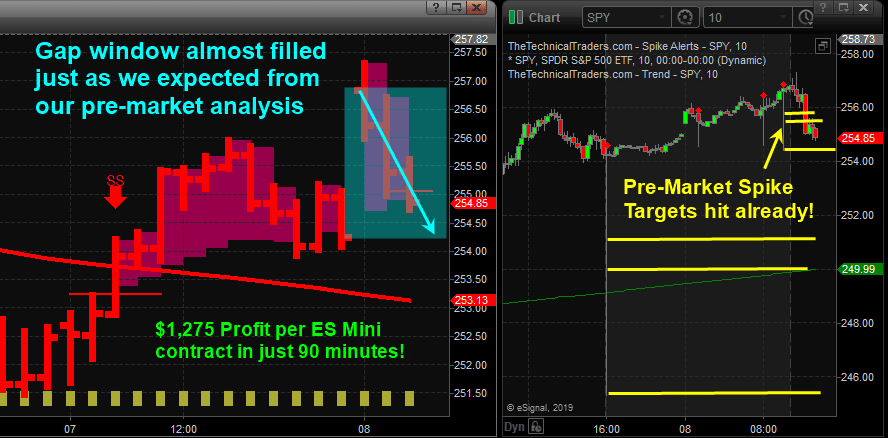
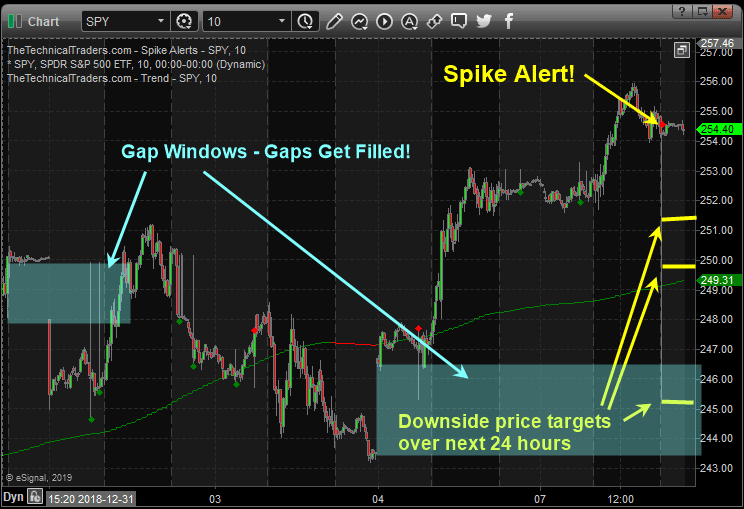
Below is a quick update showing two setups that unfolded this morning and they are winners for those of you who are momentum and day traders. These two trade setups “Price Spikes” and “Gap Windows” are based around momentum. These trades typically reach their targets in 1-24 hours and this morning both reached our targets for quick easy money!
We are also going to be implementing our index trading signals and intraday updated chart analysis so we don’t miss any trades and have a steady stream of trading opportunities.
Also, we plan to add our HotShots ETF and Stocks list so when we have a buy signal in the SP500 you can look to trade something with a high beta that is outperforming the broad market. ETFs include 3X funds for various indexes and sectors and leading high-beta stocks which move 3-20% a day at times.
2019 – 2020 is going to be full of incredible opportunities so be sure to become a paid member today to benefit!
If you are a long-term investor, swing trader, or day trader, then you could find one or all of the charts below interesting. What I am going to briefly cover and show you could make you think twice about how you are investing and trading your money.
I will be the first to admit you should not, and cannot, always pick market tops or bottoms, but there are certain times when it’s worth betting on one.
Below I have shared three charts, each with a different time frame using daily, 30 minutes, and a 10-minute chart. Each chart also has a different technical analysis technique and strategy applied.
Each shorter time frame chart as we work down the page zooms in closer to more imminent price action that should take place over the next few days.
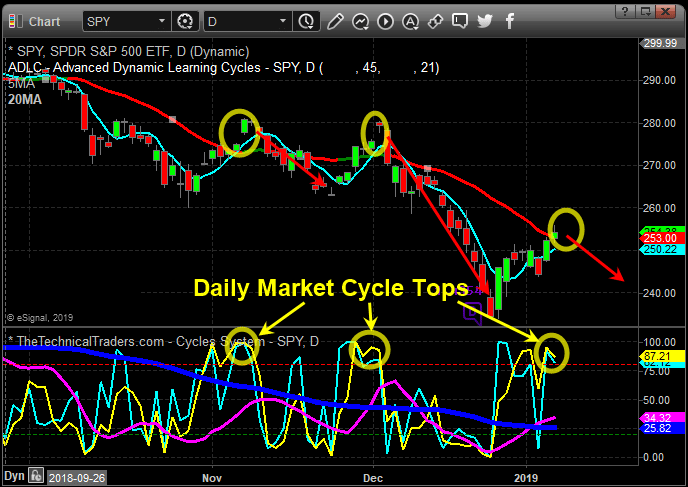
The daily chart below shows a clear overall trend which is to the downside. Trends are more likely to continue than they are to reverse, hence the saying “The Trend Is Your Friend.”
A key piece of data on this chart is the blue investing cycle line at the bottom. If this is trending down or below the 50 level, then money should be focused on profiting from falling prices via inverse ETF’s, short selling, or put options.
Equally important are the yellow and baby blue cycle lines at the bottom. When these enter the upper reversal zone, we should expect sellers to step into the market and for the price to fall.
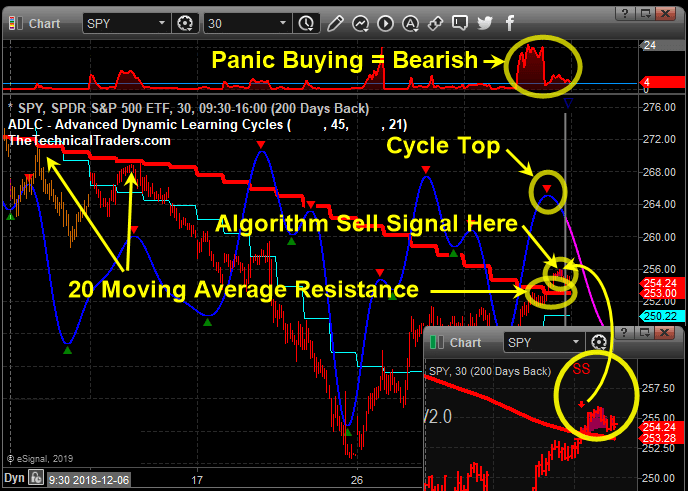
I apologize for the noisy chart below, a lot is going on there, but if you focus on the yellow text and drawings, it will help keep things simple.
This chart shows several reasons why we expect the price to fall. Based on technical and statistical analysis this chart points weakness over the next 1-3 trading days.
Monday night (Jan 7th) after the closing bell the SPY ETF chart generated a sizable price spike to the downside. Those of you who follow our spikes and or at least know about these setups then you know we expect the price to reach at least one if not all spike targets which are 30%, 50%, and 100% of the spike within 36 hours.
So far in 2019 we have has six price spikes five winners, one loser which is an 83% win rate thus far. Today’s spike is abnormally large not sure what that means regarding this one being a success but it is another spike signal, and the odds favor a move down once you see the other analysis supporting this setup.
Watch the video on how we trade price spikes: https://www.youtube.com/watch?v=jq-SrF-B8MU
In short, 12 months I publically posted a 31-minute video on the stock market explain how 2018 would be wild and how the stock market should top out which it confirmed this a week ago when the December monthly stock market chart closed below critical support. The video goes on to explain how 2019-2020 will most likely be a bear market and economic recession, and that is exactly what looks and feels like is starting to unfold behind the scenes.
If you are boring long-term investor and have been stuck having to ride the stock market rollercoaster with your life savings my trading newsletter can help you with your long-term portfolio to not only avoid losses but profit from the collapse with one simple inverse exchange-traded fund which trades like a stock and you buy and sell it at anytime! Knowing when you put your nest egg to work, and when to back away and protect it is crucial if you want to become wealthy or become wealthy.
On the flip side, if you are an active trader looking for monthly trades then be sure to join the Wealth Building Newsletter today and receive my daily pre-market video analysis, so you understand what took place yesterday, during overnight trading, and what to expect when the market opens.
Subscribe today and become part of our trading community and prosper from the coming market correction and real-estate downturn.
Chris Vermeulen
Wealth Building Newsletter
www.TheTechnicalTraders.com
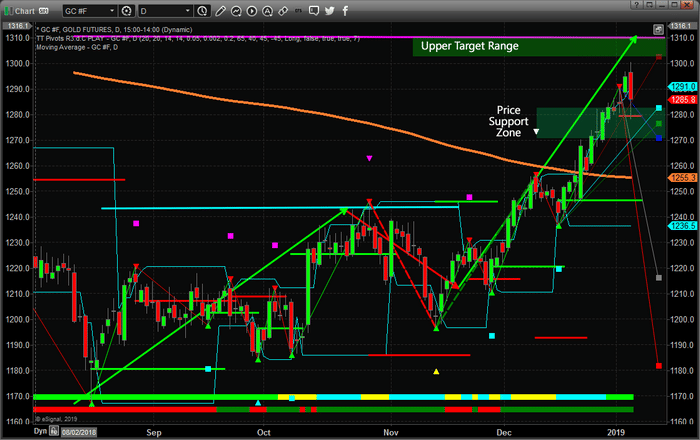
Early trading on January 4, 2019, saw Gold reach just above $1300 per ounce – confirming our price target from our research and posts on November 24, 2018. The importance of this move cannot be under-estimated. Traders and investors need to understand the recent rally in the metals markets are attempting to alert us that FEAR is starting to re-enter the market and that 2019 could start the year off with some extended volatility.
Our research has shown that Gold will likely rotate between $1270~1315 over the next 30~60 days before attempting to begin another rally. Our next upside price target is near $1500. We will continue to post articles to help everyone understand when and how this move will happen. We expect Gold to rotate near the $1300 level for at least another 30 days before attempting another price rally.
Pay attention to the Support Zone on this Daily Gold chart and understand that price rotation is very healthy for the metals markets at this point. A reprieve in this recent Gold rally would allow the start of 2019 to prompt a moderate rally in the US stock market as well as allow a continued capital shift to take place. As capital re-enters the global equities markets, investors will be seeking the best investment opportunities and safest environments for their capital. Our belief is that the US stock market will become the top-tier solution for many of these investments.
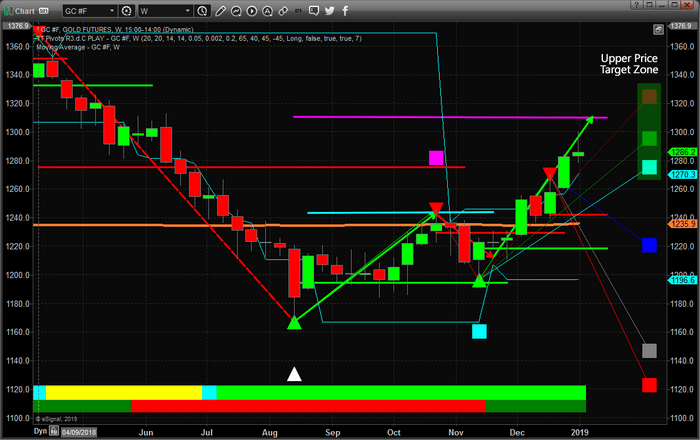
This Weekly Gold chart shows our Adaptive Fibonacci price modeling system and why price rotation is important at this time. The highlighted GREEN Fibonacci price target levels on the right side of this chart are projecting upside price objectives for the move that started near mid-November. We can see that $1325 (or so) is the highest target level and that $1273 to $1288 are the lower levels. This suggests that we have already reached the upper resistance range and a mild price rotation would allow for the price to establish a new fractal low rotation that would establish NEW upside Fibonacci price targets. In other words, we much have some price rotation to support the next leg higher in the Metals markets
If you’ve been following our research and comments on the past 90+ days. You’ll already know that we’ve nailed many of these market moves. The SPY, Natural Gas, Oil, Gold, Small Caps and so many more. We’ve been calling for a massive price bottom in the US stock market since well before the November 6th US Elections. Our proprietary predictive modeling systems called the huge moves in Oil, Natural Gas, Gold/Silver, and many others. If you were not profiting from these moves, then you need to visit www.TheTechnicalTraders.com to learn how we can help you in 2019. Our memberships are very inexpensive and the support we provide you is incredible for skilled traders. Want a team to help you create success in 2019, then visit www.TheTechnicalTraders.com and get started creating success.
Chris Vermeulen
Our research team has been nailing the markets moves with our proprietary price modeling tools. Our December 12, 2018 call that Natural Gas would collapse nearly 30% after reaching a price peak was a very bold call. Who would have thought that predictive price modeling could be so accurate and could identify a move like this – or call for what is expected to happen next?
Back when Natural Gas breached the $4.60~4.80 range, our ADL predictive modeling system was suggesting a massive price anomaly was setting up. These types of triggers are becoming more common as volatility in the general markets increases. The ADL system suggested that a massive -30% downside price move would happen before the end of February 2019.
Now, as that trade has completed and our targets have been reached, we are alerting our followers that Natural Gas should begin to consolidate between $2.80 and $3.30 before attempting to rocket back above $4.00 near April or May 2019. Read our original analysis of Natural Gas to learn why these moves provide an incredible opportunity for traders and visit www.TheTechnicalTraders.com/FreeResearch/ to read up on our early 2019 market predictions.

Join our other members in making 2019 an incredibly successful year. We believe 2019 will provide exceptional opportunities for skilled traders and we’ll be happy to share our proprietary research and analysis with you as a member of Technical Traders Ltd. You really don’t want to miss these moves and this incredible opportunity. Think about it, one trade like this with a -30% selloff followed by a 24% price rally could make your entire year. Imagine being able to find trades like this every week or month for success. Visit www.TheTechnicalTraders.com and get ready to make 2019 a fantastic year of success no matter if we have a bull market or bear market.
Chris Vermeulen
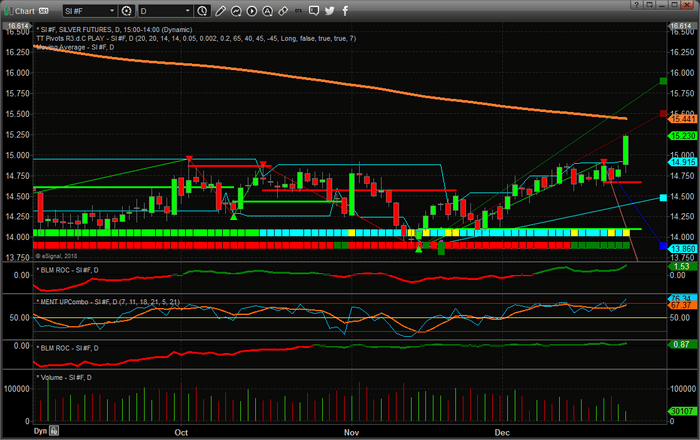
Watch Silver, folks. This quiet shiny metal is starting a move that could be very foretelling of global market concerns and risks. Early on December 26, 2018, Silver broke through recent resistance, to the upside, with a relatively large 2.8%+ upside move. Why is this so important to traders? Because Silver is the “sleeper metal” that is typically the last to react to global economic concerns. Once Silver starts to move to the upside with a renewed bullish trend, we believe this move would indicate that bigger players are starting to accumulate Silver as a safe haven for future economic concerns/crisis events.
This Daily chart of Silver shows the December 26 upside breakout move. We can clearly see the breakout above $15.00 and the historical resistance just below $15.00. This move is extremely important in the context of the total risk play that has recently played out through the past two months. Take a look as how quiet the Silver market has been over the past few months. Take a look at how Silver reacted only moderately to the recent market selloff and Fed statements. There was no real “fear” exhibited in the metals markets or in Silver over the past 60+ days. Yet, today, there is some real fear that is playing out in the price of Silver.
This next Weekly Silver chart helps us to understand the total scope of this move and what we could expect to see as an immediate upside price target. Our Adaptive Fibonacci Price modeling system is suggesting that $16.00 is an immediate upside price target and is showing us the current trend is bullish and that price volatility is increasing. Overall, we could see a move well above $17.00 on an extended run in the metals.
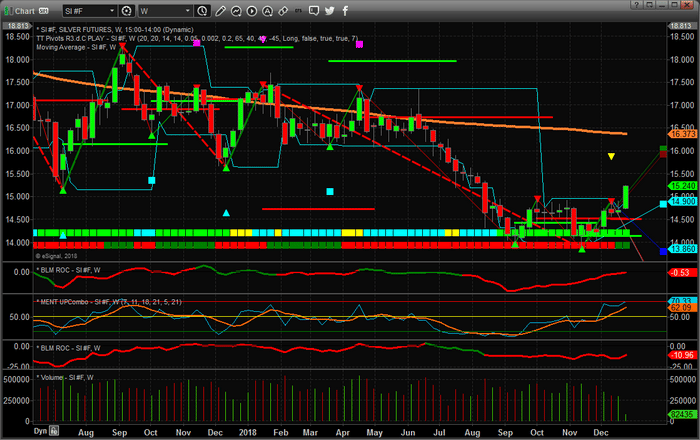
Watch how this “sleeper metal” plays out over the next few weeks and months. This upside breakout is very important to investors for the simple reason that it indicates a renewed level of “fear” is entering the markets and we could be starting a very big upside move in the metals markets again. The last time Silver entered a massive bullish phase it shot up over 400%. If a similar move happens again in the near future, Silver could reach a price level near $60~65 per ounce.
Want to know how to position your investments to take advantage of these types of moves and learn how to capture greater opportunities in the markets? 2019 is setting up to be an incredible year for traders with the skills and insight to find and execute these types of trades. We have already been positioning our members for this move and we believe 2019 will provide incredible opportunities for all skilled traders. Take a minute to visit www.TheTechnicalTraders.com to learn how we can help you in 2019 and join our other members in finding greater success.
Everyone wants to know if this selloff has reached a low or bottom yet and what to expect over the next 30~60+ days. Since October, the US stock market has reacted to the US Fed raising rates above 2.0% with dramatic downward price moves. The latest raise by the US Fed resulted in a very clear price decline in the markets illustrating the fact that investors don’t expect the markets to recover based on the current geopolitical and economic climate.
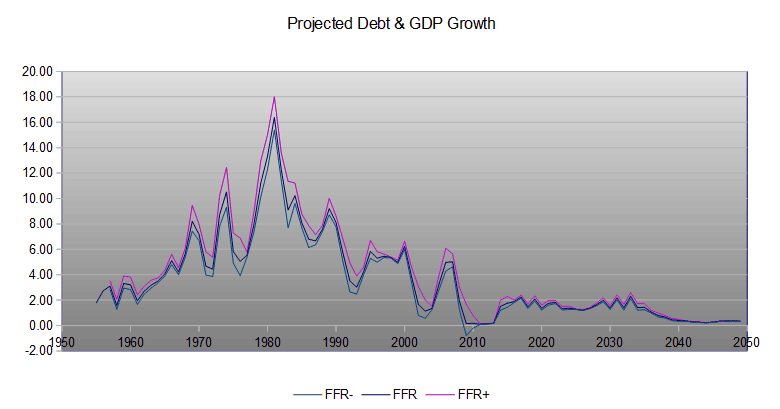
Over 5 years ago, our research team developed a financial modeling system that attempted to model the US Fed Funds Rate optimal levels given certain inputs (US GDP, US Population, US Debt, and others). The effort by our team of researchers was to attempt to identify where and when the US Fed should be adjusting rates and when and where the US Fed would make a mistake. The basic premise of our modeling system is that as long as Fed keeps rates within our model’s optimal output parameters, the US (and presumably global) economy should continue to operate without massive disruption events unless some outside event (think Europe, China or another massive economic collapse) disrupts the ability of the US economy from operating efficiently. We’ve included a screen capture of the current FFR modeling results below.
This model operates on the premise that US debt, population, and GDP will continue to increase at similar levels to 2004~2012. We can see that our model predicted that the US Fed should have begun raising rates in 2013~2014 and continued to push rates above 1.25% before the end of 2015. Then, the US Fed should have raised rates gradually to near 2.0% by 2017~2018 – never breaching the 2.1250% level. Our model expects the US Fed to decrease rates to near 1.4~1.5% in early 2019 and for rates to rotate between 1.25%~2.0% between now and 2020. Eventually, after 2021, our model expects the US Fed to begin to normalize rates near 1.5~1.75% for an extended period of time.
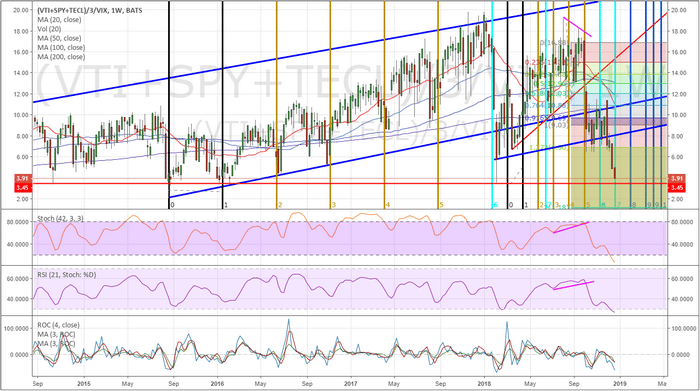
Additionally, our Custom Market Cap index has reached a very low level (historically extremely low) and is likely to result in a major price bottom formation or, at least, a pause in this downward price move that may result in some renewed forward optimism going forward. Although we would like to be able to announce that the market has reached a major price bottom and that we are “calling a bottom” in this move, we simply can’t call this as a bottom yet. We have to wait to see if and when the markets confirm a price bottom before we can’t attempt any real call in the markets. You can see from our Custom Market Cap Index that the index level is very near historically low levels (below $4.00 – near the RED line) and that these levels have resulted in major price low points historically. We are expecting the price to pause over the next week or so near these $3.50 levels and attempt to set up a rotational support level before attempting another price swing. As of right now, we believe there is fairly strong opportunity for a price bottom to setup, yet these are still very early indicators of a major price bottom and we can’t actually call a bottom yet. If our Custom Market Cap Index does as it has in the past, then we are very close to a bottom formation in the US markets and traders would be wise to wait for technical confirmation of this bottom before jumping into any aggressive long trades.
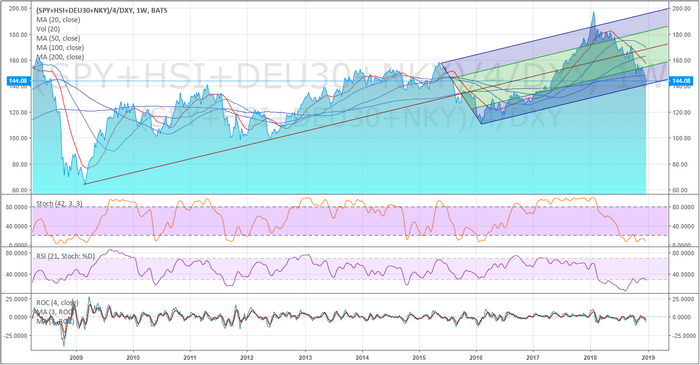
Lastly, our Custom Global Market Cap Index has also reached levels near the lower deviation channel range over the past 7+ years, which adds further confidence that a potential price bottom may be near to forming in the US markets. As we can see from the chart below, the recent selloff has pushed our Global Market Cap Index to very low levels – from near $198 to near $144; a -27.55% total price decline. Nearing these low levels, we should expect the global markets to attempt to find some support and to potentially hammer out a bottom, yet we are still cautious that this downward price move could breach existing support levels and push even further in to bear market territory.
There are early warning signs that the market may be attempting to form a market bottom and our research team is scanning every available tool we have at out disposal to attempt to assist all of our members and followers. We alerted you to this move back on September 17, 2018 with our ADL predictive modeling system call for a -5~8%+ market correction. Little did we know that the US Fed would blow the bottom out of the markets with their push to raise rates above the 2.0% level.
As the US Fed has already breached our Fed Modeling Systems suggested rate levels, the global markets will be attempting to identify key price support in relation to this new pricing pressure and the expectations that debt/credit issues will become more pronounced as rates push higher. In other words, the global markets are attempting to price in the renewed uncertainty that relates to the US Fed pushing rates beyond optimal levels. We expect the markets are close to finding true support near the levels we’ve shown on our Custom Index charts, yet we still need confirmation before we can call it a bottom.
We will continue to update you with our research and analysis as this move plays out and we hope you were able to follow our analysis regarding the Metals, Oil, Energy and other sectors that called many of these massive price swings. We pride ourselves on our analysis and ability to use our proprietary tools to find and execute successful trades for our members. Our ADL predictive price modeling system is still suggesting an upward price move is in the works for the US markets and we are waiting for our “ultimate low price” level to be reached before we expect an upside leg to drive prices higher again. Based on our current research, we may be nearing the point where the markets attempt to hammer out a price bottom – yet time will tell if this is the correct analysis.
Please take a minute to visit www.TheTechnicalTraders.com to learn how we help our members find and execute better trades. Recent swings in the markets have made it much more difficult for average traders to find and execute successful short-term trades. Learn how we can help you find greater success and read some of our recent research posts by visiting www.TheTechnicalTraders.com/FreeResearch/
The ES (S&P e-mini contracts) broke the support level from the February 2018 lows immediately after the US Federal Reserve announced a 25 bp rate hike this week. This breakdown below the February 2018 lows is concerning because it indicates that previous support is not holding and we could be in for further downside price activity.
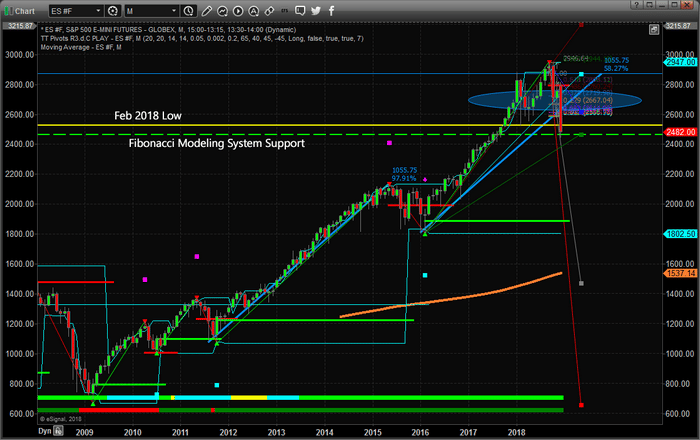
We are preparing a detailed research post for early next week regarding a broad range of US markets as well as how our proprietary price modeling systems are reflecting this recent price move. What we can suggest to all investors is play small positions at the moment and prepare for increased volatility. There is near-term support that may come into play soon, but overall the markets are reacting to a deleveraging event that could see prices push below 2400 before finding true support.
Visit www.TheTechnicalTraders.com to read all of our recent research posts and see what we believe will be the big movers in 2019.
Chris Vermeulen
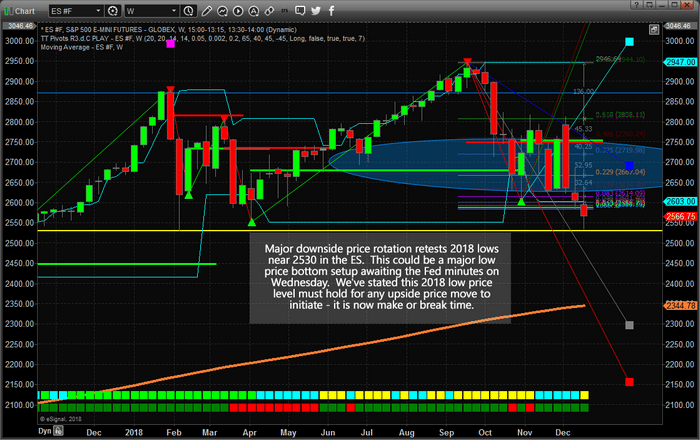
The downside price rotation in the US markets on Monday, December 17, set up a near-perfect double bottom formation near the 2530 price level and also prompted a dramatic price recovery after reaching these lows. Currently, the ES has rallied over 35 pts from this low level and will likely pause before the Fed minutes are announced on Wednesday, December 19.
If the Fed holds true to their earlier promises of continued rate increases, we could see this 2530 level broken as price retreats from any relief rally and attempts to find lower support. If the Fed changes the context of their message and adopts a slower and more insightful rate policy, the markets are poised for one heck of a potential rally. The ES if down by a little more than 400 points (-13.75%) from the peak in September 2018.
We believe the markets have already priced in the expected Fed rate hike and we believe an additional rate hike could become a catalyst for a downside move towards 2300 if the 2530 level is breached. We would like to see the Fed pause, or even decrease rate levels by 25 bp, allowing the markets to parse through the credit/debt issues that have started to plague the global markets before it causes the markets to “turn turtle” and prompt a greater crisis event.
Some of our earlier research, from 2013~2014, was a modeling system dedicated to the Fed interest rates, GDP, Population and Asset Valuations. We modeled various outcomes of the global economy over the future 15 to 20 years including massive debt increases, massive debt decreases, slowing GDP, growing GDP, massive changes in population and asset levels and many others. Overall, our research showed that the 2% Fed Funds Rate level should have been an upper boundary and should have been a near-term target back in 2015~2016. As or right now, the Fed should be decreasing rates to allow for a smooth transition through a “deleveraging process”.
The Fed is behind the curve and is failing to properly navigate the future outcomes of global assets, debt and credit cycles. If the US Fed is not cautious over the next 12+ months with how they manage the FFR, they could push the entire global economy over a cliff faster than they can spell “Powell”.
Everything rests on Wednesday, December 19 and the US Fed at this point. Our predictive modeling systems are still suggesting we should see strong upside price activity throughout the end of this year and early next year – assuming the Fed does not pull the floor out from under this market and capsize the global credit markets again.
Learn how we can help you find and execute trades for better success. Our analysis has been well ahead of these market moves for months and we’ve nailed some incredible trades. Visit www.TheTechnicalTraders.com to learn more.
Chris Vermeulen
Just about seven days ago we alerted all of our followers to a massive breakdown move that was about to unfold in Natural Gas. At that time, we predicted the price of Natural Gas would break below $4.30 and fall quickly towards the $3.00~3.20 level. Taking a look at that call now, with the price below $3.60, it seems our analysis was perfectly timed.
This Daily Natural Gas chart highlighting our predictive Fibonacci price modeling system shows the downside price targets that are waiting to confirm price support and a potential “deep V bottom formation”. If you recall from our earlier research, we believe this downside move will end rather quickly with a deep V type of price bottom setting up near the end of 2018. This means we expect the price of Natural Gas to begin to rally into 2019 after reaching the $3.00~3.20 level soon.
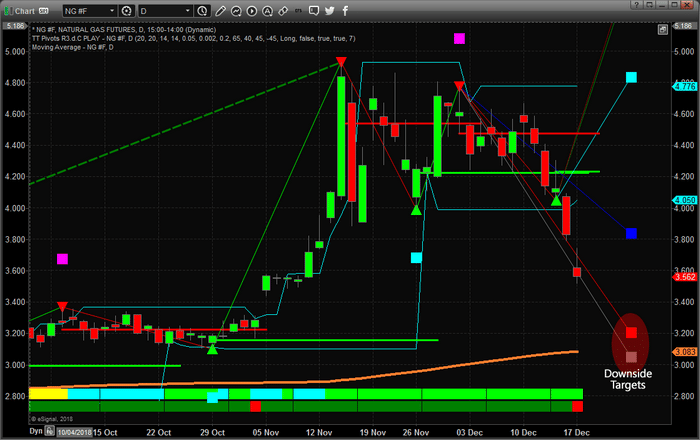
This is an incredible move for skilled traders. We are watching a $2.50 price move in Natural Gas unfold right before our eyes – and it appears this rotation will complete before the end of February 2019. -$1.40 to the downside, then +1.20 to the upside. Just follow the predictive modeling systems and ride it out.
We’ll alert you when the bottom sets up and when the upside move it about to unfold, but for now, we are watching for NG to move into the support zone (near $3.20). Once that level is reached, a technical price bottom should start to set up and the new rally back towards $4.00 will likely start in early January 2019.
Want to learn how our advanced price modeling tools can make calls like this weeks and months in advance? Visit www.TheTechnicalTraders.com to learn about our research, services, daily videos, and more solutions to help skilled traders stay ahead of these market moves. Our advanced predictive modeling solutions and years of market research provide our members with a clear advantage you won’t find anywhere else. Consider joining our services as a Christmas Gift to yourself!
Chris Vermeulen
Technical Traders Ltd.