
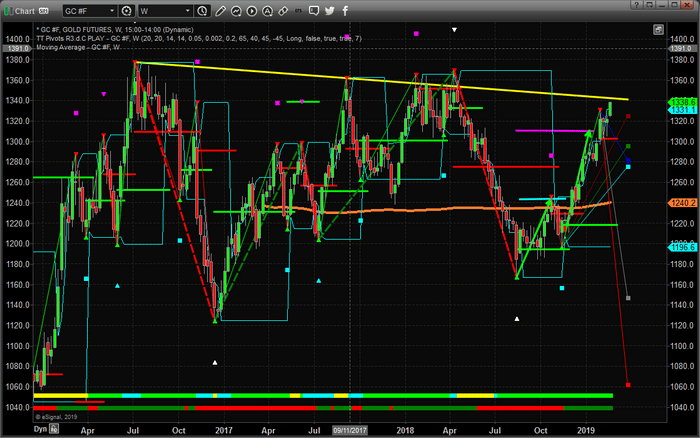
Our research has indicated that precious metals should be setting up for a period of rotation and sideways trading over the next 20~30 days. We issued a research post on January 28, 2019 warning that precious metals would be consolidated over a 30~45 day period before setting up for a massive upside price move, here. This research was based on our Adaptive Dynamic Learning price modeling system and from our Adaptive Learning Cycles system. We believe this research is still very valid and want to alert metals traders that resistance in GOLD can be easily identified near $1340.
The Weekly gold chart, below, highlights the resistance channel that originates in 2016 and continues with multiple peaks in 2017, 2018 and now. We believe this resistance will act as a price ceiling over the next few weeks before metals prices attempt an upside breakout as we suggested in our January 28 research post.
Pay attention to the Fibonacci downside projected price targets near $1270~1295. These levels are very likely to be retested if the current resistance level holds. In other words, gold prices rotate back to below $1300 on moderate price rotation over the next 30 days before attempting to break resistance and move higher. Be prepared for a potential “washout high” price pattern setting up early this week.
We are still actively seeking a deeper price rotation/retracement in Gold/Silver before we initiate any new trades. We believe the upside pricing pressure has reached a level that will prompt a move back to below $1300 on healthy price rotation. If we are wrong, we will know soon enough. If we are right, then the momentum rally setup that will occur near or below $1300 will be a great trading opportunity for all investors. Follow our research to stay informed of this future price movement.
We believe 2019 and 2020 will be incredible years for skilled traders and we are executing at the highest level we can to assist our members. In fact, we are about to launch our newest technology solution to better assist our members in creating future success. Visit www.TheTechnicalTraders.com to learn more.
Chris Vermeulen
Technical Traders Ltd.
www.TheTechnicalTraders.com
The one interesting facet of the various research posts our team continues to digest is the continued bearish sentiment that exudes from some analysts. It appears these technical gurus have become married to the concept that global economic issues will crash the US stock market in the near future. We have to give them some credit though. We wanted to take a few minutes of your time to try to highlight how and why we believe these technical gurus are making these points so clearly now and why we believe there are multiple catalysts that they are simply failing to comprehend.
Our team of researchers continues to learn from other skilled researchers, clients, and technicians. Every time we read some news item or someone’s research post, we don’t take the research with a pretense that “these researchers are wrong in their conclusions”. We start off with the pretense that “maybe these people are highlighting something we missed – let’s investigate it”. Thus, our quest is never-ending in the search for greater knowledge and practical application of price theory and technical analysis.
Our recent article highlighting the Expanding Wedge price pattern that is currently setting up in the US stock markets shows what we believe will be the likely outcome for the near-term future – the formation of a Pennant/Flag formation followed by an upside breakout move higher. Although we believe this is the most likely outcome, traders still need to be optimistically cautious going forward.
Tools like MACD and RSI are great for making points on charts. These technical indicators can show historically valid triggers and generate a sense of panic if presented in a certain context. Here is an example.
RSI Peaking! History has shown that when RSI peaks above 80, the markets typically correct by at least 8%. Look out below! Look at the right side of this chart, RSI is currently at the highest level since November 2014 and we can see the markets rotated downward by at least 5% shortly after this peak.

Yet, what really happened after this peak is shown in the chart below. We’ve highlighted the RSI PEAK date with a light blue vertical line. See how the markets shot up over 30% after this PEAK/SELL Signal?

The point behind this example and this entire article are that almost anything can be used to make a strategic point if placed in the proper context. We want to learn to read not only the critical points of interest but also the entire scope of the global markets and how the dynamics within these markets are playing out.
Within this multi-part research article, we will attempt to stress three key facets of global market analysis that we feel is critical to the understanding of the future market moves.
_ First, the past 10+ years has resulted in a critical shift from traditional market theory. Prior to 2006~07, the US Federal Reserve continued to operate under the premise of Keynesian Economic Theory (a reference to these points can be found here: https://www.britannica.com/topic/Keynesian-economics).
_ Second, global central banks and the US Federal Reserve had very few functional tools to address global inflation and monetary concerns over the years spanning 1970 to 2006 in terms of credit creation, globalization, capital market influences, and geopolitical shifts.
_ The current market conditions are about to change all traditional means of thinking if we are correct.
Let’s start by reviewing how things have changed over the past 50+ years and why this is important for all investors to understand. First, we’ll take a look at how global trade and globalized manufacturing has changed how the world operates.
Prior to 1970, the foreign markets were not as heavily traded and it was not easy or efficient for US investors to move capital into foreign asset classes without a very high degree of risk. US investors typically invested in US stocks, bonds, assets and more. They didn’t venture very far outside the US borders unless they possibly wanted to buy real estate in another country.
At the same time, the capital was somewhat isolated and regionalized into localized economies. Yes, the US Dollar had made its way all across the globe by the 1970s, but retail investors typically conducted business in local currencies and with local buyers. The globe was not as inter-connected then as it is now. Everything started to change in the 1980s though and the boom cycle of the Internet (the last 1990s) took all of us to a completely different level.
Once the technology boom cycle started and US companies started outsourcing manufacturing, engineering, software development, resources, culture and opportunity, the role of the central banks changed dramatically. With globalization, the central banks were not simply supporting a localized economy, they were now supporting a globalized economy and had little control over what we call “the bleed our effect”. When we add the September 11, 2001 attack in New York City and the subsequent wars and global destabilization that resulted from continued geopolitical turmoil – what should one expect the result of this outcome to be on the global economy?
Take a look at these images to see how thing changed from the 1970s through 2009.

(Source: Graphsnstuff.com)
If you can read these tiny charts of how industrial and manufacturing globalization has expanded over the past 50 years, you will quickly understand how capital and economic advancement has also followed this expansion. Throughout the last 50+ years, continued global expansion of technology, resources, industrialization, and manufacturing has created immense opportunity throughout the planet for billions of people and continues to do so. The question we need to focus on is “is the current global market in any way similar to the markets of 30+ years ago?”
What would it take to replicate a market crash that occurred in 1929 or 2009 at this point? Sure, 2009 is a recent example of a global credit market crisis that was the result of many decades of policy and expansion in the making. Yet, at this time, what would it take to replicate this type of market crash and what would the process of this crash originate from?
In the next part of this article, we’ll continue to focus on aspects of the global economy that we believe support our longer-term global market analysis and continue to explore the total scope of the global markets instead of singularly focusing on single points of interest.
If you want to join a group of professional traders, researchers, and friends, then visit www.TheTechnicalTraders.com to learn how we can help you find and execute better trades. Take a look at some of our recent winners to see how we help people, just like you, create success. We believe 2019 and 2020 will be incredible years for skilled traders and we are executing at the highest level we can to assist our members. In fact, we are about to launch our newest technology solution to better assist our members in creating future success. Isn’t it time you invested in your future success by joining a team of professionals dedicated to giving you an advantage in the markets every day?
Chris Vermeulen
Technical Traders Ltd.
www.TheTechnicalTraders.com
Get ready for one of the most complicated price pattern setups we’ve seen in 4~5 years. Within this multi-part article, we’re highlighting many aspects of our predictive modeling solutions, as well as some very clear patterns that we believe, are tell-all investors to prepare for the next big move. This is the second part of our research, please take a minute to read PART I of this article.
Now for the fun part, lots of charts and a few new predictions…
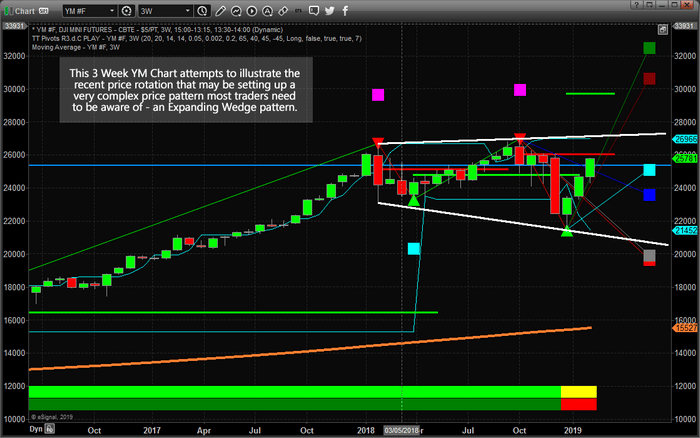
Recently, the YM (the Dow Futures Contracts) have begun an upside price breakout that we believe is setting up for an incredible price pattern. We’ve been suggesting that capital will focus on certain sectors over the past few months (Finance, Technology, Blue-Chips, and Mid-Caps). We believe the safety provided by these US stocks have become a critical component for many global investors. Thus, we believe the YM, Transports, and sector analysis are critical for skilled traders.
In order to highlight the price pattern that we believe will continue to set up in the YM, we’ve created a series of the chart to build upon the foundation of this pattern as well as to highlight the eventual outcome of this pattern (based on our current research and predictive modeling tools).
This first chart is a 3 Week YM Chart (where each bar represents a total of 3 weeks). We are attempting to highlight the Expanding Wedge formation that originates near the highs of 2018 and through the early 2018 rotation. It continues to expand through the most recent price rotation near the end of 2018 as well. Our research suggests we are nearing the final leg of this Expanding Wedge formation and we believe this final leg will setup in a very unique pattern that allows skilled traders the opportunity to identify multiple trade entry points. Let’s continue.
Our research team believes a complex multiple price pattern setup is in the process of forming where, ultimately, a final Pennant/Flag formation will end the complex Wedge formation – setting up a multiple opportunities for skilled traders. The example below highlights an example of the 2015~2019 market price action. We’ve simplified this by manually drawing this image to eliminate the moderate price rotations which can often be confusing for some traders. The intent of this drawing is to show you how and why this pattern is important.
This next Weekly NQ chart shows a bigger picture of the pattern setup. In the first part of this image (roughly 2015/2016), we can see a downward price channel/wedge that sets up. Near the end of this price channel, price sets up a “higher low” which is actually a type of Flag/Pennant formation setup. This “higher low” pattern is unique and important. Remember our Fibonacci price theory from the first part of this article?
Price must ALWAYS attempt to establish new price highs or new price lows AT ALL TIMES. Well, this FAILURE to establish a new price low means only one thing.. it MUST, then, attempt to establish a new price high. The subsequent upside price breakout (a result of a US presidential election cycle as well a renewed optimism) prompted a massive upside price rally in 2017 and created the current Sideways Expanding Wedge formation in early 2018.

The current Wedge formation in this example is a close proximity of the current price rotation in the US markets (you’ll see similarities in some additional chart, below). The important aspect of this current Expanding Wedge is that we continue to expect the Fibonacci “Failed Low” price rotation before the true upside breakout run happens. In other words, we are currently in an upside price rally that is attempting to find/isolate the second peak of the Pennant/Flag formation (Green Below) – where it shows “We Are Here”.
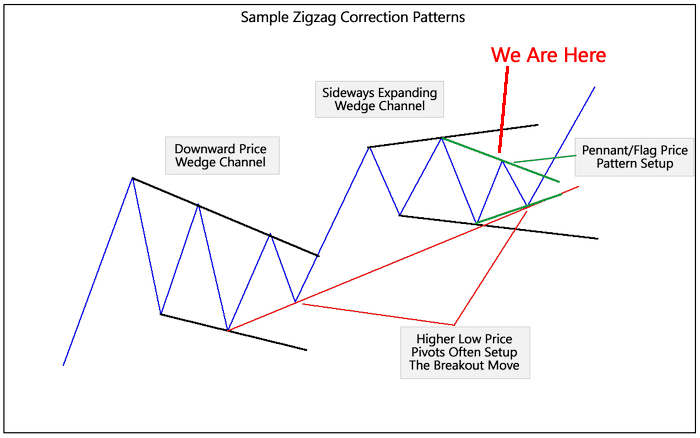
Because of this setup, we are continuing to expect price rotation in the near future that will be very healthy for the overall markets. As we’ve tried to highlight, one of the most critical components of Fibonacci price theory is that “price MUST rotate” while attempting to establish new price highs or new price lows. Price rotation is a very healthy component of any overall trending and price rotation must occur in order for price to continue trending. Thus, what we believe will be the setup pattern in the markets is a Pennant/Flag formation near the end of this Expanding Wedge formation. We believe this Pennant/Flag formation is currently attempting to identify the “second peak” and we believe the next downside price rotation could be in the range of -4% to -5.5% from current highs.
This last chart highlights a longer-term perspective of our analysis and attempts to highlight the range and expectation of the future Pennant/Flag formation. We’ve drawn this Pennant/Flag formation in MAGENTA (pink) and highlighted the individual price waves of in RED and GREEN. We’ve also highlighted the Expanding Wedge formation in WHITE.
The range of this recent rotation is much larger than the 2015/2016 price rotation. The breakout move (early 2017 through early 2018) resulted in a +55% upside rally in the YM. Could a new breakout move result in another massive upside move in the YM? If so, how big could this move be? Well, take a look at the projected Fibonacci Price Target Levels on this chart. From the December 2018 lows, these Fibonacci projected price targets represent a +35% (29,940) to +51% (32,500) upside move.
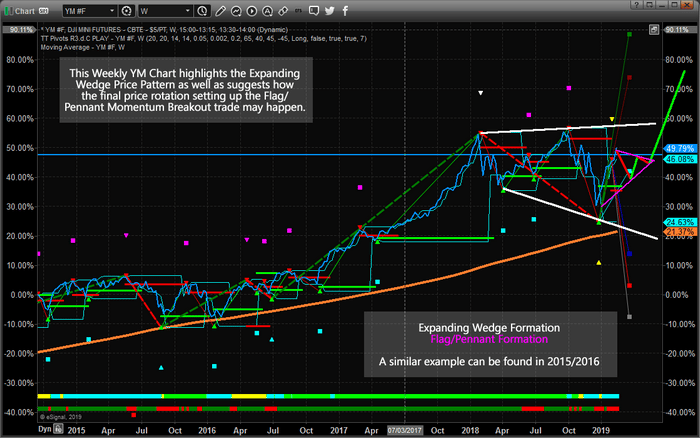
From current YM levels, these targets reflect a +16% to +26%. These are HUGE upside moves.
So, our conclusion is for traders to understand this setup is likely to continue forming over the next 30~45 days and we are expecting a 4~5.5% downside price rotation sometime in the near future. This move will setup the beginning of the Pennant/Flag formation and begin the final setup for the breakout move. It is within this Pennant/Flag formation that we suggest skilled traders begin to position their portfolios for the upside breakout that should eventually result in incredible opportunities. Remember to protect your trade effectively. The Apex of the Pennant/Flag formation may include a “false rotation/breakout” price move. This is when price would attempt to break to the downside, then stall (quickly), then reverse back to the upside and “wash out” a bunch of stops in the process. So be prepared for this move.
Take a look at some of our recent winners to see how we help people, just like you, create success like GDXJ 10.5%, and 18% with ROKU. We believe 2019 and 2020 will be incredible years for skilled traders and we are executing at the highest level we can to assist our members. In fact, we are about to launch our newest technology solution to better assist members and ourselves to create amazing future success. Become a member of our Wealth Trading Newsletter now and get ready for an incredible couple years of trading and investing.
Chris Vermeulen
www.TheTechnicalTraders.com
An odd thing happened at the beginning of 2019 for the markets – price levels across almost all sectors were deeply depressed as a result of the October through December 2018 price correction. We’re noticing that almost all sectors of the SP500 were relatively deeply depressed just before Christmas 2018 and the recent price rally has set up an interesting psychological phenomenon – a self-propelling bullish mantra for US Stocks.
Yes, 2018 ended with a drop – almost a CRASH. Yet, 2019 is starting off on a terror rally that is beginning to lay the grounds for a very dramatic Q1 and possibly Q2 recovery for many in the managed and passive funds. Remember the news in early January 2019? Hedge funds losing 12~22% or more for the 2018 end of year returns? Remember the feeling that these firms just couldn’t find any means of success when almost the entire 2018 year was mired in deep price rotations and sideways trading?
So far, 2019 is starting out vastly different but I have to wonder if the mega players/market movers of the world planned for a very week 2018. Maybe the big plan here is to make the first half of 2019 looks incredibly strong like the bull market is still in full force to convince new money to enter while they secretly unload shares before the bear market takes hold?
If you follow our research, you’ll recall our September 17, 2018 market prediction that an “Ultimate Low” would setup after the US November 2018 elections prompting an incredible upside price rally. You can read out exact wording here. We followed that article with an Elections Cycle research article showing how US election cycles tend to create FEAR in the markets, read it here.
Lastly, we followed up these research pieces with our Global Market research suggesting that perceptions are changing across the planet in terms of what is an acceptable risk and where capital will likely flow in the future. If you have not read this yet be sure to do so.
We believe the psychological results of the US markets pushing very strong Q1 and Q2 returns from a very deep price origination point could drive this global capital shift to target the US markets much more quickly than we expected. If the US markets continue to push higher with fairly narrow volatility going forward, we believe global capital will rush into the US market and undervalued technology, healthcare, basic materials and other sectors chasing the opportunity for the +5 to +8% returns on the back of a potentially strong US Dollar. It may seem odd that this type of capital shift could even take place right now, but we believe this renewed boost of foreign capital into the US stock markets has already started and will play a big roll in a final run higher in the overall US equities market for a few months.
This Weekly NQ chart shows our Predictive Fibonacci price modeling system and suggests that volatility has already begun to narrow. You can see the CYAN “Immediate Upside Target” level that is our current price target and the first level where resistance may be found. Beyond that level, we enter the upward sloping YELLOW price channel from 2018 that suggests price may attempt a rally up towards the $8400 level. You can also see our Fibonacci Projected Targets labeled “Ultimate Upside Projected Targets”. These levels are created by an adaptive learning price modeling system where volatility, price range, price rotation, and an active learning Fibonacci modeling tool are suggesting “could be” the ultimate upside objectives. Imagine the NQ starting 2019 near $6400 and ending it near $9200 (+43%) or $9600 (+50%) for the year?? It would be incredible and it is a possibility.
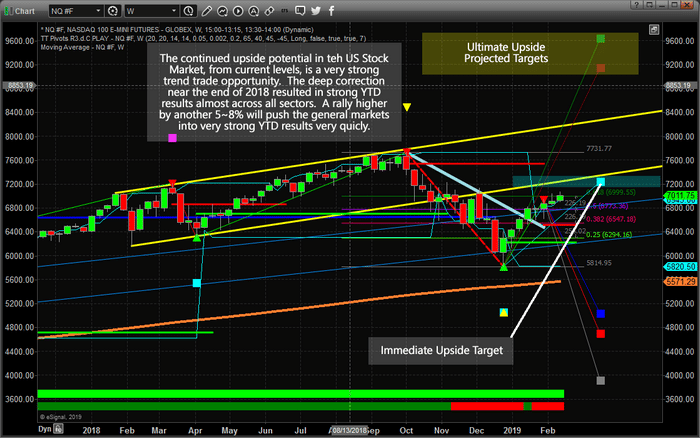
The reality is, it does not matter what the markets do, go up or down from there. Technical analysis will keep the odds in our favor for us to follow the market closely and generate strong annual gains. No one truly knows which way the markets are headed next. Personally, I feel stocks will struggle to make new highs before rolling over to start a bear market, but our ADL adaptive statical system says we should be prepared of the possibility of a 50% rally.
So who/what is correct? It does not matter, either way, we will make money, but I a bear market does start then long-term investments will need to be moved to cash or inverse investments at that time.
Take a minute to consider how the global markets will react to uncertainty and rotation while remembering that the US stock market and economy are very unique from the rest of the world. The US economy seems to operate beyond the limitations of many other foreign markets and could turn into a safe-harbor for global capital throughout the next 2~5+ years. Time will tell.
Please take a minute to visit www.TheTechnicalTraders.com to learn how we can help you find and execute better trade in 2019 and stay ahead of these market moves.
Chris Vermeulen
www.TheTechnicalTraders.com
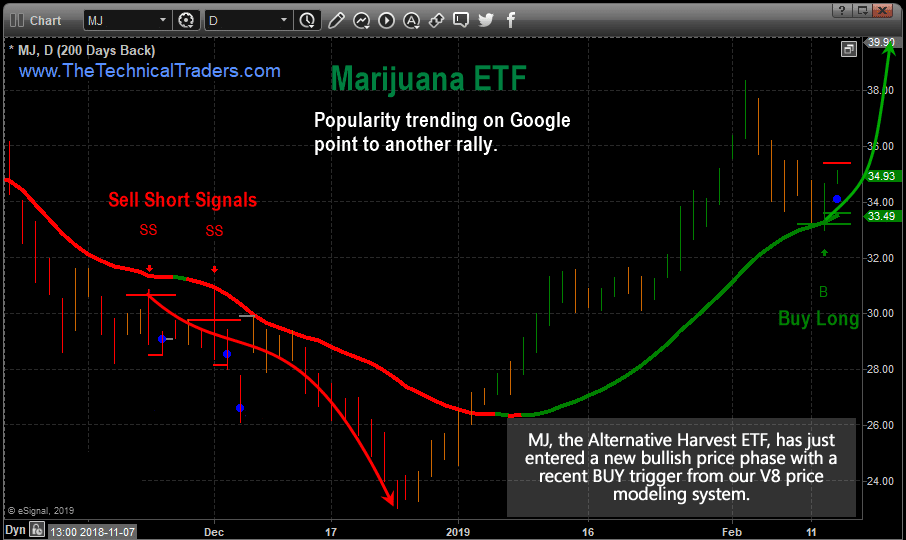
Our research team has been actively discussing the potential that the entire Marijuana stock sector could be setting up for another upside price rally. Since the bottom set up in the US stock market near December 24, 2018, many of the cannabis-related stocks and ETFs have seen incredible upside recoveries (of 25% or more). We believe the current setup in MJ, the Alternative Harvest ETF, is indicative of a new bullish momentum breakout.
The upside potential for this move is likely 12~25% or more over a short span of time. Watching MJ move from $34 to $39 over the next few weeks could result in a 14%+ move where a breakout of $39 to the upside could see MJ retesting recent highs near $45 (a +32% upside move).
One aspect of this market sector to consider is the recent talk of nationalizing legal US cannabis in the US as well as the expected gains in state sales from legalizing the industry. We’ve all read about how some of the largest drink and tobacco producers in the world are investing heavily into this blossoming sector in preparation to secure market share when the dust settles. The entire Marijuana market sector could be a boom cycle, similar to Cryptos in 2016~2017, over the next 12~24+ months in the USA. Canada recently legalized its use which could help open the door for other territories to make it legal.
MJ has room to run to the upside and our initial projected targets for this upside move are just below $38. If our longer-term analysis is correct and the US major stock market indexes continue to rally, we believe MJ could attempt to retest recent highs near $45 over the next 30~60+ days.
These types of opportunities don’t happen very often. Fledgling industries with strong interest drive investors to make speculative plays while driving prices higher and higher in most cases. Play this one smart and look to take profits above +8% on no less than half of your initial trade, then let the rest of your position ride out the run. If we are correct in our targets, $41~44 should be the next upside target before resistance is found.
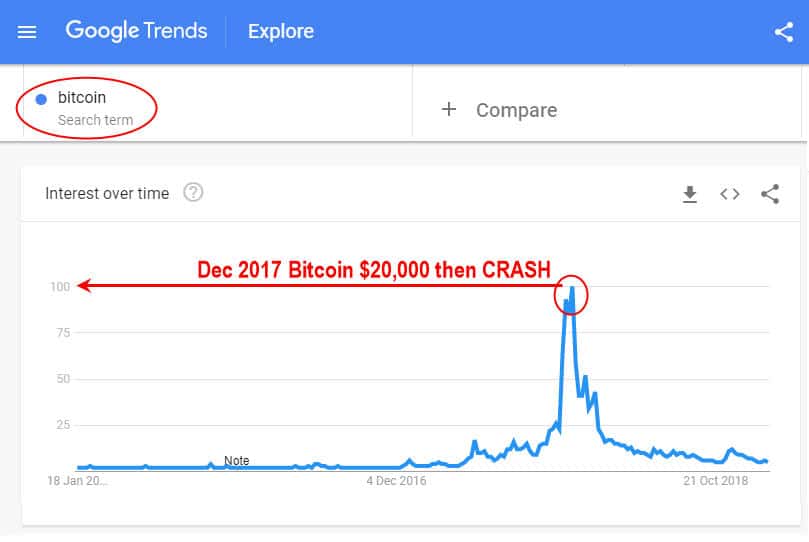
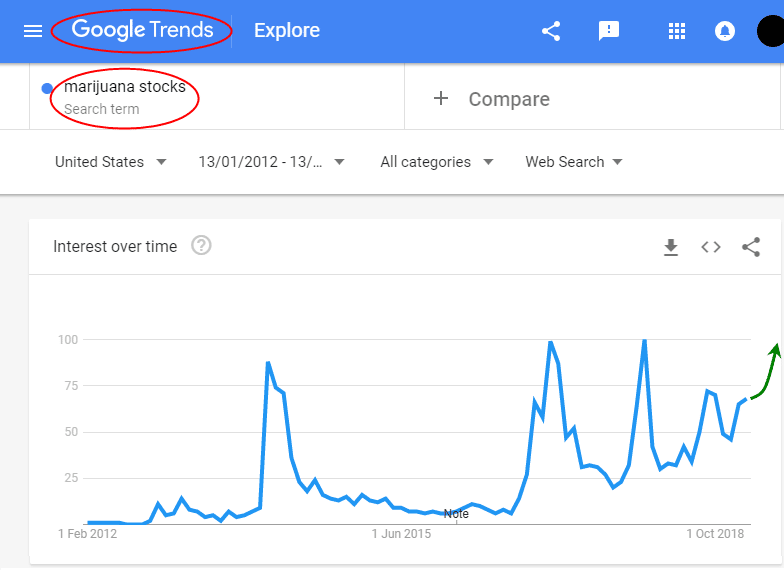
Another interesting way to look for interest in any sector is to look at the Google Trends for the search term popularity for a particular asset class or similar related phrases and Bitcoin is the perfect example.
Marijuana Stocks Searches
As you can see in the graph below Google trends is shows a steady increase of interest for “Marijuana Stocks” stocks.
We should warn you that this is also a capitulation and contrarian indicator once it breaks the 80-100 level. When search demand spikes and everyone is interested in these stocks that is when they top. So, we do expect a run-up in price, but after that price could go up in smoke as this is somewhat of a bong bubble in the asset class.
 If you want to join a group of professional traders, researchers, and friends, then visit www.TheTechnicalTraders.com to learn how we can help you find and execute better trades. Some of our recent winners are GDXJ 10.5%, ROKU 8.1%, two other open positions with 15.4%, and 4% as we wait for new a couple high momentum trades to mature.
We believe 2019 and 2020 will be incredible years for skilled traders and we are executing at the highest level we can to assist our member’s profit from our trades with us. In fact, we are about to launch our newest trading solution for ourselves and members that is unparalleled anywhere else.
Chris Vermeulen
Technical Traders Ltd.
Chris Vermeulen is first and foremost a technical trader. Fundamentals hold little interest to him, probably because he can’t make money off of them. He sees a big potential rally coming in gold, after one last round of weakness. He thinks it could be a considerable decline, which he welcomes, as it would provide confirmation to his theory. His other big play is NatGas – a/k/a the Widowmaker – as it a 2.55 low, a point from which it quite often rallies. As I said on the show, I would never bet against Chris, because he’s right so often.
 Click Here to Listen to the Audio
GET CHRIS’ TRADES – CLICK HERE
Our research team has warned that the precious metals market would enter a 30~45 day rotational price trend on January 28, 2019. On January 16, 2019, we suggested that the upside price move in the US stock market had reached initial upside target zones and suggested that price pullback would be healthy near these levels. Today, we are warning that the markets are poised for a momentum breakout move that is setting up after the minor pullback in most US stock sectors the past week.
There are a number of news factors which support both or our analysis of the precious metals market and result in a failure of our analysis of the US stock market. First, the opportunity for the US government to agree to and pass a funding bill that removes uncertainty for many months. If the US government is able to pass a longer-term funding bill that eliminates pricing pressures and fears in the markets, the US stock market could breakout to the upside on a new momentum move very quickly. Second, if the US/China trade issues are resolved, in any substantial form, and trade begins to normalize over the next 6+ months, this could add even more fuel to the upside of the market and create a boost of momentum for almost all sectors.
The big question remains, which side of the fence will this news fall into and what will the likely outcome be in the US Stock market?
We continue to believe a massive capital shift is taking place throughout the globe. Investors and traders are continually seeking safety and returns for their capital. Even the emerging markets present a unique opportunity right now, they also present a high degree of risk. We believe any news related to the US government funding and/or the US-China Trade issues will result in a new momentum rally in the US stock market potentially resulting in a 4~8% upside rally.
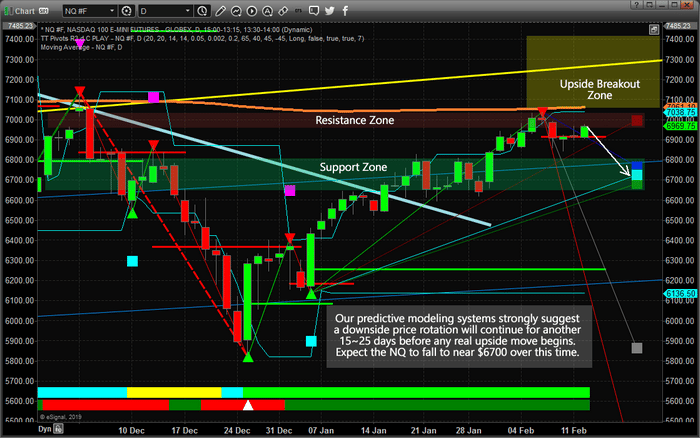
Right now, unless some news solidifies regarding either of this two-news event, we believe a downside price rotation is still in the cards starting next week and could last 15~25 days. Should some news hit the wires that alleviates the uncertainty and concerns, then the downside expectations we have may be muted or failed expectations.
Take a look at this Daily NASDAQ chart with our Adaptive Fibonacci price modeling system. It is easy to see the Fibonacci projected target levels clustering near the $6700 level. It is also easy to see the upside (RED) projected level near $7000. Fibonacci theory teaches us that price is constantly seeking out new highs or new lows. Over the past few days, the price has settled into a range between $6840 and $7038. Given Fibonacci price theory rules, price MUST attempt either a new high or a new low outside this range.
Our research suggests that a new price low is the highest probability outcome at this time (unless news hits to change the environment within the markets). Therefore, we still believe the downside price levels near $6700 are the immediate target levels for the NQ with an “exception” being the “Upside Breakout Zone”. This upside breakout/rally zone qualifies as the opposite condition to our expectations. If news breaks and the market does begin a momentum rally based on this news, then this upside zone will qualify for a Long Entry Zone with a potential for a very quick 2~5% upside potential.
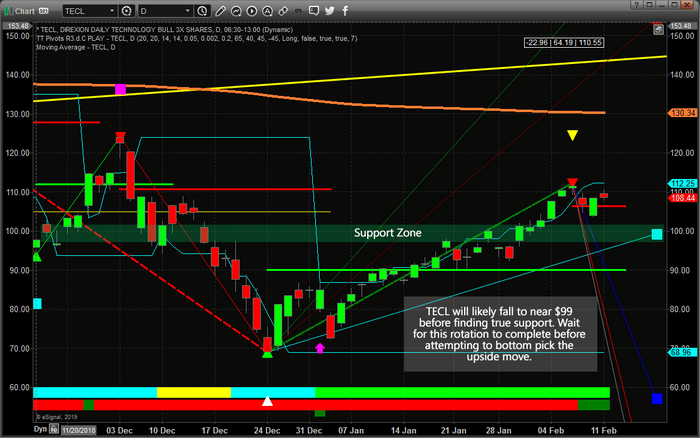
This Daily TECL chart with our Fibonacci price modeling system suggests the same type of outcome. Barring any news events that change the investing environment, there is a strong potential for price to rotate lower towards the $99 level. Remember, price rotation is very healthy and essential. If we think about the primary rule of Fibonacci price theory, the price must always attempt to seek out new price highs or new price lows, it makes sense that price will trend while creating rotational zones. Thus, a move to $99 would qualify as a new price low (breaking more recent low-price levels) and rotation back to the upside would qualify as a price direction change where new price highs will be attempted.
The one thing we have to remember as we are navigating this 15~25 expected rotational price range is that external news events can have dramatic results in the markets. Our research team continues to scan news sources for sentiment and other market conditions. Gold fans are expecting prices to rally above $1320 very quickly. Most equity traders are very concerned about the current price rotation in the US stock market and the massive range that has setup. Very few people have any real understanding of the future direction of these markets – everyone seems to be waiting for the next move.
We believe 2019 and 2020 will be incredible years for skilled traders and we are executing at the highest level we can to assist our member’s profit from our trades with us. In fact, we are about to launch our newest technology solution for our members that is unparalleled anywhere else.
We’ve recently shown you what our predictive modeling systems believe is the likely outcome for the SP500 and NASAQ over the next few months and we are waiting for the proper “setup” to reposition our members for the next move. If you want to join a group or professional traders, researchers and friends, then visit www.TheTechnicalTraders.com to learn how we can help you find and execute better trades. We recently close GDXJ for a 10.5% profit, ROKU 8.1%, and are currently up another 9% and 14.6% on two other positions.
Chris Vermeulen
Technical Traders Ltd.
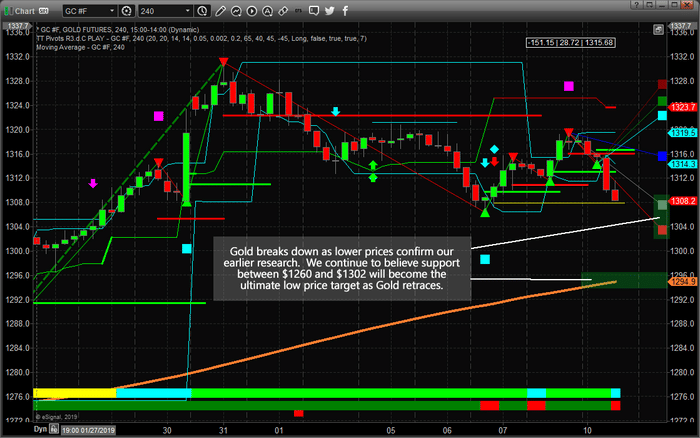
On January 28, 2019, our research team issued a research post indicating we believed that Precious Metals would rotate lower over the next 45+ days in preparation for a momentum base/breakout that would initiate sometime near the end of April or early May. Recent price weakness in Gold has begun to confirm our analysis and we believe this price weakness will continue for the next 2~4 weeks while traders identify a price bottom and hammer out a momentum base/support level.
Gold is currently down another -1% this week and testing the $1307 level after rotating back to near $1320. Our analysis continues to suggest price weakness in the Precious Metals markets going forward for at least 2~3 more weeks. We are expecting the price of Gold to fall below $1290 and ultimately, potentially, test the $1260 level where we believe true support will be found.
If you’ve been following our analysis, you were alerted the day of when we signaled the top as it formed near $1330 and to close out our GDXJ position for a quick 10.5% profit as we had been preparing for this top and rotation for a couple weeks.
This 240-minute Gold chart highlights our Adaptive Fibonacci price modeling system and suggests the $1295~1302 could become immediate support for this current downside price move.
Please take a minute to review some of our most recent research by visiting www.TheTechnicalTraders.com/FreeResearch/ and to learn why our team of researchers, software developers, and traders provide insight and knowledge that you just can’t get anywhere else on the planet. The link to our research post, above, highlights our ADL predictive modeling system that is capable of identifying price moves many months in advance. Our most recent US stock market forecast highlights the power and capabilities of our proprietary price modeling tools. As a member of our newsletter, you gain insights, training, daily market videos and many more resources that will help you identify and execute for greater success in 2019.
Chris Vermeulen
Technical Traders Ltd.
As we enter the final stage of our market predictions from nearly 5 months ago, we thought it would be a good time to revisit these predictions and to update all of our followers with some timely and, apparently, accurate market data. We hope that many of you remember out predictions from September 2018 where we called for a 5~8% market decline, followed by a basing market headed into the November 2018 US elections, followed by a deep “Ultimate Low” price rotation before we called for an incredible upside price rally? The reason it is so important to watch for and understand all of our research is that we are attempting to provide great value and insight to our followers as well as help them protect their open positions from unknown risks.
As a bonus to all of this, we are going to include predictions made by our Adaptive Dynamic Learning (ADL) price modeling system that originated from December 2017 going all the way forward through to the end of May 2019. Can you imagine what it would be like to have a tool that could show you what is likely to happen going forward 6 months, 12 months or even 24 months into the future? Well, that is what we have with the ADL predictive price modeling system and we are going to show you how well it has been able to pick the future of the markets for the past 15+ months. Here we go.
At this point, we are going to highlight our earlier predictions (all of 2018 and into Q1/Q2 of 2019) and show you what the market has done since these calls were made back in September 2018. Pay attention to this Weekly ES (S&P 500 chart) and pay attention to the YELLOW ARROWS on this chart. We have highlighted key predictive price modeling points with these yellow arrows on the chart to show you what our ADL predictive modeling system suggested would happen back in December 2017.
If you follow these arrows from left to right, you’ll see how the ADL system predicted an early price breakdown in 2018 – we call this a “Price Anomaly” where price moves against the predicted price targets, then reverts back to near these targets. These can be incredibly profitable trading opportunities for skilled traders as well. That early 2018 breakdown in price was a -318 pt move (-10.95%) and we were alerted to it well before it happened.
The next phase of the ADL price modeling system was to suggest that Q1 and Q2 2018 would settle into an extended basing pattern with a moderate upside price bias. You can see how accurate the timing of this ADL prediction was and how price reacted to this basing phase through June 2018.
The next phase of the ADL price model showed a Q3 price rally/uptrend with a potential upside move of about +210 pts (+8%). The real price move from these points (basing end to top) was +197 pts (+7.19%). The actual price top (another Price Anomaly pattern) happened on September 17/24, 2018.
Pay attention to that last date: September 17, 2018, and read this post from that date. This is the research post that issued our latest warning/predictions that cover the past 5+ months.
You can clearly see that our ADL predictive modeling system was calling for a -5~8% price decline in August, September 2018. Again, this type of early warning feature provided by the ADL also sets up Price Anomaly patterns – when price moves against the ADL predictive modeling system and allows for a reversion trade setup. This is just such an event. As we were aware of the potential for a downside price event, yet price continued to push higher till October 1, 2018. When price did, finally, break lower, we can see how quickly the -5~8% ADL prediction became true. It only took 6 weeks for the price to break downward -326 pts (-11.15%), then begin to base.
This is where things start to get interesting for us and our readers/followers. Our analysis on September 17, 2018, suggested that the US stock markets would base and trade sideways before the November 6, 2018, US elections, then break lower to establish an “Ultimate Low” price pattern. What we didn’t expect was the size and scope of the “Ultimate Low” price rotation that happened in the markets. Our ADL modeling system suggested a -115 pt (-4.45%) downward price rotation was likely. What really happened was the markets collapsed -453 pts (-16.17%).
After the Ultimate Low price setup, the ADL predicted an upside price rally in excess of 400 pts (+17.5%) and what has recently transpired, so far, is an upside price rally of 421 pts (+18.17%).
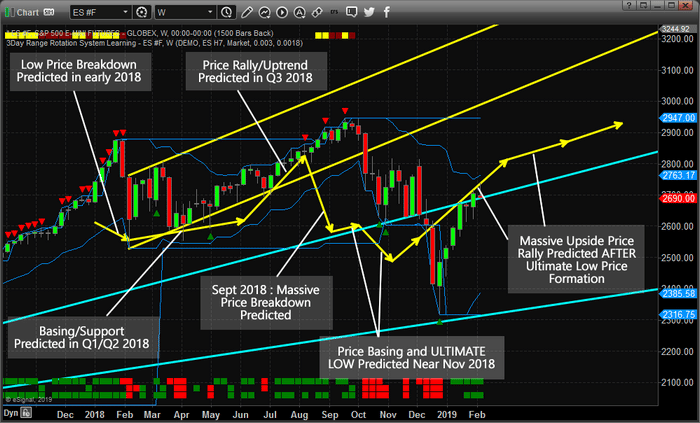
Think about how powerful this predictive price modeling system really is to be able to call this market moves 10~20+ months in advance. Certainly, it is not perfect in every prediction, but the advanced knowledge and resources it provides is has proven to be a powerful tool for insight into future price direction.
What should we expect going forward? Take a look at the yellow lines drawn into the future of this chart. If our ADL price model is correct, then we should continue to see more moderate upside price bias with prices trading a bit more narrowly in a “melt-up” type of environment through the middle/end of June 2018. Want to know what our ADL predictive price model is showing for the rest of the year and into early 2020, then visit www.TheTechnicalTraders.com and learn why our members benefit from our tools and research in far more detail than we deliver in these public posts.
It is not too often that we share this level of research with the general public. We issued the September 2018 research post because we wanted to warn our followers that a massive price decline/rotation was about to unfold. You can read all of our public free research posts. Today, we are sharing with you our ADL predictive price modeling results for the next 3~4 months for the SP500 – how valuable is that? If you save or print this article, you will be able to reference it going forward for the next 90+ days and compare the real price action to our ADL predictive modeling results. We believe the results will be similar to what our ADL is suggesting and we can see these ADL results for any instrument traded throughout the world.
We believe 2019 will be an incredible year for skilled traders and we believe the markets will set up numerous trade setups for fantastic profits. We are already hard at work developing new member tools, research models and algo trading systems to help our members take advantage of these incredible market moves. Please take a minute to see how our researchers and traders at www.TheTechnicalTraders.com can assist you this year. We will be launching an incredible new member tool in about 30~60 days. You won’t want to miss this fantastic new software utility to help you find and execute great trades. See you in the member’s section of our site.
Chris Vermeulen
Technical Traders Ltd.