I just did some research and wrote about it. I should be clear that you may find this article a little unsettling if you are nearing retirement or have already retired. On the other hand, it’s an eye-opener because the financial markets and different asset prices paint an interesting picture.

But, I believe being armed with the proper information like retirement asset revesting knowledge, leads to better outcomes, so I’m sharing this possible scenario that could unfold in the next 3-10 months and last for many years and directly affect our lifestyle.

If you don’t take proper action, you could be exposed to and experience something called the sequence of returns risk, which I will explain in great detail in my soon-to-publish white paper, so be sure to join the free newsletter. So, let’s jump into things!

There is a concept that the US Fed may be pushed into raising rates above nominal inflation rates to stall inflationary trends. Historically, the US Federal Reserve had raised rates aggressively to near or above annual inflation rates before the US economy moved away from inflation trends.

The Potential Scenario As Told By The Charts and History

Suppose US Inflation trends continue to stay elevated throughout the end of 2022 and into early 2023. In that case, the US Fed may continue to raise Fed Funds Rates (FFR) to unimaginable levels more quickly than many traders/investors consider possible. Could you imagine an FFR rate above 6.5%? How about 8.5%?

What would that do to the Mortgage/Housing market? How would consumers react to credit card interest rates above 24% and mortgages above 10%? Do you think this could happen before inflation trends break downward?

The reality is that the markets and future have a way of surprising us and doing what we once thought was not possible. So being open to some of these extreme measures and situations is something we should consider and consider what they could do to our businesses, lifestyles, and retirement.

Historically, this must happen for the US Fed to break the persistent inflationary trends in the US – take a look at this chart.

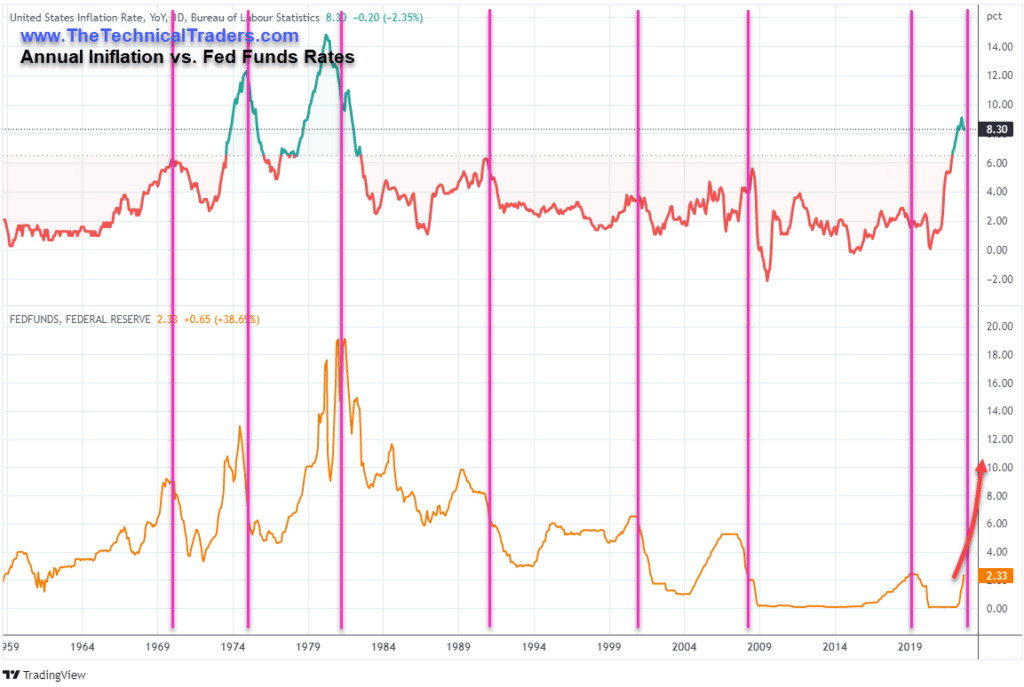
The best-case scenario given the historical example is that Annual Inflation trends move aggressively to the downside by Q1:2023 or earlier. That will allow the US Fed to move away from more aggressive rate increases, which could significantly disrupt US & Global asset markets (pretty much everything).

Suppose Annual Inflation stays above 6~7% throughout the end of 2022 and into early 2023. In that case, I believe it is very likely the US Federal Reserve will be pushed to continue raising rates until a definite downward trend is established in inflation.

Algos, Illiquidity, Derivatives Are Active Culprits

There are two examples showing the US Fed acted ahead of a major downturn in inflation: one in the late 1980s and another in late 2007. Both instances were unique in the sense that the late 1980s presented similar sets of circumstances. Computerized trading, illiquidity, and excessive Derivatives exposure prompted the 1987 Black Monday crash and the 2007-08 Global Financial Crisis. (Source: https://historynewsnetwork.org/article/895)

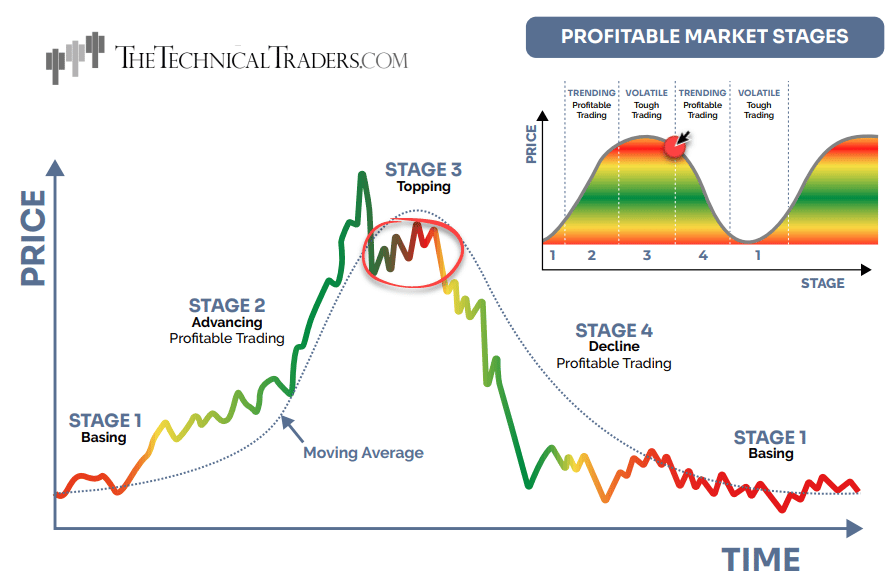
Current Stage 3 Topping Pattern May Turn Into Stage 4 Decline

My research suggests the US markets are fragile given the current Inflationary trends and pending Federal Reserve rate increases. As I told above, the best-case example is to see Inflation levels dramatically decline before the end of Q1:2023. It is almost essential that current inflation levels drop back to 2~3% very quickly if we are going to see any measurable slowdown in Fed rate increases.

Secondly, the continued speculation by traders/investors remains very high, in my opinion. Given the historical example, traders should be pulling capital away from risks very quickly and attempting to wait out any potential Fed rate decisions. Below, I’ve highlighted where I believe we are on the Stock Market Stages chart. This is not the time to become overly aggressive with your retirement account/nest egg.

Many traders and investors are now buying this pullback in stocks, thinking it’s a buy-the-dip type of play. I think things are about to get ugly, and what we have seen thus far in 2022 is just the 12-year bull market ending, but the downtrend has not even started yet.

The time to buy the hottest sectors, like in 2020, will eventually come, and when it does, the Best Asset Now strategy (BAN) can generate explosive growth for traders, but now is not the time.

Proprietary Investor Strategy Confirms Cycle Trends

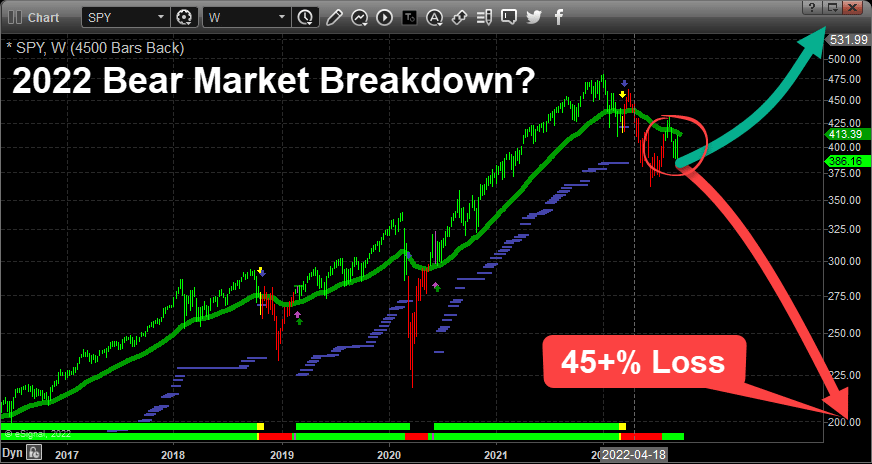
My proprietary Technical Investor strategy (TTI) has moved into GREEN trending bars – aligning very closely with the MAGENTA ARROW on the Stock Market Stages chart above. I’ve drawn both a GREEN & RED arrow on this chart to highlight the potential trending outcomes that likely depend on how quickly Inflation levels drop.

If Annual Inflation levels drop below 3% before we start Q2:2023, then I believe we may see a softer US Fed and more significant potential for a recovery in the US/Global markets over the next 18+ months. 

On the other hand, suppose Annual Inflation levels stay above 6~7% over the next 6+ months. In that case, I believe the US Federal Reserve will attempt to continue to raise rates aggressively – eventually resulting in a “bear market” breakdown event in the US/Global asset markets.

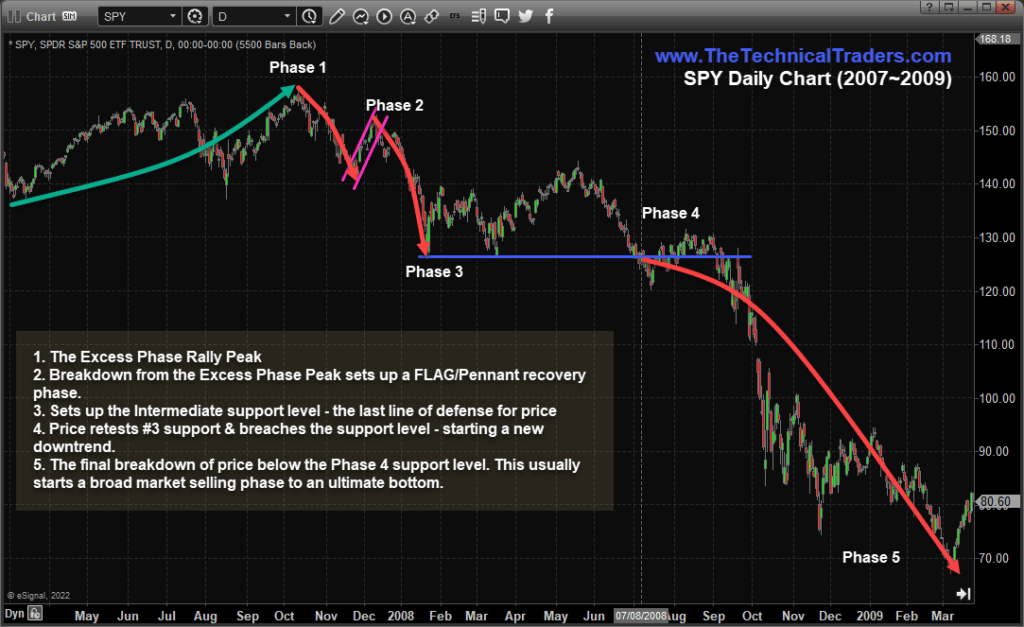
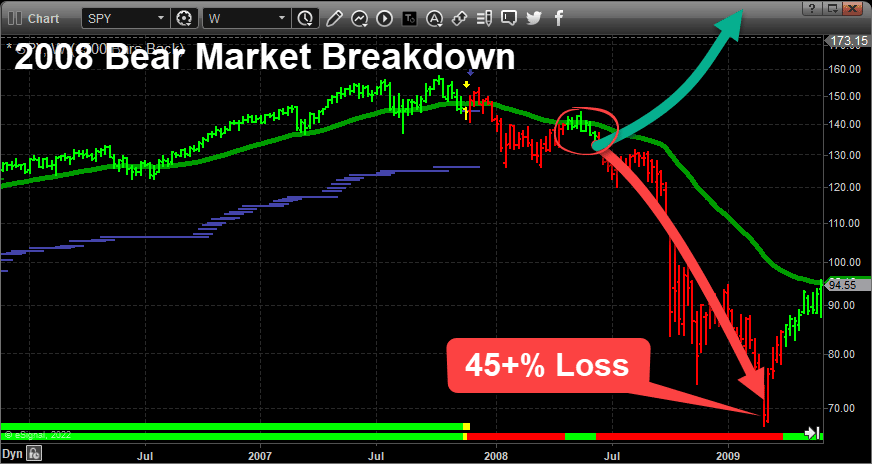
Comparing 2008 Bear Market Breakdown With 2022 Price Action

The last time we experienced a major Inflationary event where the US Federal Reserve was not actively supporting the US economy with QE policies was in 2007-08. This event prompted a -57% decline in the SPY before bottoming out and a -55% decline in the QQQ. Many of you lived through that market collapse and have strong feelings about how destructive that move was for everyone.

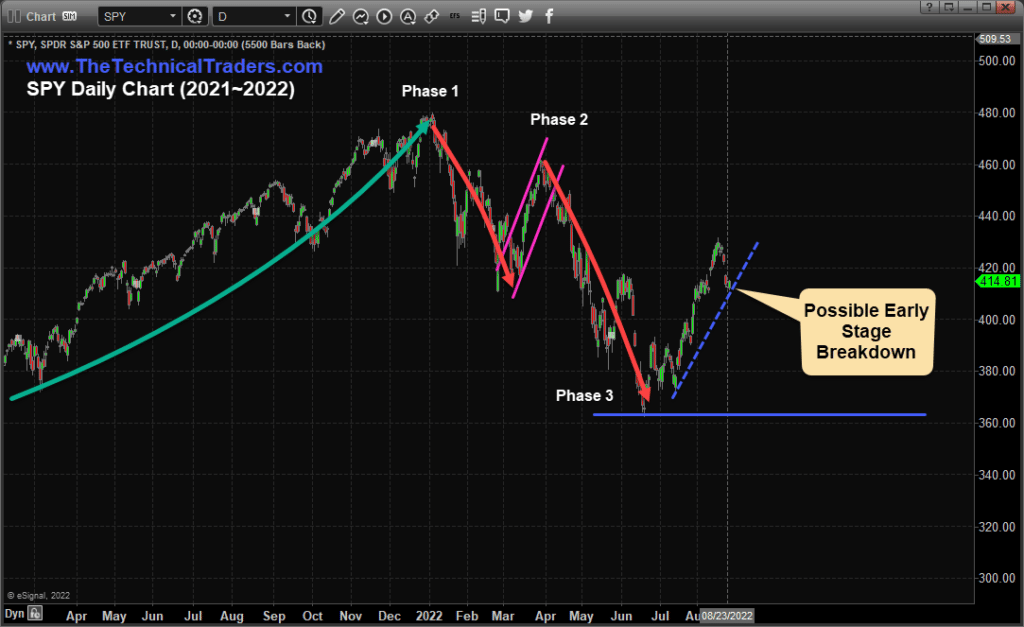
2022 Bear Market Breakdown

This time, after 12+ years of QE, prompting the “Everything Bubble,” – just imagine what could happen if my research is correct. But let me be very here. I am not forecasting, predicting, or saying this will happen. I do things differently when it comes to trading and investing. I only own assets and hold positions that are rising in value. I do this by following price charts and managing risk and positions.

You won’t ever catch me trying to pick a bottom, averaging down into losing positions, and you won’t find me trying to pick a top, either. What you will experience if you follow my work is that I always research and know all the possibilities an asset could move, and I plan to navigate each one safely. Once the price charts confirm a direction, I position my portfolio to profit from the new trend, which can be up or down.

A Tough Year Even for Experienced Investors

This year alone, the S&P 500 is down over 18%, and treasury bond ETF TLT is down 28%. As a result, anyone investor using the buy-and-hold strategy with any mix of stocks/bonds in their portfolio is under tremendous pressure and likely starting to worry about outliving their retirement funds. 

Here is a little background on the market markets for you. First, there have been 26 bear markets since 1929, with an average loss of 35.62 percent and an average duration of 289 days. Mind you, some of those bear markets were only a few months long, while others were multi-year declines, with some taking 5, 12, and even 17 years to return to breakeven. 

But the reality is breaking even with your assets is still a significant loss. After many years of being in a drawdown like that, don’t forget you are paying 0.50% – 2% annual fees from ETFs, mutual funds, and possibly advisor fees. Simple math shows that with a 17-year drawdown spending 1+% year to hold these losing positions, you still have a 17+% loss when assets return to breakeven because of these costs.

I know all this sounds bleak, and rightly so, it is. But there is good news. Market corrections and bear markets can be identified early and safely navigated if you know what to look for and follow the market VS. buy and hope, or try to pick market bottoms and tops.

2022 has been a very tough year to make money from the markets, not because of the market decline but because of the stage 3 phase in which the stock market is currently. It does not know if it wants to find a bottom and rally or roll over and start a steep bear market swan dive.

You can see how my Consistent Growth Strategy (CGS) has preserved our capital during these difficult times.

Concluding Thoughts:

In short, the world and even more so, the financial markets and assets have a habit of applying the maximum pain to investors before reversing direction. In fact, there is a “Max Pain” calculation in the options market to know where the maximum pain/losses will be for the stock market, and it’s crazy scary how the market will reach this price level during options expiry days on many cases.

The bottom line here is that the worst thing that could happen to most investors and capital in the markets now would be a multi-year bear market and drawdown in the markets, which would cripple anyone nearing retirement and everyone already retired. Having your nest egg cut in half will send shockwaves worldwide to the largest group of investors, the baby boomers, and anyone retired. In addition, it will likely create a flood of people looking for jobs to subsidize their retirement and crush many dreams, and that’s just the beginning of potentially a big unraveling of the economy, I think.

Labor rates will fall as millions of individuals look for work, we will be in a recession, and businesses will be laying off millions of employees, making it even harder to get a job. We are already seeing layoffs taking place. Then we could see the real estate market (residential and commercial) starting to fall apart. Things start to get a little depressing beyond that, so I’ll stop here, but you get my gist, I hope.

The average investor is positioned for higher prices with the buy-and-hold strategy. The critical thing I am trying to share with you is what could happen on the downside if things continue to erode and that you should think about how your lifestyle could change in the next 3-10 months if/when this happens and if you think you will be comfortable with your situation. 

Every week I remind investors I work with that now is not the time to expect to make money. Instead, it is about capital preservation. Focus on not losing; growth will naturally come in due time.

If you have any questions, my team and I are here to help you safely navigate both bull markets and bear markets with our CGS Investing Strategy.

Retired Asset Revester turned out to be a perfect strategy for achieving goals, then money worked for them, growing consistently even during a bear market.

Chris Vermeulen
Chief Investment Officer
www.TheTechnicalTraders.com

Disclaimer: This and any information contained herein should not be considered investment advice. Technical Traders Ltd. and its staff are not registered investment advisors. Under no circumstances should any content from websites, articles, videos, seminars, books or emails from Technical Traders Ltd. or its affiliates be used or interpreted as a recommendation to buy or sell any security or commodity contract. Our advice is not tailored to the needs of any subscriber so talk with your investment advisor before making trading decisions. Invest at your own risk. I may or may not have positions in any security mentioned at any time and maybe buy sell or hold said security at any

In 2020 & 2021, we published a very well-received series of articles related to a longer-term pattern we called the Excess Phase Peak pattern. At that time, we highlighted the five (5) components of the Excess Phase Peak pattern and provided a number of examples showing how it usually played out for traders.

You can review our first article: How To Spot The End Of An Excess Phase.

One more article to review is Revisiting The Excess Phase Peak Pattern, which contains links to many of our previous Excess Phase articles. We received so many comments and emails from this article that we thought now would be a great time to bring it forward once more. It highlights how the SPY appears to be moving into a Stage #4 Excess Phase Peak pattern again. Recently we’ve seen the SPY move through Phases 1, 2, & 3. Now, we need to see if the next breakdown in price will start or confirm the Phase #4 price breach.

Why Is The Excess Phase Peak Important?

The Excess Phase Peak pattern is a very common transitional phase for the markets where psychology and economic trends shift over time. Global markets typically require periods of pause, reversion, or a reset/revaluation event to wash away excesses. We’ve seen these types of setups happen near the DOT COM and 2007-08 market peaks. What happens is traders are slow to catch onto the shifting phases of the Excess Phase Peak and sometimes get trapped thinking, “this is the bottom – time to buy.”

The reality is that as long as the individual phases of the Excess Phase Peak continue to validate (or confirm), then we should continue to expect the next phase to execute as well. In other words, unless the Excess Phase Peak pattern is invalidated somehow, it is very likely to continue to execute, resulting in an ultimate bottom in price many months from now.

The 5-Phases Of The Excess Phase Peak Pattern

The Excess Phase Peak Pattern starts off in a very strong rally phase. This rally phase normally lasts well over 12 to 24 months and is usually driven by an extreme speculative phase in the markets.

Once a price peak is reached and the markets roll downward by more than 7~10%, that’s when we should start to apply the five unique phases of the Excess Phase Peak Pattern. If each subsequent phase validates after the peak, then the Excess Phase Peak Pattern is continuing. If any phase is invalidated, then the pattern has likely ended. For example, if we start by completing Phase #1 & #2, then the market rallies to a new all-time high – that would invalidate the Excess Phase Peak Pattern.

Here are the Phases of the Excess Phase Peak Pattern:

  1. The Excess Phase Rally Peak
  2. A breakdown from the Excess Phase Peak sets up a FLAG/Pennant recovery phase.
  3. Sets up the Intermediate support level – the last line of defense for price.
  4. Price retests #3 support & breaches the support level – starting a new downtrend.
  5. The final breakdown of the price is below the Phase 4 support level. This usually starts a broad market selling phase to an ultimate bottom.

Now, let’s take a look at the 2007-09 SPY market peak to see how these phases played out.

2007-2009 Excess Phase Peak Pattern

Highlighted on the chart below, Phase #1 & #2 played out perfectly, with a lower high for Phase #2 and a Phase #3 breakdown. By the time Phase #2 broke downward, we should have been keenly aware of the potential for a Phase #3 support level to set up and extend.

Phase #3 can sometimes result in an upward-sloping support channel (like a Bear Flag), but in this case, it is validated as a horizontal support level. We could have used the May 2008 peak as a reversal/breakdown trigger showing us an early Phase #3 change in trend. Having said that, until the Phase #3 support level is breached – these could turn into false breakdowns.

Once Phase #3 support is breached, and we clearly start a deeper downward price trend (moving into the Phase #4 search for the ultimate bottom), traders need to stay very cautious of risks. Phase #3 is one of the most troubling and difficult phases to navigate. It always seems like a “perfect new bottom in price” – until Phase #4 hits.

Ultimately, a Phase #5 bottom sets up (the ultimate bottom), and this usually coincides with extreme selling pressures. Often, the US or foreign governments are involved in trying to contain global risks or address global corporate/financial concerns. We must wait for confirmation of a bottom before we can really take advantage of the lower price levels – but this can be accomplished using technical indicators and price theory.

Excess phase peak pattern

The Current 2022 Excess Phase Peak Pattern Setup

On the chart below, I estimate we are in the midst of an early Phase #3 potential reversal setup. We’ve already seen a very clear Phase #1 peak, a -13.80% downtrend setting up the Phase #2 bullish Flag/Pennant trend. Then we watch as the Phase #2 breakdown took place, resulting in another -21.60% price decline. Those lows set up the current Phase #3 base/support level near $363.

I’m cautiously watching the blue-dashed trend line as a potential early warning trigger for the Phase #3 bullish recovery cycle. Usually, within a Phase #3 recovery, after establishing critical support, the rally phase becomes very important to validate/confirm the potential Phase #4 & #5 processes.

If the Excess Phase Peak Pattern is going to invalidate at this point, the critical support level will stay unbroken, and a new upward price trend will be established from the Phase #3 support/bottom. So, this is when we need to watch very cautiously for any significant shift in central bank policies, foreign capital risks, shifting sentiment, or anything else that may provide the needed support for the markets to keep rallying higher. Otherwise, we should expect the Excess Phase Peak to continue unfolding.

Excess phase peak pattern setup

In Conclusion

Traders and Investors should stay very cautious in this phase of the markets. Going “all-in” with a bullish or bearish expectation right now can be very dangerous to your bottom line. I found my tactical asset revesting strategy provides above-average growth and capital protection.

Learn why I rely on my proprietary CGS, BAN, and TTI strategies to assist in identifying opportunities in various market trends and how I use these to find opportunities to trade within the Excess Phase Peak Pattern. Volatility is still quite high, and there are opportunities for great trades if you understand risk factors.

LEARN FROM OUR TEAM OF SEASONED TRADERS

In today’s market environment, it’s imperative to assess our trading plans, portfolio holdings, and cash reserves. As professional technical traders, we always follow the price. At first glance, this seems very straightforward and simple. But emotions can interfere with a trader’s success when they buck the trend (price). Remember, our ego aside, protecting our hard-earned capital is essential to our survival and success.

Successfully managing our drawdowns ensures our trading success. The larger the loss, the more difficult it will be to make up. Consider the following:

  • A loss of 10% requires an 11% gain to recover.
  • A 50% loss requires a 100% gain to recover.
  • A 60% loss requires an even more daunting 150% gain to simply break even.

Recovery time also varies significantly depending upon the magnitude of the drawdown:

  • A 10% drawdown can typically be recovered in weeks to a few months.
  • A 50% drawdown may take many years to recover.

Depending on a trader’s age, they may not have the time to wait nor the patience for a market recovery. Successful traders know it’s critical to keep drawdowns with reason, as most have learned this principle the hard way.

Sign up for my free trading newsletter, so you don’t miss the next opportunity!

We invite you to join our group of active traders who invest conservatively together. They learn and profit from our three ETF Technical Trading Strategies. We can help you protect and grow your wealth in any type of market condition. Click on the following link to learn how: www.TheTechnicalTraders.com.

Benefits of Retirement Asset Revesting are to reduce account volatility while increasing and creating more consistent growth while stabilizing an investor’s emotional journey.

Chris Vermeulen
Founder & Chief Market Strategist

Long before weekly options were a thing when ticks were still in 16ths, and we downloaded batches of chart data over a dial-up modem…I “discovered” the world of options.

Like most options newcomers, I first learned about buying options – either Calls or Puts – to hopefully profit in a directional move of the underlying stock. I’d buy Calls to profit from an increase in the underlying’s price and Puts to profit from a decrease in the underlying’s price. Simple, yes? (Okay, maybe there’s a bit more to it than that.)

Soon after, I learned about selling options – about how I could “outsmart” the market by being a seller of options rather than a buyer. Ah, those were the days — of option-selling thrills and sudden “learning experiences.”

To Buy Or Sell Options

Option selling strategies can work well if your objective is steady, repeatable income. Selling options rather than buying does have advantages. As theta time decay works in favor of the option seller, premium sellers tend to have a higher probability of a profit. The tradeoff is that the profit is limited to the amount of net option premium collected.

Selling options – Puts or Calls – also comes with a potential obligation to either provide or buy the stock at the option strike price. Those obligations could present substantial risk depending on the underlying stock, implied volatility, position size, and how the trade is structured.

Being the “smart” young trader I was, I soon realized I could look for stocks with very high option premiums and focus on selling those. My trading platform even made it easy to create scans based on high implied volatility to find them.

It’s not hard to find extreme option premiums on small stocks. Quite often, there is a pending big news event. For example, a small pharmaceutical company that has its only product in trials and has FDA approval pending. In a situation like that, where the company’s whole future could ride on approval news, we’re likely to find astronomical option premiums. Don’t be tempted.

What could possibly go wrong? If the approval falls through for some reason, the entire company could be out of business in short order. And option sellers can be left “holding the bag.” It happens.

There are no giveaways in the options market. When premiums are high, they are high for a reason. When we buy options, we have risk up to the amount of premium paid. When we sell options, we could have a much greater risk of buying soon-to-be-worthless shares at the strike price.

Tips for selling option premium

Avoid Illiquid Product

If you see a stock with very thinly traded options, take it as a warning sign. If you want steady, consistent results, stick with larger, more well-known stocks with good liquidity. I regularly look at S&P 500 and Nasdaq 100 stocks for candidates. That’s an excellent place to start when looking for premium-selling opportunities. Stocks with weekly options, and reasonable participation in those options, tend to be better candidates.

When there’s good liquidity in the options, you’ll see decent volume and open interest across a range of strike prices and expiration dates. These options should have narrow bid/ask spreads, sometimes as little as a penny wide. You can get in and out of trades or extend duration by rolling at fair prices.

When the bid/ask spreads are extremely wide, it could be just you vs. the option Market Maker. Option Market Makers are the buyers/sellers of last resort. Market Makers generally hedge their directional risk as their core business is to make money not from directional moves but rather from the bid/ask spreads. So, if it’s just you and the Market Maker trying to agree on a price, don’t expect any mercy. Market Makers have kids to get through college too.

Avoid Extreme Premiums

Learn to recognize when premiums are extreme. The implied volatility will be high versus the historical volatility. When premiums look too good to be true, look closer. There is always a reason.

This is not to say you can’t sell expensive option premium.

But, for example, don’t sell Puts on more stock than you’re willing to own, even if the stock goes to $0.

Five Rules for Option Sellers

  1. Adopt a long-term mindset. We want our option selling strategies to be repeatable and sustainable so that we can stay profitably “in the business” for the long term.
  2. Don’t sell premiums on the hottest stocks you can find just because the premiums are huge and tempting.
  3. On any trade, mind your position size. If the stock makes an outsized move or even goes to $0, will you be able to shrug off the loss? Size accordingly.
  4. Always understand your worst-case risk. Stock prices can do things that we thought very unlikely when we opened the trade.
  5. Trade liquid products. I can’t emphasize enough how important it can be to get fair prices when buying, selling, or rolling. We don’t want to start our trades with the distinct disadvantage of not being able to get “fair” prices.

Sign up for my free trading newsletter, so you don’t miss the next opportunity!

WANT TO LEARN MORE ABOUT OPTIONS TRADING?

Every day on Options Trading Signals, we do defined risk trades that protect us from black swan events 24/7. Many may think that is what stop losses are for. Well, remember the markets are only open about 1/3 of the hours in a day. Therefore, a stop loss only protects you for 1/3 of each day. Stocks can gap up or down. With options, you are always protected because we do defined risk in a spread. We cover with multiple legs, which are always on once you own.   

Our Options Trading Specialist, Brian Benson, continues to knock his trades out of the park. His current win rate is 90%, meaning of the last 20 trades, 18 have finished in the money!

If you are new to trading or have been trading stock but are interested in options, you can find more information at The Technical Traders – Options Trading Signals Service. Brian, who has been trading options for almost 20 years, sends out real live trade alerts on actual trades, such as TSLA and NVDA, with real money. Ready to subscribe, click here:  TheTechnicalTraders.com.

A wide range of assets qualify for Single Asset Revesting, including indexes, sectors, individual stocks, bonds, commodities, currencies, or groups of related assets such as precious metals, which move together as a group.

Enjoy your day!

Chris Vermeulen
Founder & Chief Market Strategist
TheTechnicalTraders.com

Talk of a Global Recession may prompt a broad decline in Crude Oil prices as the excesses of the past 10+ years unwind. This unwinding process pushed to the forefront for traders and investors has been prompted by a massive inflationary expansion after the COVID-19 lockdowns. How will it play out in the short-term and long-term?

Unwinding Excess Price Cycle Phase May Push Crude Oil Below $60 ppb

I believe Crude Oil will contract as the initial reduction in demand associated with high-priced gasoline and oil products and the threat of a Global Recession recede. This decline in Crude Oil prices is complicated as China/Asia economic and COVID crisis events continue to disrupt consumer discretionary income and asset valuation levels.

Crude Oil prices are an excellent measure of consumer engagement and activity worldwide. As an economy grows, demand for Crude Oil increases as manufacturers, suppliers, service & support companies, and shipping companies must keep up. When an economy slows, or consumers decrease spending habits, Crude Oil starts declining as overall demand decreases.

The best way to interpret this is that consumers spend willingly when stocks and home prices skyrocket. Yet, they turn away from spending when stocks and home prices turn downward. It is a natural, psychological reaction to unknowns and stress.

Critical Support Near $87 May soon Be Breached

This Daily Crude Oil Chart highlights the key price highs and lows as Fractal levels. It is essential to understand that the nearest real support level below $87 is just above $61 for Crude Oil. If Crude Oil continues to slide downward, I believe a strong downward price trend may occur if the $87 support level is breached.

This would also suggest that a broad energy sector decline could take place over a 30~60-day period as Crude Oil attempts to identify new support. Yet, I believe this downward trend will be temporary in the longer-term scope of Crude Oil trends.

After the 2007-08 Global Financial Crisis, Crude Oil collapsed by -77%, from $145 to $34, then rallied +232% to over $113 by 2011. If a Global Recession phase continues through the end of 2022 or into 2023, I suggest the recovery phase will prompt a solid recovery in Crude Oil prices over the next 3+ years.

Not many investors survived the 2008 bear market using an advisor, which is why individuals have started to focus on advisorless asset revesting.

Crude Oil Futures Weekly Chart

Post-COVID Excesses Seem Similar To The 2007-08 Market Peak

The initial contraction in the US markets throughout the start of the 2007-08 Global Financial Crisis occurred during an extended peaking pattern in the US stock market. It began to gain downward momentum as the US financial system started breaking down (Lehman, Bear Sterns, & Others). The collapse in the financial markets broke consumer expectations and spending habits as demand for commodities collapsed.

This same type of market malaise seems to be currently taking place as the post-COVID rally phase has run its course and the global markets slide into a sideways price malaise – waiting for the “Lehman Moment.”

I suspect the current demand destruction related to inflationary trends, high gasoline prices, and the threat of another global house price peak may be sending consumers into a similar contraction cycle. This is why I believe Crude Oil will slide below the $87 price level and attempt to find new support near $61 before we see any real upward price trends in the energy sector.

Crude Oil Futures Daily Chart

Alternate Energy May Surprise While Oil Moves Downward

Providing an opportunity for traders, Solar, Battery, and other new forms of energy may experience a boom cycle while Crude Oil contracts. Crude Oil is used in all forms of manufacturing, transportation, and other aspects of the global economy. Yet, while Crude Oil contracts, alternative energy sources may experience a rising price cycle.

President Joe Biden just signed the Inflation Reduction Act into law, pushing a massive $369 billion into new energy security and climate change (Source: Smartasset.com). This new investment in alternative energy sources, green energy, and increased Crude Oil supply will dramatically shift opportunities within the Energy Sector.

TAN, the Invesco Solar Energy ETF, may rally more than 15% to levels above $101 before possibly continuing higher to retest the $120 to $125 2021 highs.

TAN - Invesco Solar ETF Weekly Chart

Learn how our Total ETF Portfolio strategies can help you more efficiently protect and trade these big sector trends while keeping you away from high-risk setups.

LEARN FROM OUR TEAM OF SEASONED TRADERS

In today’s market environment, it’s imperative to assess our trading plans, portfolio holdings, and cash reserves. As professional technical traders, we always follow the price. At first glance, this seems very straightforward and simple. But emotions can interfere with a trader’s success when they buck the trend (price). Remember, our ego aside, protecting our hard-earned capital is essential to our survival and success.

Successfully managing our drawdowns ensures our trading success. The larger the loss, the more difficult it will be to make up. Consider the following:

  • A loss of 10% requires an 11% gain to recover.
  • A 50% loss requires a 100% gain to recover.
  • A 60% loss requires an even more daunting 150% gain to simply break even.

Recovery time also varies significantly depending upon the magnitude of the drawdown:

  • A 10% drawdown can typically be recovered in weeks to a few months.
  • A 50% drawdown may take many years to recover.

Depending on a trader’s age, they may not have the time to wait nor the patience for a market recovery. Successful traders know it’s critical to keep drawdowns with reason, as most have learned this principle the hard way.

Sign up for my free trading newsletter, so you don’t miss the next opportunity!

We invite you to join our group of active traders who invest conservatively together. They learn and profit from our three ETF Technical Trading Strategies. We can help you protect and grow your wealth in any type of market condition. Click on the following link to learn how: www.TheTechnicalTraders.com.

Tactical Asset Revesting through technical analysis provides clarity on market direction and risks while removing the guesswork from trading.

Chris Vermeulen
Founder & Chief Market Strategist

In the trader tip video below, Brian is having a look at ABT (Abbott Laboratories) charts. ABT has been going through a period of consolidation since about the end of June. More recently, in the last several days, ABT has been looking a little more bullish, turning to the upside.

One thing we could do here is to buy shares of the stock if you want to leverage a position. We can also buy an end-the-money call and give a few weeks to let these positions work. The last alternative would be doing a bullish put vertical credit spread.

TO LEARN MORE ABOUT THE ABT trade setup – WATCH THE VIDEO

Subscribers: Please let us know what you would like to learn, and we will add it to the roster of our weekly Technical Trader Tips!

Non-subscribers: Please enjoy these micro-lessons as a way to further your education and understanding of how a technical trader…well…trades!

TO EXPLORE THE STRATEGIES THAT BRIAN USES, PLEASE VISIT Optionstradingsignals.com. YOU’VE GOT MORE TO GAIN THAN TO LOSE WHEN SEEKING INFORMATION!

Individuals who utilize Vanguard Asset Revesting as part of their retirement portfolio experience smaller drawdowns, less financial stress, and higher returns.

Disclaimer: None of this material is meant to be construed as investment advice. It is for education and entertainment purposes only. The video is accurate as of the posting date but may not be accurate in the future.

In the trader tip video below, Chris dives into MJ which is the Alternative Harvest ETF. MJ was a hot commodity back in 2020 but has then fizzled out and become one of those sectors that continues to slide, making new multi-year lows. With that said, we have seen gross stocks start to come to life over the past couple of weeks.

We’ve had many great trades and closed out a lot of great gross sector ETF trades already. Overall, MJ is giving a new trigger that can potentially see a 10% pop and rally.

TO LEARN MORE ABOUT THE MJ Alternative Harvest ETF – WATCH THE VIDEO

Subscribers: Please let us know what you would like to learn, and we will add it to the roster of our weekly Technical Trader Tips!

Non-subscribers: Please enjoy these micro-lessons as a way to further your education and understanding of how a technical trader…well…trades!

TO EXPLORE THE STRATEGIES THAT CHRIS USES, PLEASE VISIT THE TECHNICAL TRADERS. YOU’VE GOT MORE TO GAIN THAN TO LOSE WHEN SEEKING INFORMATION!

Disclaimer: None of this material is meant to be construed as investment advice. It is for education and entertainment purposes only. The video is accurate as of the posting date but may not be accurate in the future.

In the trader tip video below, Brian is having a look at HD (The Home Depot) stock. Looking at the charts, HD has been in a downtrend for most of 2022. It is off about 27% or so from its highs back in December and January timeframe. Longer term, HD seems to be an attractive company at an attractive price.

What we would like to do is get ourselves a trade structure that will allow us some leeway to stay in the trade for a while. And ride out any shorter terms ups and downs pretty well. We are looking at doing a call diagonal spread, going out to December or January, and buying an “at the money” call.

TO LEARN MORE ABOUT THE HD trade setup – WATCH THE VIDEO

Subscribers: Please let us know what you would like to learn, and we will add it to the roster of our weekly Technical Trader Tips!

Non-subscribers: Please enjoy these micro-lessons as a way to further your education and understanding of how a technical trader…well…trades!

TO EXPLORE THE STRATEGIES THAT BRIAN USES, PLEASE VISIT Optionstradingsignals.com. YOU’VE GOT MORE TO GAIN THAN TO LOSE WHEN SEEKING INFORMATION!

Disclaimer: None of this material is meant to be construed as investment advice. It is for education and entertainment purposes only. The video is accurate as of the posting date but may not be accurate in the future.

Fear is starting to become an issue. Traders are starting to realize inflation, CPI, PPI, and global currencies are reacting to the sudden policy shift by the US Fed and global central banks. This fear is showing up in the Gold-to-Silver ratio as well.

My research suggests the closest comparison to the current Gold/Silver setup may be found by looking at the early 2000~2003 US markets. Let’s investigate this setup a bit further.

Gold-To-Silver Ratio Peaks Above 1.2 During COVID crisis

Over the past 5 years, Gold consolidated from 2017 through the COVID Virus event. This consolidation is prompting an extreme high in the Gold-to-Silver Ratio to levels above 1.2. The only other time in history when the Gold-to-Silver Ratio reached levels above 1.2 was in 1991~92. This is aligning with the fall of the Soviet Union.

This extreme peak in the Gold-to-Silver ratio marks a very weak Silver price compared to Gold. Psychologically, this represents a very real lack of fear related to global currencies/economies. The threat of extreme inflation trends.

Now, as inflation suddenly became a topic near the end of 2021, the Gold-to-Silver ratio has moved decided downward. This illustrates Silver is rallying compared to the price of Gold as fear begins to elevate across the globe. Traders, consumers, and others are moving assets into precious metals near recent price lows to hedge against uncertainty, inflation, and currency devaluation.

The Fall Of The Soviet Union Was A Global Catalyst Event – Just Like COVID

The collapse of the Soviet Union prompted a global shift in how global currencies, threats, and opportunities were perceived. It also ushered in a new wave of capitalism throughout Russia that prompted a massive credit/economic expansion phase aligned with the birth of the Internet in the early 1990s. This is why we see Gold price levels stay rather muted from 1989 through 2002-03. It was a time of very little fear when global traders chased deals, DOT COM stocks, and Real Estate instead of precious metals.

After the DOT COM bubble burst, and the 9/11 terrorist attacks rattled global financial markets, fear and precious metals suddenly came into focus again. The rally that took place after 2001 in Gold prompted a nearly 600% increase (from $260 to $1923). The biggest portion of this rally took place after the 2007-08 Global Financial Crisis.

Is today any different than 2000~2002 in reality?

The similarities seem too obvious to ignore…

I believe a continued decline in Crude Oil, as well as a continued strengthening of the US Dollar, will likely take place throughout the end of 2022. In the meantime, Gold attempts to climb back toward recent highs. The catalyst for the breakout rally in Gold and Silver will likely be some extended breakdown in the US/Global financial markets and stocks or some new War/Aggression that pulls the US/EU into a conflict.

Overall, I believe global currencies will continue to recoil because of risk/devaluation factors related to inflation and disruptions within the global economy; very similar to the end of the Soviet Union in 1991.

My thinking is that Gold will attempt to hold above $1700 as a base support level while Silver attempts to hold above $19.00 as base support. Any major crisis event, war, or global financial meltdown may prompt a retest of these base support levels within the next 12+ months.

If Gold/Silver Are Repeating A 2002-03 Setup, What Can We Expect In The Future?

Then the breakout trend starts in Gold, which could happen as early as 2023 or 2024, I believe the next rally target for Gold will be somewhere above $3100. Then, we start a dedicated climb to levels above $4500 and beyond.

It is difficult to predict any date targets for this type of rally, but I’m trying to illustrate what I see related to the similarities of the 1989~2003 market conditions with what I’m seeing right now. If you were around to live through this incredibly exciting time, you may remember many of these events. I’m suggesting we may be starting to move through similar events right now and I suspect we are somewhere near August 2000 right now.

HOW CAN WE HELP YOU LEARN TO INVEST CONSERVATIVELY?

At TheTechnicalTraders.com, my team and I can do these things:

  • Safely navigate the commodity and crude oil trend.
  • Reduce your FOMO and manage your emotions.
  • Have proven trading strategies for bull and bear markets.
  • Provide quality trades for investing conservatively.
  • Tell you when to take profits and exit trades.
  • Save you time with our research.
  • Proved above-average returns/growth over the long run.
  • Have consistent growth with low volatility/risks.
  • Make trading and investing safer, more profitable, and educational.

Sign up for my free trading newsletter, so you don’t miss the next opportunity!

We invite you to join our group of active traders who invest conservatively together. They learn and profit from our three ETF Technical Trading Strategies. We can help you protect and grow your wealth in any type of market condition. Click on the following link to learn how: www.TheTechnicalTraders.com.

The Buy-and-Hold Approach to investing is a simple and sensible strategy. It involves identifying quality investments that you believe can grow over time, such as stocks and bonds, and then buying them with the intention of holding them in order to benefit from long-term increases in their value.

Chris Vermeulen
Founder & Chief Market Strategist

Chris Vermeulen of The Technical Traders joins Elijah K Johnson from Liberty and Finance to discuss the current stock market rally and possible reversal. The stock market can also enter a complacency rally and start a bigger correction. The rally could also last a couple more months. We are positioned in some gross stocks, expecting this market to hopefully go higher.

Overall, this market is on a turning point and can roll over very quickly. If it does, the US Dollar will go higher and it is going to put a lot of pressure on precious metals. When money is moving out of the stock market, it seems to move in everything that benefits the dollar index. We may also enter a bear market and if we do, precious metals and miners can come back down and test these levels.

TO LEARN MORE ABOUT Stock Market rally and possible reversal – WATCH THE VIDEO

TO EXPLORE THE Total ETF Portfolio, PLEASE VISIT US AT The technical traders. You’vE GOT MORE TO GAIN THAN TO LOSE WHEN SEEKING INFORMATION!

Disclaimer: None of this material is meant to be construed as investment advice. It is for education and entertainment purposes only. The video is accurate as of the posting date but may not be accurate in the future.

Chris sits down with Ivan Bayoukhi and Jim Lewis from Wall Street Silver to discuss the potential downside in the stock market. The stock market goes through four stages and during these stages there are these emotional waves going through people’s veins after the covid crash. This resulted in us seeing this thrilling euphoric wave of gross stock.

In early 2021, we saw gross stocks top out and rollover. We’ve seen the stock indexes like the S & P 500 crack to the downside with a 20% correction. Right now, a lot of people are just starting to feel like they can start buying stocks again already. We call this a complacency rally which is usually a choppy rally that lasts a few months. Overall, there’s a lot of downside potential in the stock market moving forward.

TO LEARN MORE ABOUT the downside potential In The Stock Market, WATCH THE VIDEO

TO EXPLORE THE Total ETF Portfolio, PLEASE VISIT US AT The technical traders. You’vE GOT MORE TO GAIN THAN TO LOSE WHEN SEEKING INFORMATION!

Disclaimer: None of this material is meant to be construed as investment advice. It is for education and entertainment purposes only. The video is accurate as of the posting date but may not be accurate in the future.