Both the Canadian and US stock markets are closed today. Futures trading have shortened mixed hours also. Being a holiday and limited trading there is no video this morning.
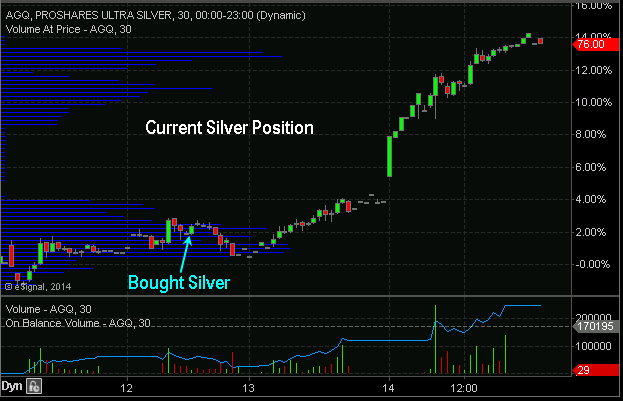
Taking a look at the futures market we can see trading up another 1.35% today which is great to see. So far out silver position is up over 12% in just a few trading sessions.
Natural gas is no fire once again… up nearly 5% again today and is now testing the recent spike highs in price in which we shorted earlier this month for a net 20+% profit in only a few days. Nat gas actually looks ready to rally even more this time so I am not looking to short it unless we get a picture perfect setup again.
The SP500 (broad market) continues to claw it’s way higher and its trading up 0.25% this morning. We are going to leave the stock market alone until we get a correction in price, then we will review the charts for a possible trade setup.
On different note, today we are excited to announce the opening of doors to our automated trading system for investors. Many of you are already on the waiting list as we have a limited amount of client seats available to have the system traded automatically in your brokerage account and it is first come first serve. Keep in mind today is a holiday with brokers and services are running on a skeleton crew. If you have not taken a look at our automated trading system you can review all the details here: www.AlgoTrades.net
Chris Vermeulen
https://thegoldandoilguy.com/wp-content/uploads/2014/02/silverposition.png401623adminhttp://www.thegoldandoilguy.com/wp-content/uploads/2014/11/tgaoglogo.pngadmin2014-02-17 08:56:372014-03-03 13:34:41Silver Trade & Automated Trading System for Investors
The precious metal market has been stuck in a strong down trend since 2012. But the recent chart, volume and technical analysis is starting to show some signs that a bottom may have already taken place.
This report focused on the weekly and monthly charts which allow us to see the bigger picture of where the precious metals sector stands in terms of its trend.
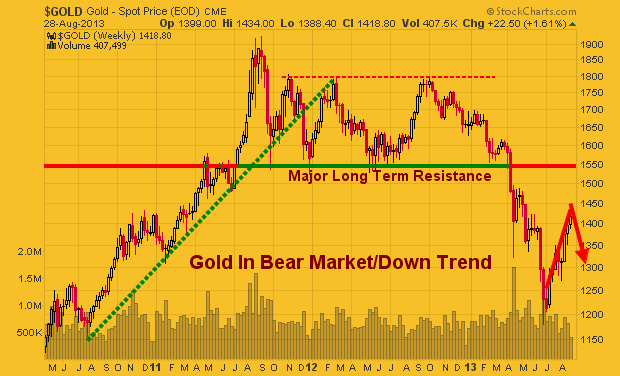
This chart clearly shows the trends which gold has gone through in the last three years. With simple technical analysis trend lines, clearly price is nearing a significant apex which will result in a strong breakout in either direction.
Remember, this is the weekly chart, so we could still have another month or three of sideways chatter to work through. But a breakout in either direction will trigger a large move.
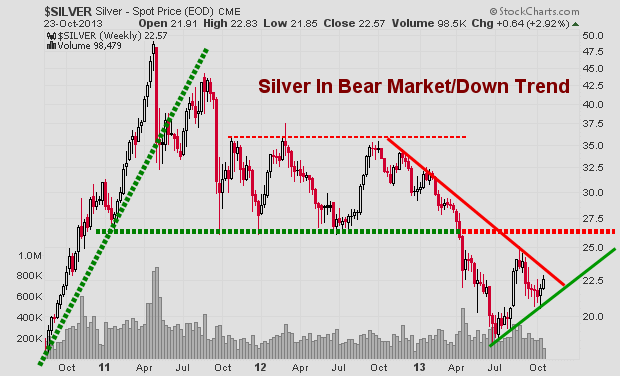
Silver Spot Price – Weekly Chart
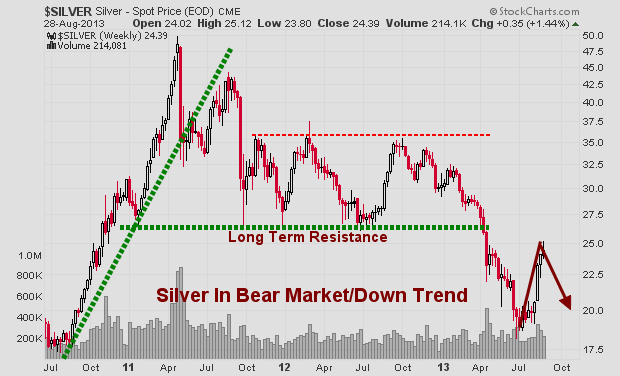
Silver is also stuck in a similar pattern. Currently the odds still favors lower prices and for the upper resistance trend line to reject price and send it lower. But if we keep out eye on the leading indicators like gold miners, we may be able to catch a breakout or traded the rejection of resistance in the next month or so.
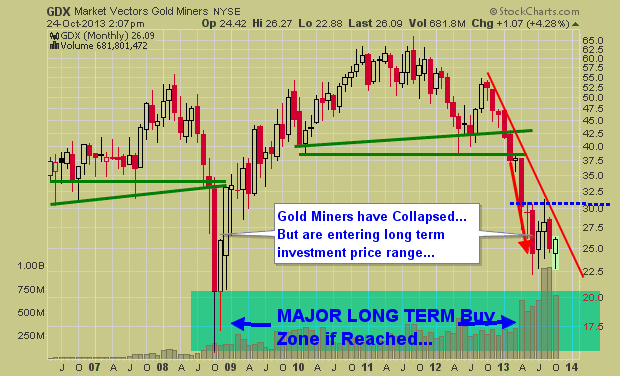
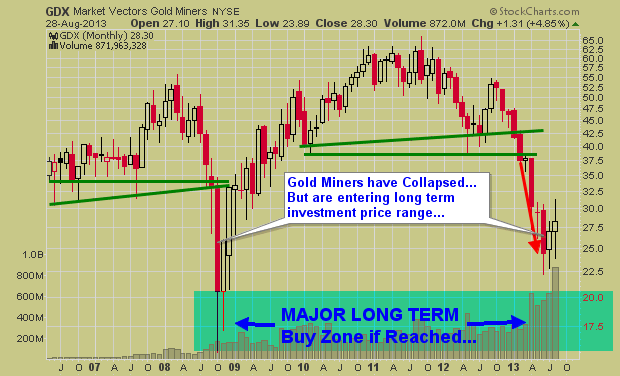
Gold Mining Stock ETF – Monthly Chart
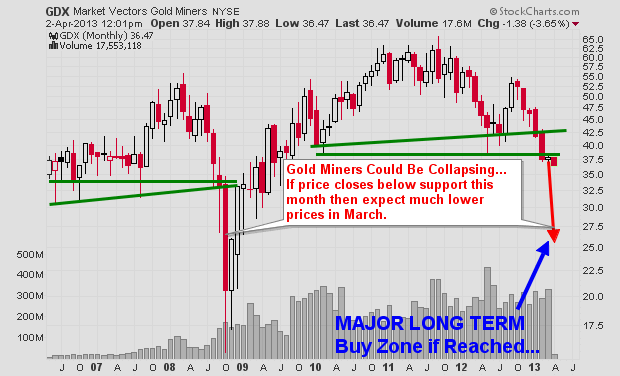
Gold miners have a very sloppy looking chart. Price is extremely volatile and the recent price action in 2013 could go either way VERY quickly. I have a gut feeling GDX in the coming months could have a washout bottom and tag the $20 price level. While I hope I am wrong for many investors sake, if it does happen, it will be a very strong investment level to accumulate a position.
Precious Metals Bigger Picture Outlook:
In short, I remain neutral – bearish for this sector. In the next 1-3 months we are likely to see some strong price action which will be great. We need a breakout or bottoming pattern to form before we get involved at this level.
I know everyone is dying to get involved in precious metals again for another huge rally… but sometimes it’s just best to wait for the big picture chart to catch up with your bias before taking a position of size.
Get My Free Weekly Trading Sector Reports
Delivered To Your Inbox: www.GoldAndOilGuy.com
http://www.thegoldandoilguy.com/wp-content/uploads/2014/11/tgaoglogo.png00adminhttp://www.thegoldandoilguy.com/wp-content/uploads/2014/11/tgaoglogo.pngadmin2013-10-24 14:56:192014-03-04 14:05:43Precious Metals: Gold, Silver and Miners Are Trapped
It has been a bumpy ride for precious metal investors over the past couple of years and it unfortunately I do not think its over just yet.
The good news is that the bottom has likely been put in for gold, silver and gold miners BUT the recent rally in these metals and miner looks to be coming to an end. While we could see another pop in price over the next week or so the price, volume and momentum see to be stalling out.
What does this mean? It means we should expect short term weakness and lower prices over the next month or two.
Below are three charts I posted several months ago on my free stockcharts list. These forecast were based off simple technical analysis using cycles, Fibonacci and price patterns. As you can see we are not trading at my key pivot level which I expect selling pressure to start to increase and eventually overpower the buyers sending the prices lower.
Gold Trading Weekly Chart:
Here you can see that gold is technically in a bear market when viewing it on the weekly chart. If you were to pull up a daily chart you would likely notice how the price of gold is trading at a key resistance level on the chart and has reached its full flag measured move.
What does this mean? It means the odds are pointing to lower prices for gold in the next few weeks. Keep in mind though I do feel as though a major bottom has been put in place for the precious metals sector. So buyers are likely to step back in around the $1300 area.
Silver Trading Weekly Chart:
Silver has a little bit different looking chart but the same analysis applies here as it did in gold.
Gold Miners Trading Monthly Chart:
Gold miners may have bottomed on this monthly investing timeframe chart but the daily chart which you will see next clearly shows short term weakness has started.
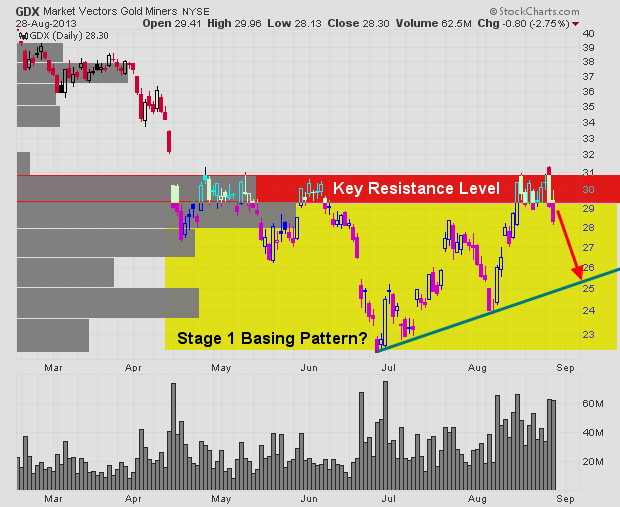
Gold Miners Trading Daily Chart:
This daily chart really shows my thinking for miners and the overall precious metals sector as a whole. The recent weakness in gold miners to the down side point to distribution of shares. This is very negative for the price of physical gold and silver as gold mining stocks tend to lead physical metals.
The yellow box shows a possible major stage 1 basing pattern forming. If this is the case, then we will have a great opportunity in the coming months when the precious metals down trend completes a reversal and start heading higher.
How to Trade Precious Metals & Gold Miners Conclusion:
In short, I think that staying in cash or shorting metals is the play for the next couple weeks. After that anything can happen and until price breaks down or finally completes the basing pattern and confirms a market bottom I would be very cautious trading here.
In the last week members of my trading newsletter took profits on our short SP500 trade and we closed a long trade in natural gas for a quick 6.5% gain. Join our community of traders and have your money on the right side of the market!
http://www.thegoldandoilguy.com/wp-content/uploads/2014/11/tgaoglogo.png00adminhttp://www.thegoldandoilguy.com/wp-content/uploads/2014/11/tgaoglogo.pngadmin2013-06-25 08:37:032013-06-25 08:37:03Big Money Making Trades for July – Gold Miners, Nat Gas, SP500
“WOW” Friday’s Precious Metals Meltdown is an understatement…. I love seeing all this fear in the market and panic selling volume jump through the roof. This is or is the “start” of the washout bottom in metals I have been talking about for a few months. Critical support levels have been broken on gold, silver and miner stocks today. This is running the stops juicing up the sell side volume.
This size of a move WILL trigger a wave of margin calls come the end of the session and it could start another strong wave of selling into the closing bell. While I like this prices for both gold and silver, I know this could be just the start of more selling. I sound like a broken record but I am not trying to catch a falling knife unless it looks like a perfect setup. I still feel we could get another 1-3 days of selling or chop down here before things go higher so I will just watch the gold and bugs get stepped on again.
Remember this chart I posted a while back… it’s now coming true:
Last day of the week is the most important for long term trends and investors. Today is going to be wild and may trigger a massive wave of selling which could be really good for those who know how to take advantage of it with me at: http://www.TheGoldAndOilGuy.com
Chris Vermeulen
http://www.thegoldandoilguy.com/wp-content/uploads/2014/11/tgaoglogo.png00adminhttp://www.thegoldandoilguy.com/wp-content/uploads/2014/11/tgaoglogo.pngadmin2013-04-12 11:35:022014-03-06 11:43:45Friday’s Precious Metals Melt-Down…. How to Manage It!
Gold and silver along with their related miners have been under a lot of selling pressure the last few months. Prices have fallen far enough to make most traders and investors start to panic and close out their long term positions which is a bullish signal in my opinion.
My trading tactic for both swing trading and day trading thrive on entering and exiting positions when panic trading hits an investment. General rule of thumb is to buy when others are extremely fearful and cannot hold on to a losing position any longer. When they are selling I am usually slowly accumulating a long position.
Looking at the charts below of gold and silver you can see the strong selling over the past two weeks. When you get drops this sharp investors tend to focus on their account statements watching the value drop at an accelerated rate to the point where they ignore the charts and just liquidate everything they have to preserve their capital. A few weeks ago I posted my outlook on precious metals which seems to be unfolding as expected: http://www.thegoldandoilguy.com/precious-metals-miners-making-waves-and-new-trends/
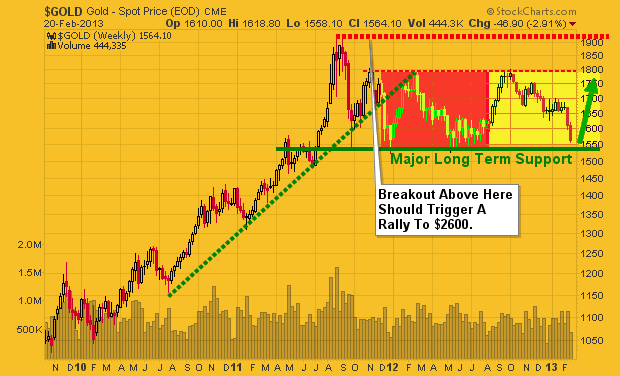
Gold Bullion Weekly Chart:
The price and outlook of gold has not really changed much in the past year. It remains in a major bull market and has been taking a breather, nothing more. Stepping back and reviewing the weekly chart it’s clear that gold is nearing long term support. With panic selling hitting the gold market and long term support only $20 – $30 dollars away this investment starts to look really tasty.
But if price breaks below the $1540 level and closed down there on a weekly basis then all bets are off as this would trigger a wave of selling that would make the recent selling look insignificant. And the uptrend in gold would now be over.
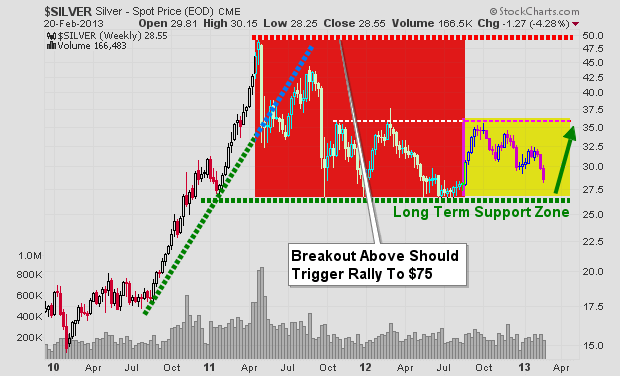
Silver Bullion Weekly Chart:
Silver price is in the same boat as its big sister (Yellow Gold). Only difference is that silver has larger price swings of 2-3x more than gold. This is what attracts more traders and investors but unfortunately the masses do not know how to manage leveraged investments like this and end up losing their shirts.
A breakdown below the $26.11 price would likely trigger a sharp drop back down to the $17.50 level so be careful…
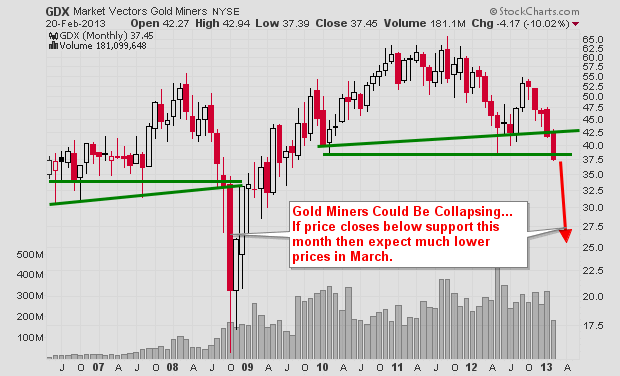
Gold Mining Stocks – Monthly Chart:
If you wanna see a scary chart then look at what could happen or is happening to gold miner stocks. This very could be happening as we speak and why I have been pounding the table for months no to get long gold, silver or miners until we see complete panic selling or a bullish basing pattern form on the charts. We have not seen either of these things take place although panic selling is slowly ramping up this week.
There will be some very frustrated gold bugs if they take another 33% hair cut in value… You can view some of my trading charts, setups and analysis free at my stockcharts.com list. Be sure to vote for me chartlist each day so I know its of value: https://stockcharts.com/public/1992897
Precious Metals Trend and Trading Conclusion:
In short, the precious metal sector remains in a cyclical bull market. That being said and looking at the daily charts the prices have been consolidating and are in a down trend currently. Until we see some type of bottoming pattern or price action form it is best to sit on the side lines and watch the emotional traders get caught up and do the wrong thing.
The next two weeks will be crucial for gold, silver and miner stocks. If metals cannot find support and close below the key support levels things could get really ugly fast. If you would like to receive my daily analysis and know what I am trading then check out my newsletter at: www.TheGoldAndOilGuy.com
Chris Vermeulen
http://www.thegoldandoilguy.com/wp-content/uploads/2014/11/tgaoglogo.png00adminhttp://www.thegoldandoilguy.com/wp-content/uploads/2014/11/tgaoglogo.pngadmin2013-02-21 06:11:282014-03-06 11:57:19Gold and Silver Nearing MAJOR Long Term Support
The precious metals sector has been dormant since both gold and silver topped in 2011. But the long term bull market remains intact. As long as we do not have the price of gold close below the lower yellow box on the monthly chart then technical speaking precious metals should continue much higher.
Large consolidation periods (yellow boxes) provide investors with great insight for investments looking forward 6-18 months upon a breakout in either direction (up or down). The issue with investing during these times is the passage of time. One can hold a position for months and sometimes years having their investments fluctuate adding extra stress to their life when they really do not need to.
Once a breakout takes place a powerful rally or decline will start putting an investors’ money to work within days of committing to that particular investment compared to money invested waiting months for the breakout and new capital gains to occur.
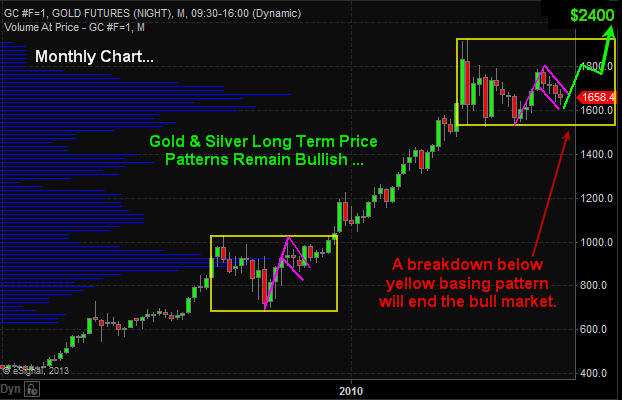
Gold Price Chart – Monthly
Gold Price Chart – Daily
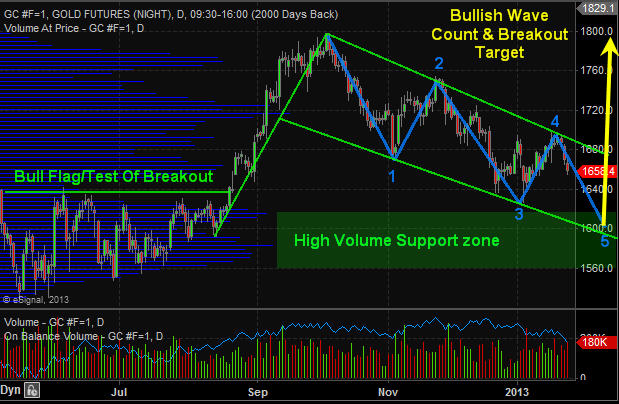
The chart of gold continues to form a large bull flag pattern with a potential 3 or 5 wave correction. If price reverses this week and breaks above the upper resistance trend line then it will be a 3 (ABC) wave correction which is very bullish. But there is potential for a full 5 wave correction which is still bullish, but it just means we have another month or two before metals bottom.
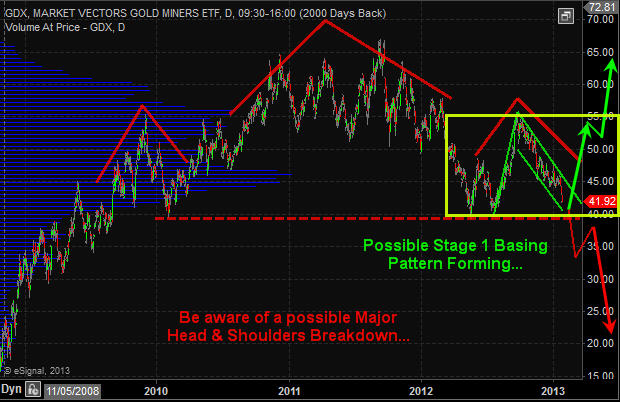
Gold Miner Stocks – GDX ETF Chart – Daily
Gold miners do not have the sexiest looking chart. It was formed a strong looking bull flag but has continues to correct and is not nearing a key support level. This level could act as a triple bottom (bullish) or if price breaks below then it would be breaking then neckline of a massive head and shoulders pattern which points to 50% decline. I remain bullish with the longer term gold trend until proven wrong.
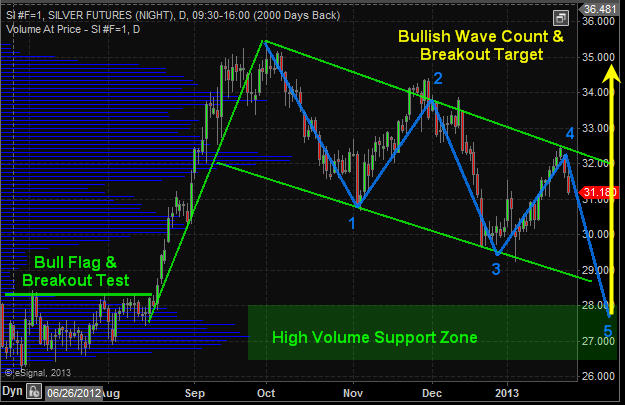
Silver Price Chart – Daily
Silver remains in a long term bull market much like the monthly chart of gold shown earlier in this report. Silver continues to work its way through a large bull flag pattern with a positive outlook at this time.
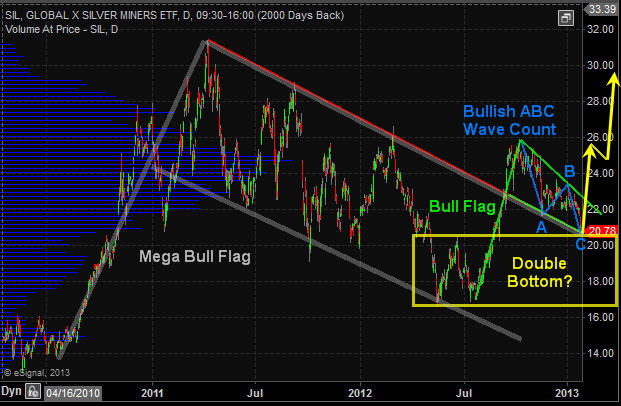
Silver Miner Stocks – SIL ETF – Daily Chart
Reviewing the precious metals sector it seems that silver miners have the sexiest looking chart. All price patterns are showing strength and are in proportion to one other. If this chart plays out to what technical analysis is pointing to then we could see the precious metals sector put in a bottom and rally within the next week or two. And if this is the case then silver miner stocks should provide the most opportunity going forward. Keep in mind you can view my actual watchlist of stock and ETFs I trade in real-time with my analysis free: https://stockcharts.com/public/1992897
Precious Metals Trading Conclusion:
In short, what you need to focus on is the yellow consolidation box on the monthly gold chart. A breaking in either direction will trigger a massive move that should last 6-18 months. Until then long term investors can simply sit back and watch the sector while they put their money to work in other active sectors.
From a short term traders point of view, that f mine. I am looking for a signs of a bottom on the daily chart to get my money working earlier to play the bounce/rally that takes place and actively managing the position until a breakout occurs. The charts overall are not that clear as to when a breakout will take place. Metals could start to rally next week or in a few months and all we can do is wait for a reversal to the upside before we get active.
Knowing the big picture trends and patterns at play along with major support and resistance levels (breakout levels) is crucial for success and piece of mind.
http://www.thegoldandoilguy.com/wp-content/uploads/2014/11/tgaoglogo.png00adminhttp://www.thegoldandoilguy.com/wp-content/uploads/2014/11/tgaoglogo.pngadmin2013-01-27 20:02:462014-03-06 12:04:37Precious Metals & Miners Making Waves and New Trends
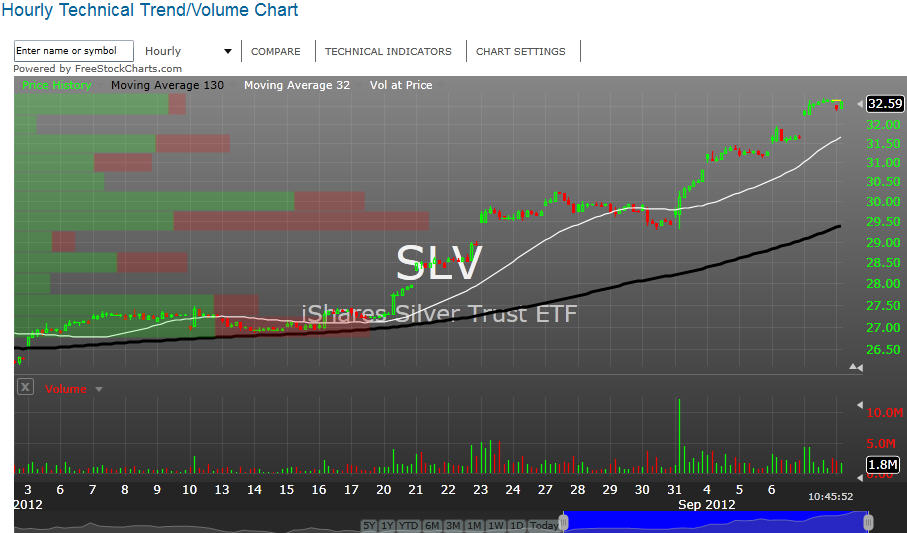
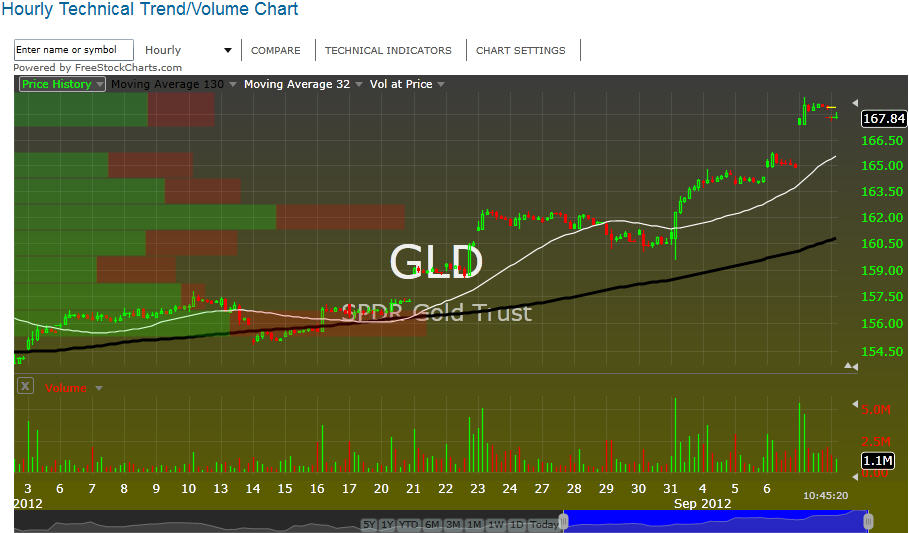
The price of silver reached a 5-month high this past week as investor interest seems to have been rekindled in both gold and silver as belief in financial markets increases that the latest round of monetary easing from the Federal Reserve – QE3 – will soon be on its way. Many investors had largely stayed away from silver in recent months after some had got caught up in its volatility. Silver had touched a 30-year high in April 2011 before plunging 35 percent in a few short weeks.
Now the volatility is back – but on the upside – as prices have climbed more than 20 percent in less than a month. The gains have outpaced that of gold which rose roughly 10 percent during the same time frame. Importantly for investors, the ratio between the two precious metals has moved about 10 percent in silver’s favor since mid-August. This is the first time silver has outperformed gold since the start of 2012.
For non-futures investors, the two precious metals can easily be tracked through the use of exchange traded funds (ETFs). The most liquid ETFs for the two precious metals are the iShares Silver Trust (NYSE Arca: SLV) and the SPDR Gold Shares (NYSE Arca: GLD) respectively.
Some may wonder why has silver outperformed gold in the past several weeks? The answer goes deeper than just confidence that QE3 is coming soon, but it is still rather a simple one. The sharp rally in silver was fueled largely by short-covering. That is, some investors (hedge funds, etc.) had made rather large bets that silver would continue falling and were caught off-guard by its recent rise. According to data from the Commodities Futures Trading Commission, the silver market during the week of August 27-31 saw the largest amount of short-covering since May 2011. At the same time. Bloomberg reported that hedge funds were the least bullish on silver in almost four years.
It is unknown for how long silver will outperform gold. But even some long-term fundamental investors such as legendary commodities investor Jim Rogers has said that he believes silver right now is a better investment than gold. He points to the fact that historically gold has been worth about 12 to 15 times what silver is worth, but that recently it has been worth roughly 50 times silver’s value. Silver is also the only major commodity not to have reached a new all-time high in the decade-long commodity bull market and is still cheaper than it was 32 years ago.
So it may be worth a look. But since silver is so volatile, wait for a downward spike before initiating or adding to a long position.
If you would like to get my weekly analysis on precious metals and the board market join my free newsletter at www.TheGoldAndOilGuy.com
Chris Vermeulen
http://www.thegoldandoilguy.com/wp-content/uploads/2014/11/tgaoglogo.png00adminhttp://www.thegoldandoilguy.com/wp-content/uploads/2014/11/tgaoglogo.pngadmin2012-09-10 10:57:022014-03-04 15:12:17Silver at Multi-Month High