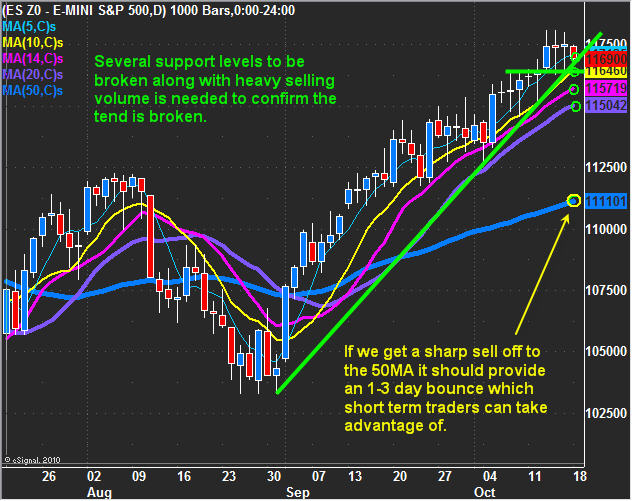
The broad markets along with metals have been on fire but in the last two weeks we have seen the sentiment become stronger. The extreme bullishness we are seeing has made it difficult for low risk swing traders to get in on the action simply because there have not been many sizable pullbacks. Instead the prices have been inching their way higher with very minor pullbacks before surging again.

The only way to take advantage of this type of price action in order to keep risk low is to take small positions when the market drops to the 5, 10 or 14 moving averages with a mental stop to exit the position if the market closes below the 14ma. Any position take up here should be small because the market is in runaway mode, meaning everyone is buying on the smallest of dips. The largest moves tend to be near the end of a trend which is why I feel this market could keep running for a few more weeks before taking a sharp plunge.

Natural Gas

If you have been reading my work over the past year you should know I don’t like natural gas. More people have lost money trying to play natural gas than any other investment vehicle out there which is why I don’t cover it very often. Many of you have been asking about Natural Gas (UNG) so here are my thoughts on it.

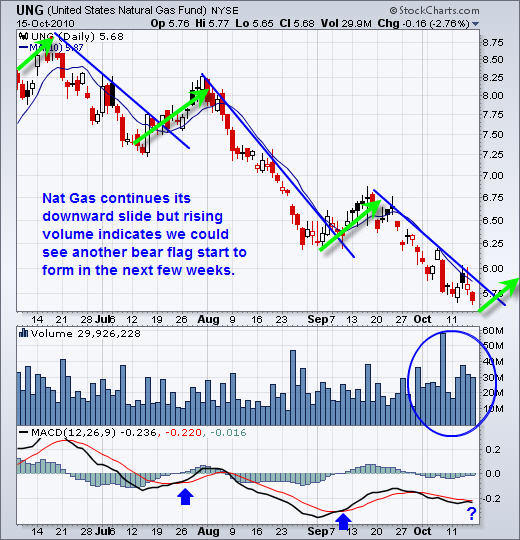
UNG has been in a down trend for several years and the only trades should be short positions at this time. The argument from some is that it’s undervalued and with winter just around the corner prices should go up. It’s a valid argument but price action is what makes traders money, not fundamentals.

The daily chart of Nat Gas below shows what I feel is about to happen. Remember, UNG is a terrible fund to be buying. Unless natural gas is moving strongly in your favor, this fund continually loses value simply because of the way its created.

Looking at the actual natural gas commodity chart is a different story… The trend is still down, but it does look as though it’s trying to form a base when looking at a 3 year weekly chart. That being said, there is still a very good chance we see gas test near the $3 level before starting a new trend so trying to pick a bottom here is not something I would be doing.

Trading Conclusion:

In short, the equities market is still in a strong uptrend. I’m not comfortable taking any large positions at this stage of the game but if we get a setup I will not hesitate to enter with a little money.

As for natural gas… trying to pick a bottom is deadly in a down trend as bounces tend to be short lived or flat.

I will cover the dollar, gold, oil and the market internals in the member’s pre-market morning video…

Happy Trading
Chris Vermeulen
www.TheGoldAndOilGuy.com

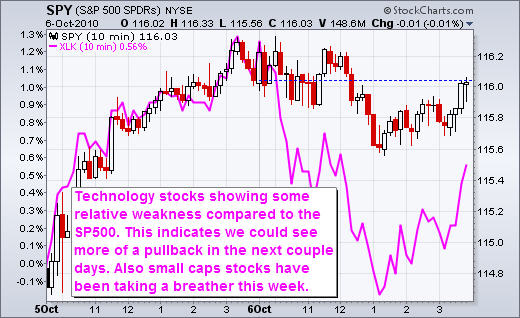
Wednesday’s session closed mixed on the day. The DOW posted a third of a percent gain while the tech sector closed down almost nine tenths of a percent. While technology stocks have been leading the market higher in the recent months, today they took the back seat while the DOW took control.

Take a look at the intraday chart of the SPY price action compared to the tech sector. It’s clear the tech stocks where not in favor today. Some tech stocks that really took a beating today were FFIV, NTAP, APKT and AKAM.

On another note, we are entering earning season and I am wondering if we are going to see a “Sell the New” type of thing again.

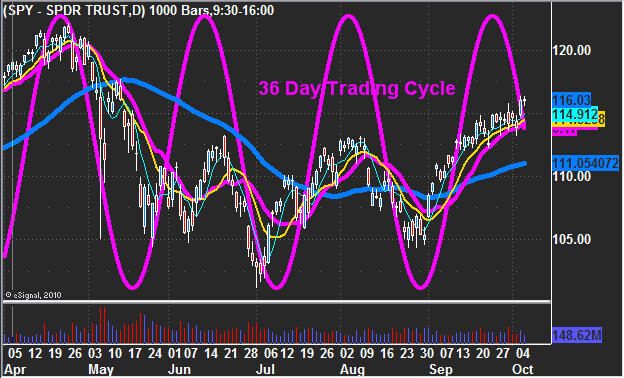
The broad market is experiencing a 36 day down cycle which has played a very dominant roll in the market this year. It topped out 9 days ago so we should expect sideways chop or some selling over the next 9 trading session. Because the market is trending up, pullbacks should be shallow.

The market continues to grind its way higher on relatively light volume. I have been waiting several weeks now for the volume to come back into the market but its just not happening. The majority of shares being traded are from banks, funds and day traders as the average investor’s not taking part because of the uncertainty looming. The lack of volume (commitment) to the market from the masses is making the market internals swing from one extreme to another on virtually weekly basis making it more difficult to take advantage of short term extreme sentiment levels.

The current market environment has traders shifting gears to more of a momentum trading strategy to take advantage of trends and this is what I am going to start implementing again as the market expands.

Market Conclusion:
In short, the equities market is in an up trend but looks to be overbought. Also with the downward cycle I don’t think the market will expand here and take off. Rather it will most likely chop around and burn off time until some earnings are released and the cycle bottoms. Unless we get a really sharp reversal down which we have yet to see on the SP500 or DOW, nibbling on small long positions or staying in cash is what I am doing right now.

As for gold, silver, the dollar and oil… Well the dollar continues to lose value on a daily basis which in turn is boosting metals along with crude oil. All four of those investments are over extended but they are trending and not really looking like they want to reverse just yet.

Chris Vermeulen
www.TheGoldAndOilGuy.com
Get More Free Reports and Trade Ideas Here for Free: FREE SIGN-UP

Wednesday the market didn’t tell us anything new. The equities market is still over extended on the daily chart but the market is refusing to break down. Each time there has been seen selling in the market over the past two weeks, the market recovers. Equities and the dollar have been trading with an inverse relationship and it seems to drop every in value each selling pressure enters the market, which naturally lifts stocks.

That being said, sellers are starting to come into the market at these elevated levels and it’s just a matter of time before we see a healthy pullback/correction. The past 10 session volatility has been creeping up as equities try to sell off. There will be a point when a falling dollar is not bullish for stocks but until then it looks like printing of money will continue devaluing of the dollar to help lift the stock market. Some type of pullback is needed if this trend is to continue and the markets can only be held up for so long.

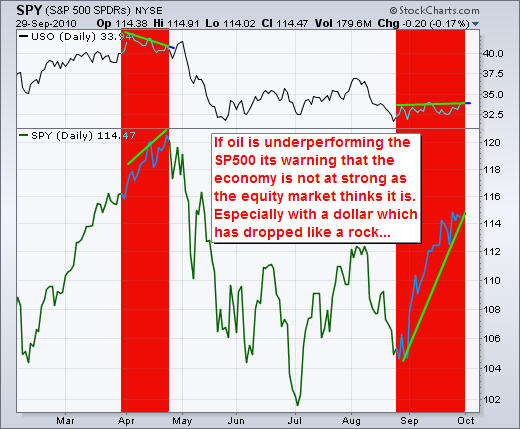
Below is a chart of the USO oil fund and the SPY index fund. Crude has a tendency to provide an early warning sign for the strength of the economy. As you can see from the April top, oil started to decline well before the equities market did. This indicated a slow down was coming.

The recent equities rally which started in late August has been strong. But take a look at the price of oil. It has traded very flat during that time indicating the economy has not really picked up, nor does it indicate any growth in the coming months. This rally just may be coming to an end shortly.

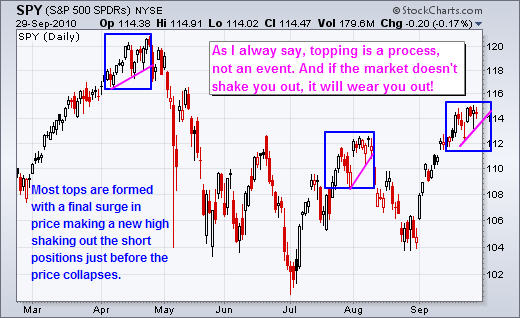
This daily chart of the SP500 fund shows similar topping patterns. This looks to be the last straw for the SP500. Most tops occur with a gap higher or early morning rally reaching new highs, only to see a sharp sell off by the end of the session which generates a reversal day. From the looks of this chart that could happen any day.

In short, volume overall in the market remains light which is why we continue to see higher prices. Light volume typically gives the stock market a positive bias while Sell offs require strong volume to move lower. That being said every dip in the equities market which has been close to a breakdown seems to get lifted back up by a falling dollar, but that can only happen for so long because one the volume steps back into the market the masses will be in control again.

You can get my ETF and Commodity Trading Signals if you become a subscriber of my newsletter. These free reports will continue to come on a weekly basis; however, instead of covering 3-5 investments at a time, I’ll be covering only 1. Newsletter subscribers will be getting more analysis that’s actionable. I’ve also decided to add video analysis as it allows me to get more info across to you quicker and is more educational, and I’ll be covering more of the market to include currencies, bonds and sectors. Before everyone’s emails were answered personally, but now my focus is on building a strong group of traders and they will receive direct personal responses regarding trade ideas and analysis going forward. Due to more analysis and that I want to keep the service personal the price of the service will be going up Oct 1st, so join today.

I also wanted to point out two very powerful trading tools provided by a couple well known traders which you should take a look at.

1. Todd Mitchell is giving away his “Volume Breakout Strategy” at no cost whatsoever! – Get the FreeVolueme Breakout Course – Click Here

2. Mark Skousen has a very interesting video on a unique opportunity in the market. The video is a little long but really interesting. – Just click here to get all the details

Let the volatility and volume return!

Chris Vermeulen
www.TheGoldAndOilGuy.com
Get More Free Reports and Trade Ideas Here for Free: FREE SIGN-UP

We are at the tail of another light volume choppy options expiry week and a big move is brewing… So I thought I would do a mid-week update on what I think is about to unfold in the coming days.

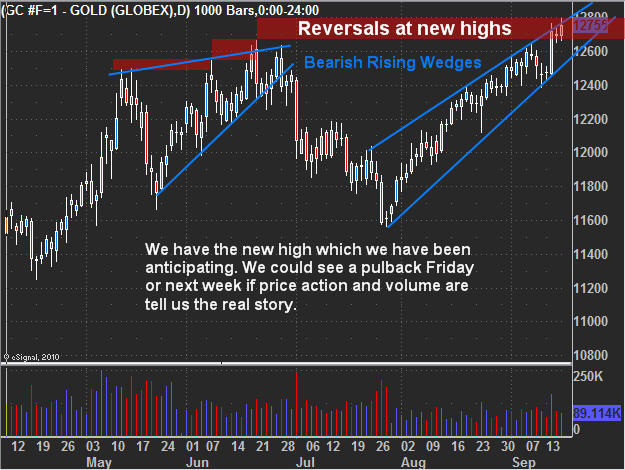
First off I will touch on gold. Everyone is in love with this shiny metal. But as I mentioned last week I think we are nearing a sharp correction. Previously I pointed out that we needed gold to make a new high to the $1275- 1285 area before everyone piles in and gets married to it, only then will the market reverse… Remember the market is out to take money from the masses and the gold trade is getting a little crowded in my opinion.

There are fundamentals which can be taken into account… but when has any investment moved perfectly inline with the underlying fundaments? I’ve seen investments lead fundaments by years, and other times lag the fundamentals by years, not to mention manipulation… but that’s a whole different subject. That being said I don’t hold gold long term for the simple reason I don’t believe much in the buy and hold strategy, nor do I like to watch investments go much more than a few percent against me… I would rather sit in cash jumping in and out when things look ripe for the picking.

Ok let’s jump into the analysis…

Gold Futures Price – Daily Chart

As you can see gold is forming another rising bearish wedge. The last one lead to a $100 drop in gold earlier this year. The part that I find exciting is that this recent run up has been on relatively light volume and without any decent pullbacks along the way. What does that mean? It means fewer people are willing to pay top dollar for it and the big money is riding this train up until they feel its getting exhausted then they will start unloading large amounts at a premium. We also just saw another new high on Thursday which happened on light volume tells me this rally just may have the herd all rounded up before the slaughter.

Silver Futures Price – 15 Minute Intraday Chart

While I don’t trade silver as much as gold due to the added volatility/whipsaw action, this intraday chart is starting to show signs of weakness with a rising bearish wedge today. This is just an intraday chart but these short term patterns tend to lead the longer term charts pointing out exhaustion is starting to creep into the market. Both gold and silver could still have a blow off top and shot up, which is why I have been saying to stay long metals (if you have a position) and to keep raising stop as it could continue higher for some time if a new wave of buyers step in.

Crude Oil – 4 Hour Chart

Oil has been choppy recently making it difficult to get a good read off the chart. Currently it is testing support and looks to be forming a possible right shoulder. It could have some good potential to the down side if we get a neckline break. I’m keeping my eye on it for another low risk entry point.

SP500 ETF – Daily Chart

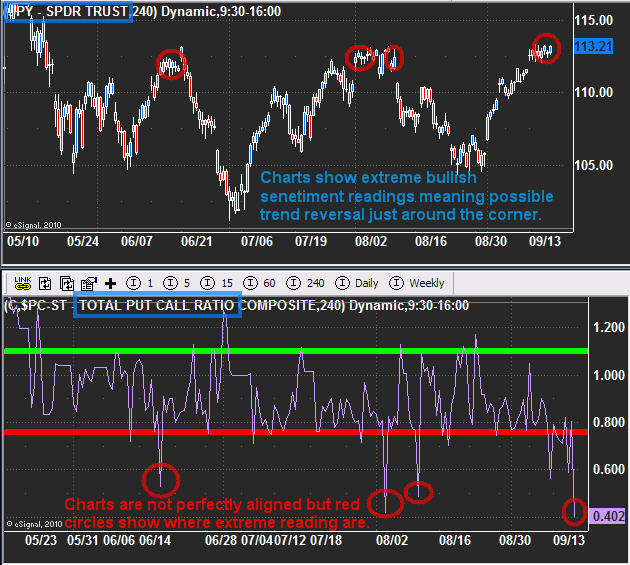
This chart clearly shows some extreme bullish sentiment levels in the market. The bottom indicator is the total put/call ratio and when it is below 0.80 in an environment like this, it means there are too many people bullish on the market. So with todays spike low its easy to tell that the majority of traders/investors are bullish as they buy all the call options they can.

That being said, we generally get a serious shake out before the market reverses. What I mean by that, we should see the market gap substantially higher or spike up intraday as key resistance is broken. This forces all the shorts to cover their positions just before the market rolls over and sells back down. That’s what I am looking for to take action.

Mid-Week Trading Conclusion:

In short, gold and silver are looking and feeling toppy here. While I am bullish on them long term, we could see sharp pullback which could take months to regain these prices. I am not short metals yet but very close to taking a short counter trend trade.

Oil continues to looks bearish but is taking a long time to play out. This is a 4 hour chart and if we do get this neckline breakdown, it would still take 1-2 months to pay off. That being said, it looks like it will go lower.

SP500, I think the chart gets the point across. The important part to know is that it should go another 0.5% – 2% higher before it goes lower as that would make for a perfect pop & drop reversal pattern which I will alert members to when the time comes to short.

You can get my ETF and Commodity Trading Signals if you become a subscriber of my newsletter. These free reports will continue to come on a weekly basis; however, instead of covering 2-4 investments at a time, I’ll be covering only 1. Newsletter subscribers will be getting more analysis that’s actionable. I’ve also decided to add video analysis per customer’s request, and I’ll be covering more of the market to include currencies, bonds and sectors. Before everyone’s emails were answered personally, but now my focus is on building a strong group of traders and they will receive direct personal responses regarding trade ideas and analysis going forward.

Let the volatility and volume return!

Chris Vermeulen
www.TheGoldAndOilGuy.com
Get More Free Reports and Trade Ideas Here for Free: FREE SIGN-UP

Sunday Aug 29th, 2010
Last week was a relatively strong week for stocks and commodities. Although the SP500 closed slightly lower on the week the price action Friday was strong. The recent pop in commodities has everyone feeling good and bullish again and we all know how the market works… When everyone is feeling good the market has a way of shaking things up.

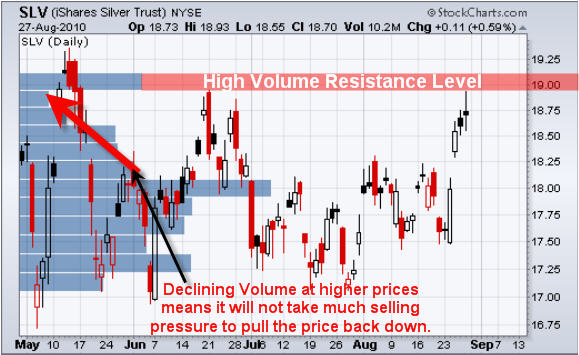
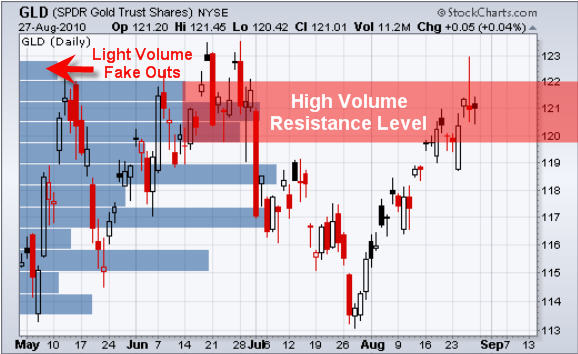
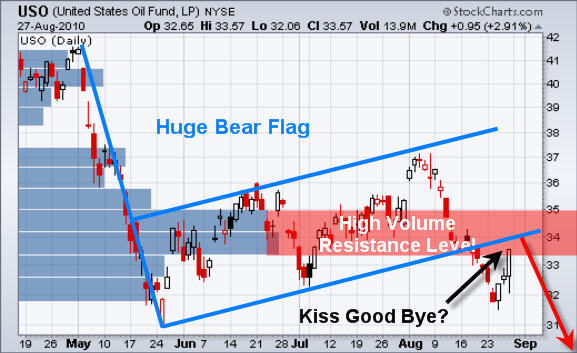
Below are a few charts showing heavy volume resistance levels that will most likely cause the broad market & commodities to pullback or trade sideways for a few days as buyers and sellers play tug-o-war.

SLV – Silver Bullion ETF Trading

Silver had a very nice pop last week but if you step back and look the recent price action you can see that it’s still trading below the previous major bounce from back in June. It looks as though silver is a little over extended as large percentage moves tend to give back 25-50% of the mover shortly after.

Take a look at the price by volume bar. It shows there has been heavy volume traded at that $19.00 level and the previous time it was reached sellers stepped back in pulling silver down.

GLD – Gold Bullion ETF Trading

Gold is trading deep into the resistance level and struggling to hold up. Last week we went long GLD after the bullish engulfing candle and took profits near the high two days later on Thursday’s price. Although gold is trading at resistance the intraday price action remains somewhat bullish/neutral for the time being.

USO – Oil ETF Trading

The oil ETF broke down from its large multi-month bear flag and is now bouncing up to test that breakdown/resistance level. This could be a possible kiss good bye. I will keep my eye on this commodity as it could provide us with a great shorting opportunity in the coming days.

SPY – SP500 ETF Trading

The equities market has been tried to bottom all week and Friday’s price action looks strong. While the chart looks strong the market internals are telling me the opposite. Last week we saw a gap down and Friday that gap window was filled. With heavy volume resistance just above the current price the odds are pointing to lower prices.

Weekend Equities and Commodities ETF Trading Report:

In short, it looks as though everything is trading just under or at resistance levels. That means sellers will start to enter the market and cause prices to stall (trade sideways/choppy) and or reverse lower.

That being said, with Friday’s strong close for oil and the sp500 I am expecting a gap higher in the morning because traders will review those charts this weekend and enter the market Monday feeling bullish.

If you would like to get my ETF Trade Alerts for Low Risk Setups checkout my service at: www.TheGoldAndOilGuy.com/specialoffer/signup.html

Chris Vermeulen

Trading commodities and indexes through the use of exchange traded funds sure keeps things simple for an average trader. These funds allow individual investors to buy and sell things like gold, silver, oil, the sp500 and other investments which where not available only few months ago like “wheat” for example.

One of the nice things with ETFs is that is allows everyone to follow the price of a commodity or index using any charting website and can even apply indicators to help spot key support and resistance levels using volume by price analysis. There is no need for a expensive data feeds, charting programs and you don’t have to worry about contract expiration.

Below are a few charts of the trend and my short term forecast.

GLD – Gold Bullion ETF

As you can see gold broke out of its support zone this week and popped into the next resistance level. This is very typical price action in the stock market. It is important to look at the price charts like an apartment building. It’s nothing but a bunch of floors and ceilings.

How it works; if a ball breaks though a floor it will naturally fall to the next floor and bounce. The same for if a ball breaks through a ceiling, it will hit the next ceiling then bounce back down. This is essentially how the market moves.

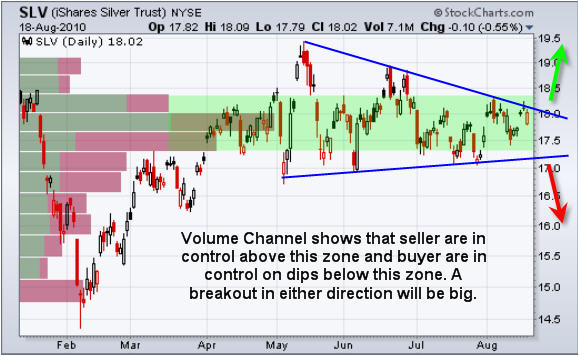
SLV – Silver ETF

Silver is forming a large pennant and nearing its apex. With the amount of volume traded within this large volume channel I would expect a sharp breakout once a direction is made.

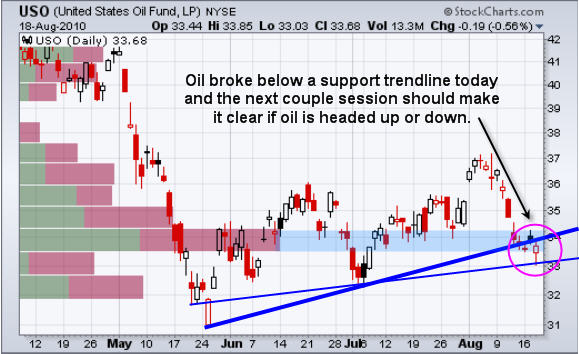
USO – Oil Traded Fund

Crude oil had a funky day. Early Wednesday morning in pre-market trading we saw virtually every investment drop at the same time which was strange. Anyways the US dollar dropped sharply and oil when down also. Normally as the dollar drops oil rockets higher but that was not the case today.

Currently oil is trading between two trendlines and is trying to hold up. If we get a breakdown then we could see a sharp drop in oil over the next 1-2 weeks.

SPY- SP500 ETF Trading Fund

The SP500 is trading within a high volume channel, similar to silver. Once a breakout in either direction is made I would expect a sizable move lasting a few w

Mid-Week Commodity and Index ETF Report:

In short, the market looks bearish for the short term of 5-10 trading sessions. This is because everything looks to be trading near resistance levels. That naturally brings sellers out of the woodwork putting pressure on prices.

Silver and gold stocks tend to lead the metals sector on breakouts so it will be important to keep an eye on them as we near a possible breakout or breakdown in the metals. If you see SLV or GDX ETFs out performing the GLD gold fund by 2-3x then I would expect to see gold move higher later that session or the following day.

The US dollar trend usually helps to identify if oil will have downward pressure or not. Also energy stocks tend to lead the price of oil by a few hours and some times a day. I keep an eye on XLE energy etf for a feel of how the energy stocks are doing and also UUP US dollar fund.

As for equities tech, financials and the Russell 2K (small cap stock) tend to lead the way for the broad market. Watching XLK, XLF and IWM help to confirm breakouts.

If you would like to Get My Trading Analysis and Alerts please join my free newsletter at: www.TheGoldAndOilGuy.com

Chris Vermeulen

Sunday Aug 15
Last week was exciting as investments rocketed higher or tank… We saw Gold and the US Dollar pop while oil and equities dropped sharply with heavy volume.

Just to recap, Wednesday the market went into free-fall mode sending traders and investors running for the door. This was obvious from looking at the large percent drop coupled with heavy selling. That day the NYSE showed panic selling with 37 shares sold for every 1 share purchased meaning pure panic. In my Wednesday night report “How to Take Advantage of Panic Selling for SP500 and Gold ” I explained how to read these extreme market conditions and what to expect the following sessions.

Currently the price of gold, oil, spx are trading somewhat at the opposite extremes seen last week. Below are a few charts explaining the situations:

GLD – Gold ETF Trading Signals

This 60 minute chart shows gold getting hit hard on Wednesday morning. Investors and traders around the globe were closing out positions and moving to cash. This high volume dumping of positions pulled virtually all investments lower and was the first tip-off that the market was in panic mode.

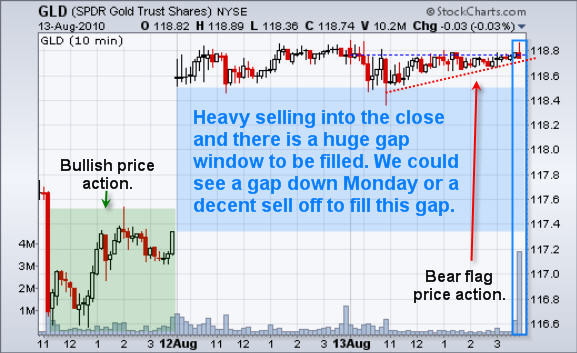
One the dust settled and investor’s regrouped we saw money surge back into gold creating a nice pop the following day. Problem I see is that gold is now trading at a key resistance level when reviewing the daily chart. And if you take a look at the 60 minute chart below you can see the price of gold sold down in the morning on August 13th and drifted up into the close on Friday forming a bearish wedge. Also there was some very strong selling just before the market closed which is also a concern.

USO – Oil Traded Fund

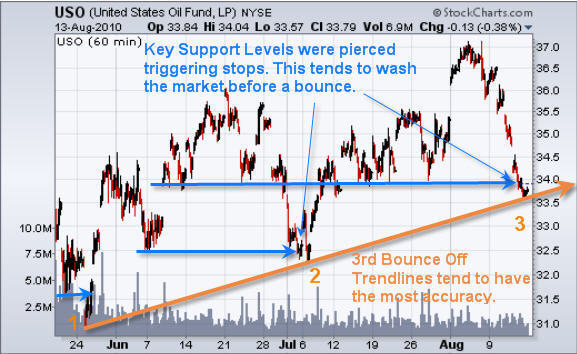
Both times oil has fallen we have seen the price pierce key support levels where the bulls would have the majority of their stops placed. The intraday pierce causes the stops to be triggered washing the market of long positions while the smart money loads up accumulating everyone’s sell orders . This is something which happens with virtually every type of investment and the main reason traders get shaken out just before the market goes in their direction. Anyways, running of the stops is something I will cover in a future report.

Looking at the chart below you can see oil trading at trendline support. Each time the key support levels (blue arrows) have been pierced the market has rocketed higher. Just from looking at the chart from August 9th forward you can see that this move down is overextended and visually looks ready for a pause or bounce in the coming days.

*Trading Tidbit – When trading trendlines it is important to try and play the third test. Reason being is that the first two pullbacks create the trendline and the third test is when active traders generally jump on board causing a sizable bounce. Each test of a trendline it becomes weaker and the probability of a breakdown is more likely.*

SPY – SP500 ETF Trading Fund

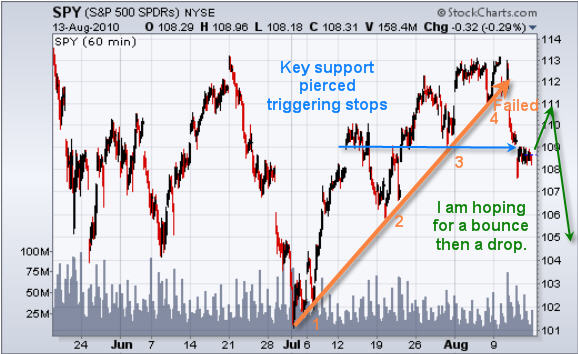
The SP500 chart shows last week’s breakdown on the 5th test of the trendline. The market is oversold here and ready for a bounce which I hope we get this week. My concern is that the downward momentum is to strong and a bounce will be negated.

US Dollar Index

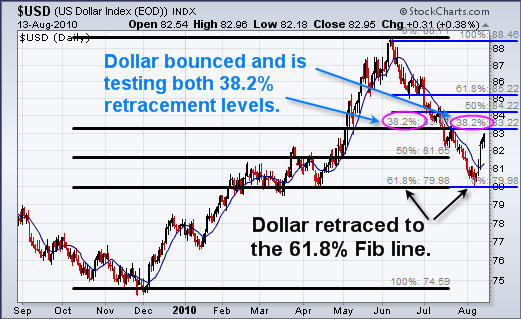
US dollar put in a huge bounce last week after testing is 61.8% Fib retracement level from the 2009 December low. The strong bounce has pushed the dollar up to a key resistance level which happens to be 38.2% Fib retracement level from both the December up trend and the recent sell off. I figure this will hold the dollar down for a few days easing the pressure on oil and equities.

Weekend Gold, Oil, SPX and Dollar Trading Conclusion:

In short, I feel there will be a relief bounce in oil and equities while the dollar and gold will have some profit taking and trade sideways or down at the beginning of the week. After that it looks as though stocks and oil will head lower while the dollar and gold rally.

If you would like to receive my Trading Analysis and Signals Complete with Entry, Targets and Protective Stops please visit my website at: www.TheGoldAndOilGuy.com
Chris Vermeulen

JOIN MY FREE NEWSLETTER AND STAY AHEAD OF THE MARKET

Did you close out any long positions today? Well if not then you are one of a few!

Today (Wednesday) the market gapped down 1.5% at the opening bell which set a very negative tone for the session. Volume was screaming as protective stops triggered and traders close out positions before prices fell much further. This gap seemed to have caught several traders off guard but those of you who follow my newsletter knew something big was brewing and to keep positions very small.

Just before the close on Tuesday I had a buy signal for the SP500 which was generated from the extreme readings on the market internals. After watching the market chop around and get squeezed into the apex of the rising wedge the past 3 weeks I knew something big was about to happen and I did not want to get everyone involved because I felt a large gap was about to happen and the odds were 50/50. Instead we passed on the technical buy signal and waited to see what would happen Wednesday.

Below are a few charts showing one of my extreme reading indicators I use which helps me to identify possible short term bottoms.

SP500 – SPY Exchange Traded Fund

This daily chart of the SPY etf clearly shows that when we see panic selling in the NYSE which I consider 15+ sell orders to each buy order to be PANIC SELLING. This is shown using the purple indicator at the bottom of the chart. Today there was an average of 37 sell orders to every buy order which tells me the majority of traders are closing out all their long positions.

In an uptrend this indicator works very well and can help time a bottom within 1-4 days. As you can see on the chart below we just had a huge sell off and everyone seemed to be exiting their positions. This panic selling tends to carry over for a couple sessions until the majority of traders around the globe are finished selling.

The problem with this indicator is that in a down trend we tend to get these panic selling spikes regularly which means this time it may not work out because of the trendline break today which I think has officially changed the trend from up to down. Because of this possible down trend starting I feel its best to wait and see if it’s a dead cat bounce or if there are real buyers behind it, then we will take action to go long or short the market.

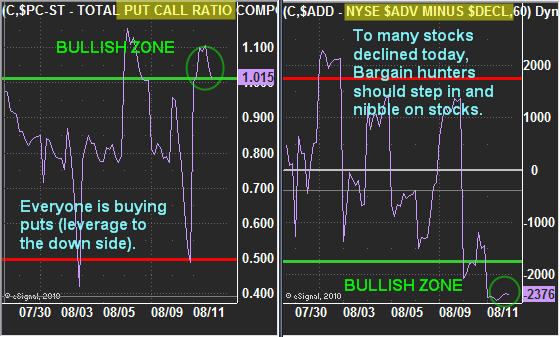
Market Internals – Put/Call Ratio & NYSE Advance/Decline Line – 60 Min Charts

Here are two charts which are currently at extreme levels. This typically means we a bounce should occur the following day or a gap higher. If you did not know there was a strong trendline breakdown today you most likely would have taking a small long position into the close.

The Put/Call ratio when above 1.00 means more people are buying put options, meaning they are leveraging themselves to make money if the market drops. As a contrarian indicator, if everyone is buying leverage to the down side then they should have sold their long positions already. That would mean most of the selling has already taken place in the market thus it should have some upward bias in the near term.

On the other side you can see the NYSE A/D line which shows how many stocks on the NYSE are advancing and how many have moved lower. When this indicator is below -1750 then we know the market is oversold on a short term basis and there should be some upward bias in the near future.

Now Lets Take A Look At Gold

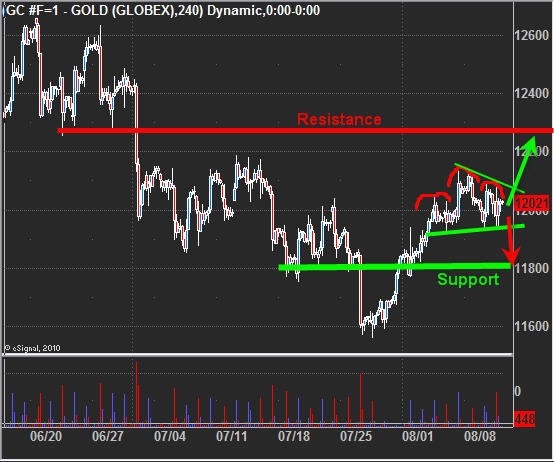
Gold was left on the side of the road today as traders and investors focused on the equities market. I was actually a little surprised that it didn’t make a big move today because the US Dollar rocketed higher for the entire session. Anyone who has been watching gold closely already knows that gold is doing its own thing now… Some days it moves with the dollar, other days it does not… its become much more random than it used to be.

Anyways it looks to be forming two patterns… first one is a bull flag. If a breakout to the upside occurs that would send gold to the $1230-40 level.

The second pattern is a mini head and shoulders pattern which would send gold down to the $1180 area if the neck line is violated. It is a very tough call for gold.

Mid-Week Technical Traders Update:

In short, it’s going to take a day or two before we get a feel for the SP500 as we wait to see if it bounces with volume behind it. I personally would like a bounce so we can short it. It is unfortunate how the market broke down today. We were so close to getting a really good setup in either direction but the FOMC meeting shook things up and caused the large gap which in turn made a large group of traders miss that beautiful drop… It’s frustrating when you wait for something only to have a piece of news mess things up. That’s just part of trading though.

As for gold, I feel it’s a 50/50 trade and could go either way so I am not going to take a position right now. I’m just going to wait for the market to tip its hand a little more before I jump.

I hope you found this information useful. If you would like to receive these trading reports, updates and ETF alerts be sure to visit my service at: www.TheGoldAndOilGuy.com
Chris Vermeulen

GET THESE REPORTS IN YOUR INBOX

August 8th
I find it amazing how many traders do not use volume as a factor in their trading decisions. I believe it’s always important to track the volume no matter which time frame you are trading simply because it tell you how much interest there is for that investment at that given time and price level. If you use volume and understand how to read it when located at the bottom of the chart which is the standard way of reading it then your well ahead of many traders and just may find this little volume indicator helpful.

Price and volume are the two most important aspects of trading in my opinion. While news and geopolitical events cause daily blips and in rare occasions change the overall trend of an investment, more times than not its better to just trade the underlying trend. Most news and events cannot be predicted so focusing on the price action and volume helps tell us if investors are bullish or bearish for any given investment.

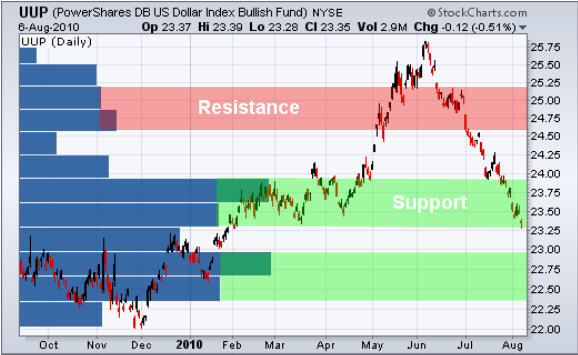
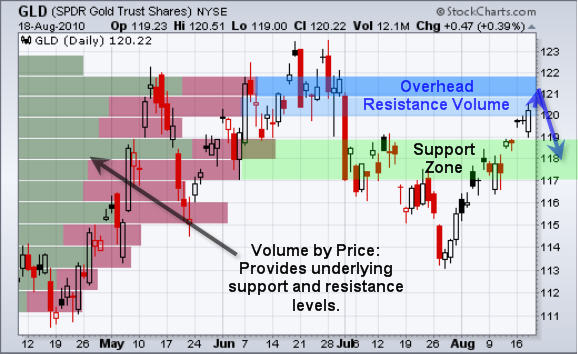
Below are a few charts showing the volume by price indicator in use. Reading this indicator is simple, the longer the blue bars the more volume had traded at that point. High volume levels become key support and resistance levels.

SPY – SP500 Exchange Traded Fund

As you can see on the chart below and I have pointed out key support and resistance levels using the volume by price indicator. The thin red resistance levels would be areas which I would be tightening my stops and or pulling some money off the table.

The SP500 is currently trading at the apex of this wedge. The market internals as of Friday were still giving a bullish bias which should bring the index up to resistance once more on Monday or Tuesday. From there we will have to see if we get another wave of heavy selling or a breakout to the upside.

GLD – Gold Exchange Traded Fund

Gold has the opposite volume to price action as the SP500. We are seeing a lot more over head resistance and that’s going to make it tough for gold to make a new high any time soon.

USO – Crude Oil Trading Fund

Crude oil broke out of is rising wedge last week and has started to drift back down as traders take profits. Many times after a breakout we will see prices dip down and test that breakout level before continuing in the trend of the breakout. I should point out that there is a large gap to be filled from last Monday’s pop in price and we all know most gaps tend to get filled.

UUP – US Dollar Exchange Traded Fund

The dollar has been sliding the past 2 months and it’s now trading at the bottom of a major support level. If the dollar starts to bounce it will put some downward pressure on stocks and commodities.

Weekend ETF Trend Conclusion:

In short, I feel the market has a little more life left in it. I’m expecting 1-2 more days of bullish/sideways price action, after that we could see the market roll over hard. It’s very likely the US dollar starts a significant rally which will pull stocks and commodities down.

With the major indices and gold trading at key resistance levels, traders/investors ready to hit the sell button, and the dollar at a key support level I think its only a matter of time before we see a sharp snapback. That being said there is one scenario which is bullish and could still play out. That would be if the US dollar starts to flag and drift sideways for a week or so, and for stocks and commodities to also move sideways before taking another run higher. Watching the intraday price and volume action will help us figure out if buyers are sellers are in control this week. Anyways that’s it for now.

If you would like to receive my ETF Trading Alerts visit my website at: http://www.thegoldandoilguy.com/specialoffer/signup.html

Chris Vermeulen

GET THESE REPORTS SENT TO YOUR INBOX FREE

Wednesday August 4th
Commodities have been shining recently as the US Dollar loses its luster for investors. Also the weakening dollar has helped boost equities as a lower US dollar helps the large multi national companies. This report is a quick follow up from the Weekend report showing what the odds were favoring which was higher gold, oil and sp500. As of today each investment is unfolding as planned, once candle at a time.

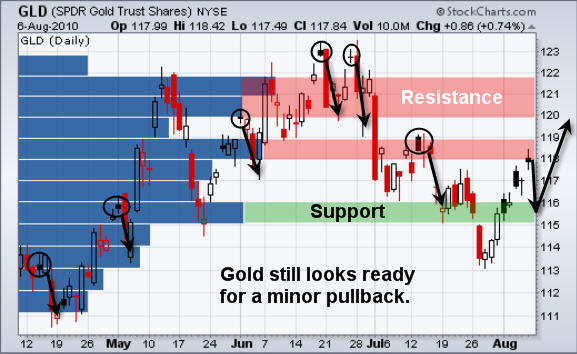
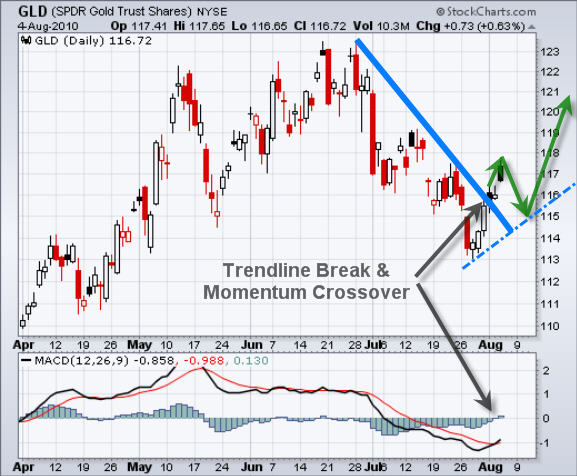
GLD – Gold ETF Trading

In my last report I pointed out how gold needed to break through its down trendline, the MACD had to crossover and then we needed to wait for a pullback which ends with a reversal candle to the upside. It seems gold is working its way through that process now.

Today’s Pop & Drop is not bullish price action and I expect we see a couple more down/sideways days before higher prices are reached. There are two bullish ways gold could pullback. First one would be a drop to $115 area with below average volume which could form the right shoulder of a reverse head & shoulders pattern, or we could see prices just fade sideways on light volume for 2-4 days before another up move starts.

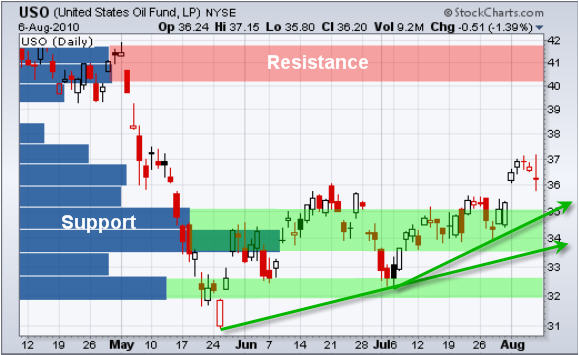
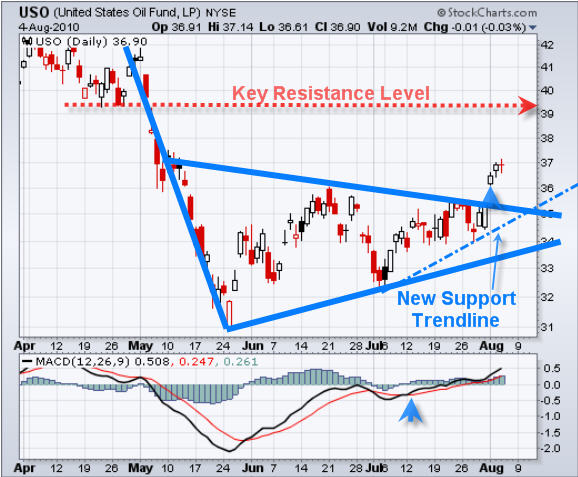
USO – Oil Trading Fund

Oil just had a 3 day pop and with today’s doji candle the chart is saying it needs a breather. That also falls inline with the price of the US dollar which should continue higher tomorrow (Thursday Aug 5th) putting downward pressure on crude oil.

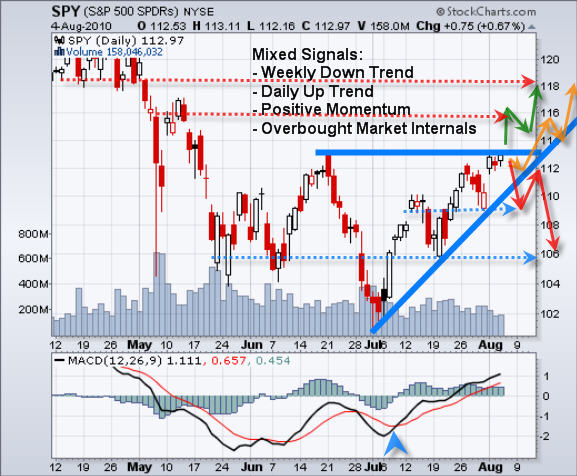
SPY – SP500 ETF Trading Signals

SP500 had a nice pop on Monday taking it up to the first key resistance level. The best play would have been to buy last Thursday or Friday when it dropped down to support unfortunately the intraday charts at that time were not that healthy looking.

I am not a fan of trading breakouts because so many of them fail and you end up paying a premium for your position and they can end up going against you very quickly. Rather I focus on trying to pick things up at support or sell them at resistance.

If we see the price pause for another 1-4 days on light volume and hold above the support trendline we could have a great low risk entry point with a stop set just below support. Or we could see a pop then pullback to test the breakout level as which point we can take a long position. This play needs to mature a little more.

Mid-Week Gold, Oil and Index Trading Conclusion:

In short, Gold, Oil and the SP500 look ready for a small pullback or some sideways price action. It will be interesting to see how strong the pullback will be on the SP500. The chart pattern and volume while they favor higher prices at the moment, if the support trendline is breached then selling volume will most likely spike and a sharp decline will occur causing the SP500 to drop approximately 3% all the way down to the $109 area.

Well, that’s it for now. If you would like to test out my trading service which has a 30 day money back guarantee visit my site at: www.TheGoldAndOilGuy.com
Chris Vermeulen