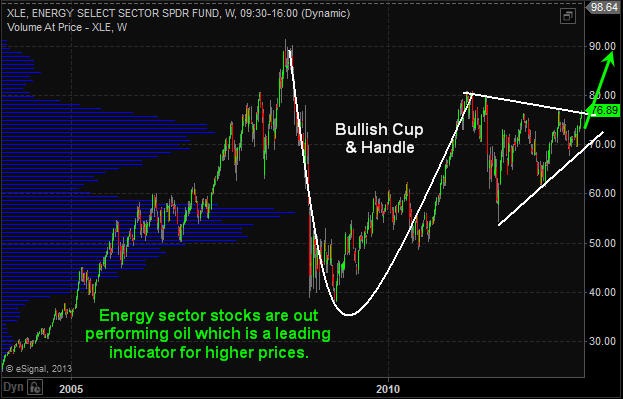
The energy sector has surged during the last two months which can be seen by looking at the XLE Energy Select Sector Fund. If crude oil continues to climb to the $112 level, XLE will likely continue to rally for another few days or possibly week as energy stocks are considered a leveraged way to play energy price movements.

Another way to look at this info is through the USO United States Oil Fund. This tracks much closer to the price of oil. The only issue is that many ETFs that “try to track” an underlying commodity is in how the funds are built. They own multiple contracts further into the future which does not exactly provide us with the short term news/event driven price movements in the current front month contract as they should.

What does this mumbo jumbo mean? Well, it means funds like USO and the highly respected UNG, and VIX ETFs… (just joking about the highly respected part), fail to track the underlying commodity or index very well when it comes to short term price movements. This means, you can nail the timing of a trade, and the commodity or index will move in your favor, yet your fund loses money, or goes nowhere…

Let’s Focus on the Technicals Now…

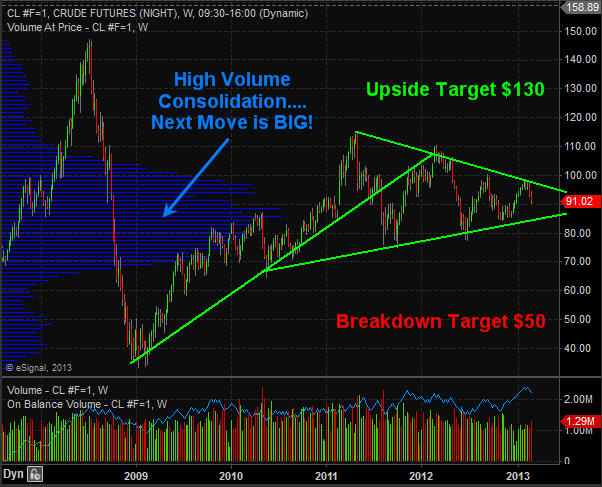
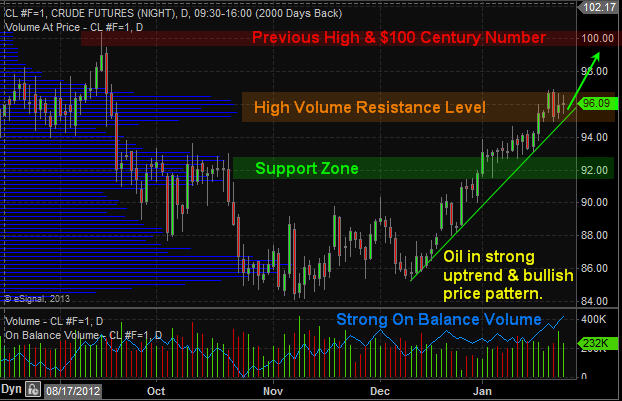
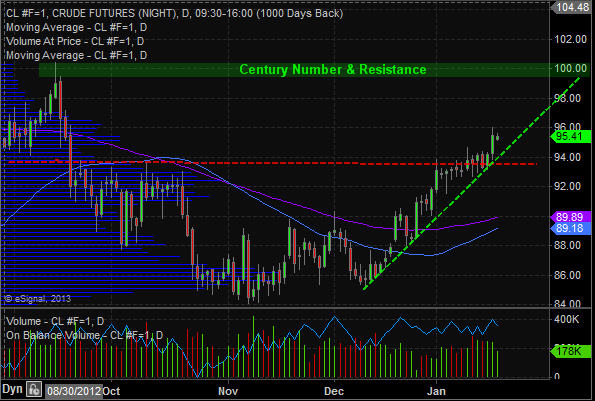
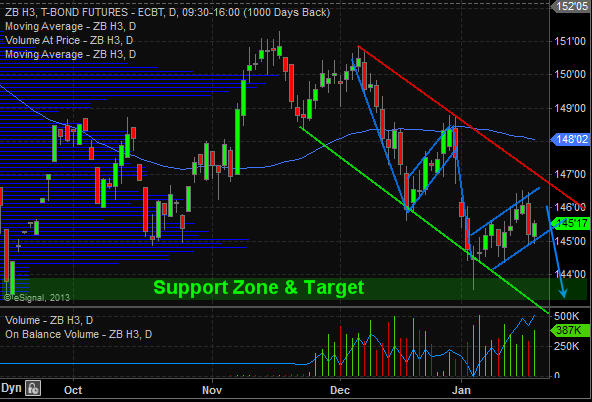
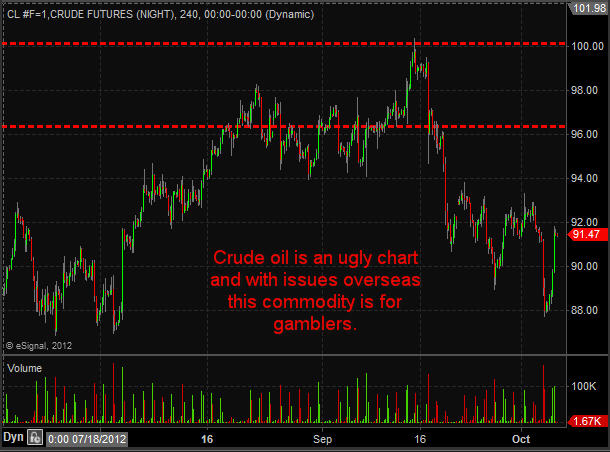
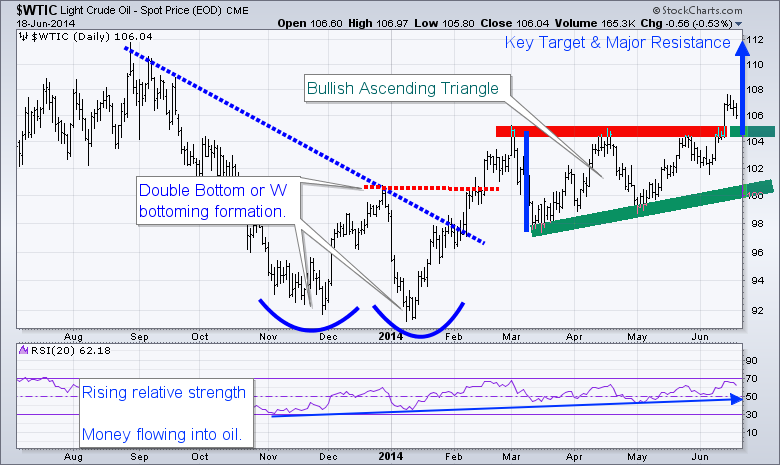
WTI crude oil has formed a bullish ascending triangle pattern from March to May of this year. The breakout to the upside is bullish and should be traded that way until the chart says otherwise. This breakout and first pullback must hold, or I will consider it a failed breakout. So if price dips and closes 2 days below the breakout level, it will be a major negative for oil in my opinion.

The range of the ascending triangle provides us with a measured move to the upside which is $112. Typically the first pullback after a breakout can be bought. The first short term target to scalp some gains would be $109, and at that point moving your stop to breakeven is a wise decision. Trading is all about managing capital and risk, if you don’t, then the market will take advantage of your lack in discipline.

Looking further back on the chart, you can see the double bottom formation also known as a “W” formation. Once the high of the “W” formation is broken the trend should be considered neural or up.

Also note that the RSI (relative strength) has been trending higher for some time now. This means money is rotating into this commodity. This is in line with my interview this week with Kerry Lutz and my recent article talking about the next bull market in commodities and the TSX (Toronto Stock Exchange).

clfutures

WTI Crude Oil Trading Conclusion:

In short, oil has some extra risk around it. The recent move has been partly fueled by news overseas. So at any time oil could get a lift or take a hit by news that hits the wires. I tent to trade news related events with much less capital than I normally do because of this risk.

Happy Trading!

WANT MORE TRADE IDEAS?
GET THEM HERE: WWW.THEGOLDANDOILGUY.COM


Chris Vermeulen
CEO & Founder
AlgoTrades.net
TheGoldAndOilGuy.com


Over the past year my long term trends and outlooks have not changed for gold, oil or the SP500. Though there has been a lot of sideways price action to keep everyone one their toes and focused on the short term charts.

As we all know if the market does not shake you out, it will wait you out, and sometimes it will do both. So stepping back to review the bigger picture each weeks is crucial in keeping a level trading/investing strategy in motion.

The key to investing success is to always trade with the long term trend and stick with it until price and volume clearly signals a reversal/down trend. Doing this means you truly never catch the market top nor do you catch market bottoms. But the important thing is that you do catch the low risk trending stage of an investment (stage 2 – Bull Market, Stage 4 Bear Market).

Lets take a look at the charts and see where prices stand in the grand scheme of things…

Gold Weekly Futures Trading Chart:

Last week to talk about about how precious metals are nearing a major tipping point and to be aware of those levels because the next move is likely to be huge and you do not want to miss it.

Overall gold and silver remain in a secular bull market and has gone through many similar pauses to what we are watching unfold over the past year. As mentioned above the gold market looks to be trying to not only shake investors out but to wait them out also with this 18 month volatile sideways trend.

A lot of gold bugs, gold and stock investors of mining stocks are starting to give up which can been seen in the price and selling volume for these investments recently. I am a contrarian in nature so when I see the masses running for the door I start to become interested in what everyone is unloading at bargain prices.

Gold is now entering an oversold panic selling phase which happens to be at major long term support. This bodes well for a strong bounce or start of a new bull market leg higher for this shiny metal. If gold breaks below $1500 – 1530 levels it could trigger a bear market for precious metals but until then I’m bullish at this price. I think we could see another spike lower in gold to test the $1500- $1530 level this week but after that it could be off to the races to new highs.

GoldWeekly


Crude Oil Weekly Trading Chart:

Oil had a huge bull market from 2009 until 2011 but since then has been trading sideways in a narrowing bullish range. I expect some big moves this year for oil and technical analysis puts the odds on higher prices. If we do get a breakout and rally then $130 will likely be reached. But if price breaks down then a sharp drop to $50 per barrel looks likely.

OilWeekly

Utility & Energy Stocks – XLU – XLE – Weekly Investing Chart

The utility sector has done well and continues to look very bullish for 2013. This high dividend paying sector is liked by many and the price action speaks for its self… If the overall financial market starts to peak then these sectors should hold up well because they are services, dividend and a commodity play wrapped in one.

XLURally

XLERally


SP500 Trend Daily Chart:

The SP500 continues to be in an uptrend which I am trading with until price and volume tell me otherwise. But there are some early warning signs that another correction or a full blown bear market may be just around the corner.

Again, sticking with the uptrend is key, but knowing what to look for and prepare for is important so that when the trend does change your transition from long positions to short positions is a simple measured move in your portfolios.

SPYTrend


Weekend Trend Conclusion:

In short, I remain bullish on stocks and commodity related stocks until I see a trend change in the SP500.

Energy sector is doing well and looks bullish for the next month. As for gold and gold miners, I feel they are entering a low risk entry point to start building a new long position. Risk is low compared to potential reward.

When the price of a commodity or index trade near the apex of a narrowing range or major long term support/resistance level volatility typically increases as fear and greed become heightened which creates larger daily price swings. So be prepared for some turbulence in the coming weeks while the market shakes things up.

If you like my work then be sure to get on my free mailing list to get these each week on various investments for investment ideas at www.GoldAndOilGuy.com

Chris Vermeulen

Crude oil has been trading ways for the past year between the 2011 high and low. The trading range through 2012 has been contracting with a series of lower highs and higher lows. This pennant formation because it is taking place after an uptrend is a bullish pattern with $110 and possibly even $140+ per barrel in the next 6-18 months.

If you look at the weekly investing chart of crude oil the key support and resistance levels area clearly marked. A breakout of the white pennant will trigger a move to the next support or resistance level. And judging from the positive economic numbers not only form the USA but globally the odds are increased for the $110+ price target to be reached sooner than later.

Crude Oil Price Chart – Weekly Investing

Oil Investing


Crude Oil Price Chart – Daily short term Analysis & Target

If we zoom into the daily chart and analyze price and volume you will notice the $100 per barrel level is potentially only 2-3 days way… But keep in mind whole numbers (decade & Century Numbers) naturally act as support and resistance levels. So when the $100 century price is reached there will be a wave of sellers with fat thumbs who will slam the price back down to the $96 and possibly back down to the $92 level before oil continues higher.

Oil Trading


Utility Stocks – XLU – Weekly Investing Chart

The utility sector has done well and continues to look very bullish for 2013. This high dividend paying sector is liked by many and the price action speaks for its self… Keep in mind you can view my actual watchlist of stock and ETFs I trade in real-time with my analysis free: https://stockcharts.com/public/1992897

XLU Trading


Energy Sector Weekly Investing Chart

Energy stocks which can be followed using the XLE exchange traded fund (ETF) typically leads the price of oil. Looking at energy stocks we can see that they are outperforming the price of crude oil and on the verge of breaking out of a large Cup & Handle pattern. If so then $90 is the next stop but prices may go much higher in the long run.

XLE Energy Stock Trading


Energy Stocks and Crude Oil Conclusion:

In short, crude oil is stuck in a large trading range much like gold and silver which I just wrote about here: http://www.thegoldandoilguy.com/precious-metals-miners-making-waves-and-new-trends/

Once a breakout takes place on either the white or yellow lines on the first crude oil weekly chart we should see oil, energy and utility stocks start making some big moves. Depending on the direction of the breakout (Up or Down) it must be played in that direction to generate substantial profits obviously.

Get my daily analysis, updates and trade alerts here: www.TheGoldAndOilGuy.com

Chris Vermeulen

US stock market is closed today for Martin Luther King, Jr. Day. I do not expect much price action to take place on the Canadian or futures market today.

Pre-Market Analysis Points:
– Dollar index is giving mixed signals this week. Short term chart looks bullish for another couple of days but overall it is trading within a large bear flag and near resistance.

– Crude oil is trading lower by -0.50% but remains in a strong uptrend and bull flag. $97-$98 looks like the next upward thrust target.

– Natural gas is trading higher 0.87% touching our upside target of $3.60 this morning. It could keep climbing to $3.70 which is the next target but it looks as though its ready for a pause.

– Gold and Silver are trading flat. Last week they held up at resistance but have yet to breakout. They could do it this week but until we the trend shifts with volume to support the move and miners to also show strength I will remain on the sideline.

– Bonds are trading flat and giving off mixed signals much. The 60 minute chart is bullish with a bull flag, while the daily chart is bearish.

– SP500 index remains in a bull market grinding its way higher each week without a decent pausepullback to get long. Technically we could see a 3-4% pullback any day and the market would remain in an uptrend.

Chris Vermeulen – www.TheGoldAndOilGuy.com

Dollar index 4 hour chart is forming a bear flag. Until the lower blue support line is broken the flag will continue higher.

Jan18DX

Crude oil has a big pop yesterday as it continues up its support trend line. It looks as though it may take a run at the $100 per barrel level over the next 1-2 weeks.

Jan18CL

Natural gas had bullish inventory numbers yesterday sending the price sharply higher. It tagged our $4.50 resistance price but could not close above it. This morning it is trading above that level and may confirm a breakout.

Jan18NG

Gold continues in a clear down trend with high volume resistance, down trend line and a moving average holding it down. It seems everyone is turning bullish here on gold, but in my contrarian view that is signaling another short term top. Stick with the trend until proven wrong.

Jan18GC

Silver is trading similar to gold. Still in a down trend but is much more volatile.

Jan18SI

Bonds have been pullback since the December and have formed a falling channel. Price remains bearish which is actually bullish for the stock market.

Jan18ZB

SP500 index continues its uptrend but is trading at a 2% premium above my key support/trend moving average. The SP500 has the potential to drop 2-4% at any time and if so we will be looking to get long with the overall trend.

Jan18SPY


Morning Market Conclusion:

Each month on average the broad market provides a pullback that signals a broad market entry point. During an entry point you can get long the index, sectors or stocks, and trade options which have formed bullish chart/volume patterns. Unfortunately the last batch of signals that took place was just before the fiscal cliff which we passed on taking because price could have gone either way based on the outcome and the move was going to be big. When Risk is higher I tend to steer clear of entry points.

So now we just have to wait for the next broad market pullback to start building long positions in various ETFs.

Chris Vermeulen – www.TheGoldAndOilGuy.com

Good Morning,
Yesterday’s trading session played out exactly as posted in the morning chart update. Today will be a different story from the looks of it as the dollar index looks to be putting in a bottom and that has the SP500 down 0.40% this morning. It may trigger our first entry point to let long stocks today.

Dollar Index:

SP500 Futures:

Natural gas has been holding up well the past two sessions and looks as though it is forming a cup and handle pattern at the $3.40 level. The first upside target would be $3.50 then $3.60.

Crude oil has been trading sideways/higher the past week but the on balance volume clearly shows sellers are unloading contracts at the $94 level. Yesterday I talked about how crude oil was walking a fine line up its support trend line and once that breaks look out! Price is holding up but be aware it could drop fast and hard any day here.

Gold and silver traded higher yesterday while the miners lagged. This is not a bullish sign for the metals. The trend remains down and we need a clean break before getting long.

Bonds continue to their march higher as expected and this type of price action points to lower stock prices. This morning stocks are set to gap sharply lower confirming money is rolling back into the safe haven (bonds) for protection from falling share prices.

Be sure to follow my trades at www.TheGoldAndOilGuy.com and my free watchlist: https://stockcharts.com/public/1992897

Chris Vermeulen

Chris Vermeulen – www.TheGoldAndOilGuy.com

Oil and gas along with their equities have been underperforming for the most part of 2012 and they are still under heavy selling pressure.

I watch the oil futures chart very closely for price and volume action. And the one thing that is clear for oil is that big sellers are still unloading copious amounts of contracts which is keeping the price from moving higher. Oil is trading in a very large range and is trending its way back down the lower reversal zone currently. Once price reverses back up and starts heading towards the $100 and $105 levels it will trigger strong buying across the entire energy sector.

Crude Oil, Energy & Utility Sector Chart – Weekly Time Frame

The chart below shows the light crude oil price along with the energy and utilities sectors. The patterns on the chart are clearly pointing to higher prices but the price of oil must shows signs of strength before that will happen. Once XLE & XLU prices break above their upper resistance levels (blue dotted line) they should takeoff and provide double digit returns.

Oil Sector Trading XLU XLE

Looking at the XLU utilities sector above I am sure you noticed the steady rise in the price the last couple of years. This was a result in the low interest rates in bond price and a shift from investors looking for higher yields for their money. Utility stocks carry below average risk in the world of equities and pay out a steady and healthy dividend year after year. So this is where long term investment capital has/is being parked for the time being.


Utility Stock Sector – Deeper Look – 2 Hour Candle Chart Time Frame

Last week I covered utility stocks in detail showing you the Stage 1 – Accumulation base which they had formed. The chart below shows the recent price action on the 2 hour candle chart and recent run up. You can learn more about how to take advantage of this sector here: http://www.thegoldandoilguy.com/its-the-season-to-own-utility-stocks/

Utilities Sector Trading XLU


Oil and Gas Services – Daily Time Frame

This chart shows a very bullish picture for the services along with its relative strength to oil (USO) at the bottom. While the sector looks a little overbought here on the short term chart, overall it’s pointing to much higher prices.

Oil Gas Services XES


Energy Sector Conclusion:

In short, crude oil looks to be trading in a VERY large range without any sign a breakout above or below its channel lines for several months at the minimum. But if the lower channel line is reached and oil starts to trend up then these energy related sector ETFs should post some very large gains and should not be ignored.

Get These Weekly Trade/Investment Ideas In Your Inbox FREE: www.TheGoldAndOilGuy.com

Chris Vermeulen

Over the past two months shares of gold (NYSE:GLD) and Apple (NASD:AAPL) have had a sizable bite taken out of their share price. Active traders along with the longer term investors have had a wild ride this fall watching these investments slide to multi month lows. The big question is when will gold and apple shares bounce?

Here we are again with another election behind us and Barack Obama in the White House again. Many think this means four years of the same thing… Printing, Inflation and higher stock prices.

Is this good or bad for Americans or the world for that matter? I doubt it, but who really knows and who cares because there is nothing anyone can do about it now. So buckle up your seat belt and focus on trading and investing with major trend both within the United States and abroad using exchange traded funds.

Currently the broad stock market and commodities are in a full blown bull market so the focus should be to buy the dips until proven wrong. Below are some charts showing the important breakout levels for Apple, metals, oil and key indexes like the Russell 2000.

Be aware that during pullbacks which last more than a month which is the market has done, some of the biggest drops in price happen just before prices bottom… Scaling into positions is the key to minimal draw downs.


Apple Inc. – AAPL Stock Chart:

Shares of Apple clearly show the down channel which must be broken before investors start buying again. This stock seems to have big potential for $650 to be reached quickly. If Apple shares rise so will the overall stock market… Follow my live charts free here: http://stockcharts.com/public/1992897

AAPL - Apple Shares


Gold Spot – GLD Exchange Traded Fund:

During August and September investors flooded the gold market in anticipation of QE3. Since then gold has been drifting lower with profit taking and because of some slowly strengthening economic numbers in the USA. Gold looks ready for a run to the $1800 but may stabilize here for a few weeks first.

Gold Breakout


Silver Spot – SLV Exchange Traded Fund:

The price of silver moves similar to that of its big yellow sister (Gold). While the charts look the same silver is highly volatile and can super charge your portfolio when metals rally.


Crude Oil Spot – USO Fund:

Crude oil has been correcting for a couple months also and still has a lot of work to do before a new uptrend to be triggered. Currently oil is trading in the middle of is trading range but once the price breaks above $93 per barrel a good investment fund would be USO.

Oil Breakout


Russell 2000 Small Cap Index – IWM

Small cap stocks typically lead the broad market in both directions. They are the first to rally and the first to rollover and sell off. The major indexes like the DOW, SP500 and NYSE have not formed clean chart patterns which is why my focus is on the Russell 2000. Small cap stocks are now showing a rising relative strength compared to the SP500 large cap stocks and this is very bullish for stocks in general. The best way to trade this index is through the exchange traded funds IWM and TNA.

Rut Breakout


Post-Election Trading Breakout Summary:

In short, history shows that equities tend to rally after an election. For a detailed outlook of how to trade stocks and indexes during the election cycles be sure to read my report “The Election Cycle – What to Expect in Stocks & Bond Prices

Chris Vermeulen
www.TheGoldAndOilGuy.com
Add to SocialTrade

By: Chris Vermeulen – www.TheGoldAndOilGuy.com

Crude oil has had some large price swings this year and another one may be on its way. This report shows the seasonality of crude oil along with where oil is trading and what the oil service stocks are telling us is likely to happen going into year end.

Since WTI Crude Oil topped out in September at the $100 resistance level (Century Number) many traders are looking for a bounce or bottom to form in the next week. Historical charts show that on average the price of oil falls during November and the first half of December.

The charts of oil and oil stocks shown below have formed patterns on both time frames (weekly & daily) that lower prices are to be expected. If you did not read my Gold Seasonality Report I just posted be sure to review it here: Gold Seasonal Report

Crude Seasonality

WTI Crude Oil Weekly Chart:

Here you can see that price tends to fall going into Christmas and rallies during the last week of trading. This price action falls in line with Dimitri Specks seasonal chart providing us with insight as to what we should expect. Later this week I will finish my report on the Election Cycle Seasonality report which shows weakness in the market during Oct & Nov when a president is up for re-election.

Crude Oil Price

Oil Services Stocks – Weekly Chart:

If you follow oil closely then you know likely know already that oil related stocks can lead the price of oil by a couple weeks. What this means is that if big money is flowing into oil stocks (bullish price patterns with strong volume), then you should expect the price of crude oil to rise in the coming days. That said, if money is flowing OUT of oils stocks then lower or sideways oil price should be expected.

The weekly chart oil stocks show a very large bearish head & shoulders pattern. While I do not think the neckline will be broken it is very possible.

One of the most important pieces of data on the chart is the VOLUME. Notice the lack of it… Volume tells us how much interest and power is behind chart patterns and declining volume clearly tells us these investments are out of favor currently and that big money is not moving into them.

Oil Stocks Weekly

Oil Services Stocks – DAILY Chart:

Zooming into the daily chart of the oil service stocks we can see there is yet another bearish pattern unfolding. Another head & shoulders pattern which looks as though it is just starting to breakdown as of this writing. Next support level is $35-36.

Crude Oil Stocks Daily

WTI Crude Oil and Oil Service Stocks Trading Conclusion:

Looking forward 1-2 months (November – December) taking the seasonal price swings in oil, re-election cycle seasonality and price action of oil stocks I feel oil will trade sideways or down from here. With that being said, expect crude oil to rally during the last week of the year. I hope this provides some useful info for your trading!

Get my Daily Trading Analysis & Trade Setups at: www.TheGoldAndOilGuy.com


 Chris Vermeulen Chris Vermeulen is Founder of the popular trading analysis website www.TheGoldAndOilGuy.com. There he shares his highly successful, low-risk trade ideas. Since 2001 Chris has been a leader in teaching others to skillfully trade Currencies, Stock Indices, Bonds, Metals, Energies, Commodities, and Exchange Traded Funds. Reach Chris at: Chris[at]TheTechnicalTraders.com


Disclaimer:
This material should not be considered investment advice. Technical Traders Ltd. and its staff are not a registered investment advisors. Under no circumstances should any content from this website, articles, videos, seminars or emails from Technical Traders Ltd. or its affiliates be used or interpreted as a recommendation to buy or sell any type of security or commodity contract.
Our advice is not tailored to the needs of any subscriber so go talk with your investment advisor before making trading decisions This information is for educational purposes only.

Over the past year we have had some really interesting things unfold in the market. Investing or even swing trading has been much more difficult because of all the wild economic data and daily headline news from all over the globe causing strong surges or sell offs almost every week.

For a while there you could not hold a position for more than a week without some type of news event moving the market enough to either push you deep in the money or get stopped out for a loss. This has unfortunately caused a lot of individuals to give up on trading which is not a good sign for the financial market as a whole.

The key to navigating stocks which everyone thinks are overbought is to trade small position sizes and focus on the shorter time frames like the 4 hour charts. This chart is my secret weapon and giving you both large price swings which daily chart traders focus on while also showing clear intraday patterns to spot reversals or continuation patterns with precise entry/exit points.

While I could ramble on about why the stock market is primed for major long term growth from this point forward I will keep things short and simple with some 4 hour and daily charts for you to see what I see and what I am thinking should unfold moving forward.

Keep in mind, the most accurate trading opportunities that happen week after week are the quick shifts in sentiment which only last 2-5 days at most which is what most of my charts below are focusing on…

Dollar Index – 4 Hour Chart

This chart shows a mini Head & Shoulders reversal pattern and likely target over the next five sessions. The dollar index has been driving the market for the past couple years so a lower dollar means higher stock and commodity prices.

Dollar Index Trading

Bond Futures – 4 Hour Chart

Money has been flowing into bonds for the past couple weeks with most traders and investors expecting a strong correction in stocks. As you can see the price of bonds hit resistance this week and as of Thursday has now started selling off. Money flowing out of this “Risk Off” asset means money will move to the “Risk On” investments like stocks and commodities.

Bond Futures Trading

Gold Futures – Daily Chart

Gold is stuck in both categories in my opinion. It is a “Risk Off” safe haven when people are scared of falling stock prices, and it is also a “Risk On” speculative investment when people are feeling good about the market. Gold has been trading at key resistance for a couple weeks and looks as though it’s starting its next rally.

Gold Futures Trading

Silver Futures – Daily Chart

Silver is in the same boat as gold though it carries much more volatility than gold. Expect 2-4% swings regularly and sloppy chart patterns in this metal.

Silver Futures Trading

SP500 Futures – Daily Chart

As much as everyone hates to buy stocks up at these lofty prices I hate to say it but I think they are going to keep going up and they could do this for a long time yet. If the dollar index continues to break down then I expect the SP500 to rally another 3% from here (1500) in the next 1-2 weeks.

SP500 Futures Trading

Crude Oil Futures – 4 Hour Chart

Crude oil has not had much attention from me in the past few months. While it has had big price action many of those big days took place on news causing an instant price movement making this extra dangerous to trade. I continue to watch rather than get attached to it.

Crude Oil Futures Trading

Natural Gas Futures – Daily Chart

Natural gas has been a great performer for us in the past 6 months as all the short positions slowly get covered. I just closed out my natural gas ETF trade this week with a 31.9% gain and plan on getting back in once the chart provides another low risk setup.

Natural Gas Futures Trading

Trading Conclusion:

In short, I feel the dollar index along with bonds will correct over the next few weeks. That will trigger buying in stocks and commodities. Keep in mind natural gas dances to its own drum beat. The dollar does not have much affect on its price and most times natural gas is doing the opposite of the broad market. Get My Pre-Market Trading Analysis Video and Intraday Chart Analysis EVERY DAY – www.TheGoldAndOilGuy.com

Chris Vermeulen