Chris Joins Tom Bodrovics from Palisades Radio to discuss the recent moves in the markets and why money has resumed the move into equities. A new rally in equities could spill over to precious metals, thus putting pressure onto the US dollar.
Currently, the dollar is trading at the critical $94 level and, should it collapse, this could also serve to drive precious metal prices higher. Precious metals, such as gold, are pushing against the US Dollar, and we’re starting to see a momentum shift in GDXJ. On the flip side, miners like GDX and SILJ rely on energy prices remaining steady to stay profitable. Thus, as energy prices increase, the pressure is put on metals.
To Learn More click on the Video link Below
GET YOUR DAILY DOSE OF CHRIS’ PRECIOUS METALS ANALYSIS ALONG WITH THE HOTTEST ETFS TO TRADE WITH BAN TRADER PRO NOW PART OF THE TOTAL ETF PORTFOLIO!
https://thegoldandoilguy.com/wp-content/uploads/2021/11/palicades.jpg5681311adminhttp://www.thegoldandoilguy.com/wp-content/uploads/2014/11/tgaoglogo.pngadmin2021-11-11 07:56:222021-11-11 07:56:30US Dollar & Precious Metals: How Do They Relate? Video
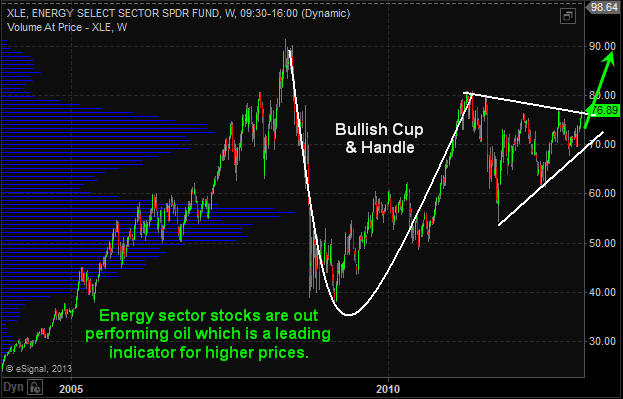
The energy sector has surged during the last two months which can be seen by looking at the XLE Energy Select Sector Fund. If crude oil continues to climb to the $112 level, XLE will likely continue to rally for another few days or possibly week as energy stocks are considered a leveraged way to play energy price movements.
Another way to look at this info is through the USO United States Oil Fund. This tracks much closer to the price of oil. The only issue is that many ETFs that “try to track” an underlying commodity is in how the funds are built. They own multiple contracts further into the future which does not exactly provide us with the short term news/event driven price movements in the current front month contract as they should.
What does this mumbo jumbo mean? Well, it means funds like USO and the highly respected UNG, and VIX ETFs… (just joking about the highly respected part), fail to track the underlying commodity or index very well when it comes to short term price movements. This means, you can nail the timing of a trade, and the commodity or index will move in your favor, yet your fund loses money, or goes nowhere…
Let’s Focus on the Technicals Now…
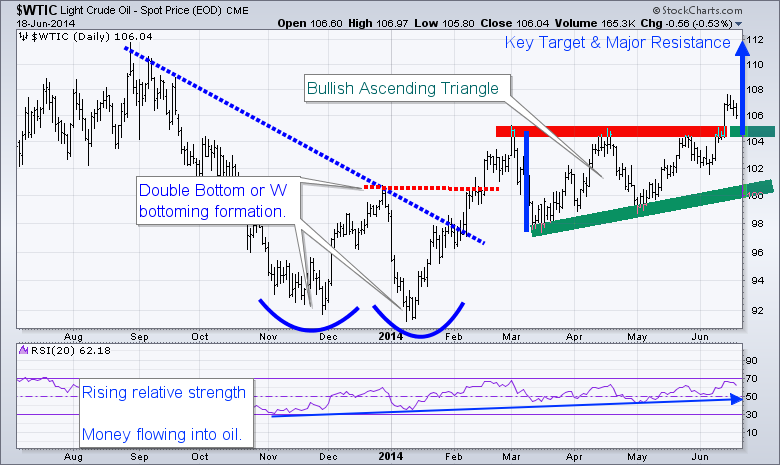
WTI crude oil has formed a bullish ascending triangle pattern from March to May of this year. The breakout to the upside is bullish and should be traded that way until the chart says otherwise. This breakout and first pullback must hold, or I will consider it a failed breakout. So if price dips and closes 2 days below the breakout level, it will be a major negative for oil in my opinion.
The range of the ascending triangle provides us with a measured move to the upside which is $112. Typically the first pullback after a breakout can be bought. The first short term target to scalp some gains would be $109, and at that point moving your stop to breakeven is a wise decision. Trading is all about managing capital and risk, if you don’t, then the market will take advantage of your lack in discipline.
Looking further back on the chart, you can see the double bottom formation also known as a “W” formation. Once the high of the “W” formation is broken the trend should be considered neural or up.
Also note that the RSI (relative strength) has been trending higher for some time now. This means money is rotating into this commodity. This is in line with my interview this week with Kerry Lutz and my recent article talking about the next bull market in commodities and the TSX (Toronto Stock Exchange).
WTI Crude Oil Trading Conclusion:
In short, oil has some extra risk around it. The recent move has been partly fueled by news overseas. So at any time oil could get a lift or take a hit by news that hits the wires. I tent to trade news related events with much less capital than I normally do because of this risk.
Chris Vermeulen
CEO & Founder
AlgoTrades.net
TheGoldAndOilGuy.com
https://thegoldandoilguy.com/wp-content/uploads/2014/06/oilwti.png179273adminhttp://www.thegoldandoilguy.com/wp-content/uploads/2014/11/tgaoglogo.pngadmin2014-06-20 06:45:352014-06-19 13:40:33WTI Crude Oil on the Move $112 Next Stop
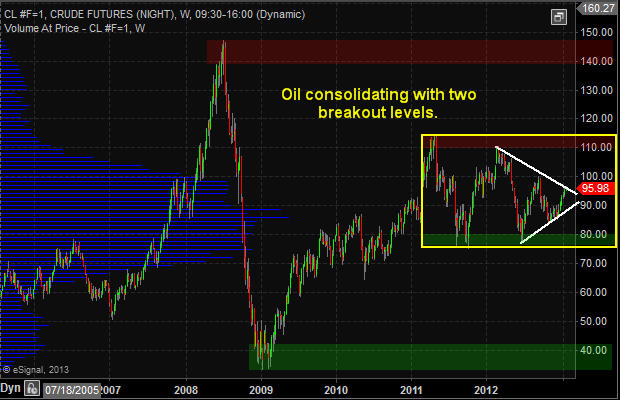
Crude oil has been trading ways for the past year between the 2011 high and low. The trading range through 2012 has been contracting with a series of lower highs and higher lows. This pennant formation because it is taking place after an uptrend is a bullish pattern with $110 and possibly even $140+ per barrel in the next 6-18 months.
If you look at the weekly investing chart of crude oil the key support and resistance levels area clearly marked. A breakout of the white pennant will trigger a move to the next support or resistance level. And judging from the positive economic numbers not only form the USA but globally the odds are increased for the $110+ price target to be reached sooner than later.
Crude Oil Price Chart – Weekly Investing
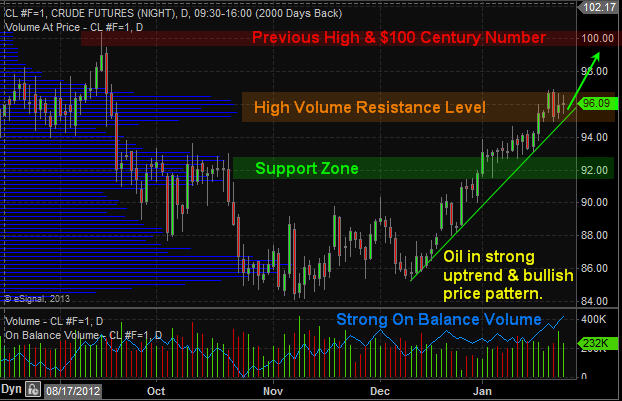
Crude Oil Price Chart – Daily short term Analysis & Target
If we zoom into the daily chart and analyze price and volume you will notice the $100 per barrel level is potentially only 2-3 days way… But keep in mind whole numbers (decade & Century Numbers) naturally act as support and resistance levels. So when the $100 century price is reached there will be a wave of sellers with fat thumbs who will slam the price back down to the $96 and possibly back down to the $92 level before oil continues higher.
Utility Stocks – XLU – Weekly Investing Chart
The utility sector has done well and continues to look very bullish for 2013. This high dividend paying sector is liked by many and the price action speaks for its self… Keep in mind you can view my actual watchlist of stock and ETFs I trade in real-time with my analysis free: https://stockcharts.com/public/1992897
Energy Sector Weekly Investing Chart
Energy stocks which can be followed using the XLE exchange traded fund (ETF) typically leads the price of oil. Looking at energy stocks we can see that they are outperforming the price of crude oil and on the verge of breaking out of a large Cup & Handle pattern. If so then $90 is the next stop but prices may go much higher in the long run.
Once a breakout takes place on either the white or yellow lines on the first crude oil weekly chart we should see oil, energy and utility stocks start making some big moves. Depending on the direction of the breakout (Up or Down) it must be played in that direction to generate substantial profits obviously.
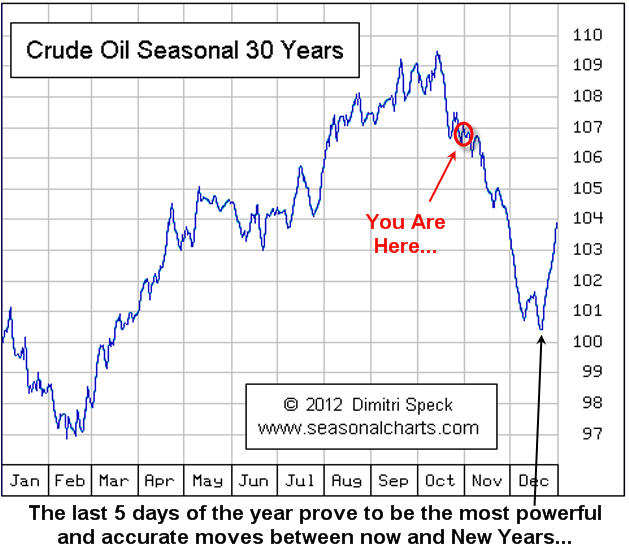
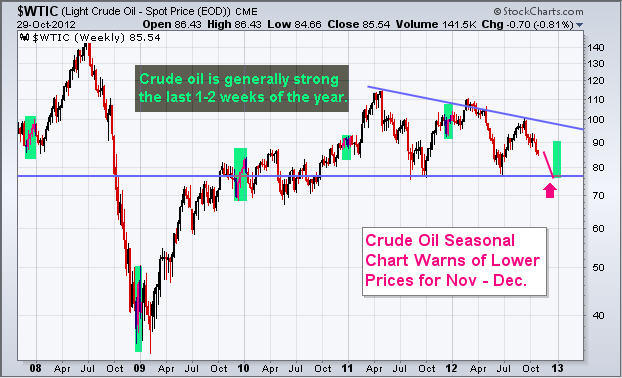
Crude oil has had some large price swings this year and another one may be on its way. This report shows the seasonality of crude oil along with where oil is trading and what the oil service stocks are telling us is likely to happen going into year end.
Since WTI Crude Oil topped out in September at the $100 resistance level (Century Number) many traders are looking for a bounce or bottom to form in the next week. Historical charts show that on average the price of oil falls during November and the first half of December.
The charts of oil and oil stocks shown below have formed patterns on both time frames (weekly & daily) that lower prices are to be expected. If you did not read my Gold Seasonality Report I just posted be sure to review it here: Gold Seasonal Report
WTI Crude Oil Weekly Chart:
Here you can see that price tends to fall going into Christmas and rallies during the last week of trading. This price action falls in line with Dimitri Specks seasonal chart providing us with insight as to what we should expect. Later this week I will finish my report on the Election Cycle Seasonality report which shows weakness in the market during Oct & Nov when a president is up for re-election.
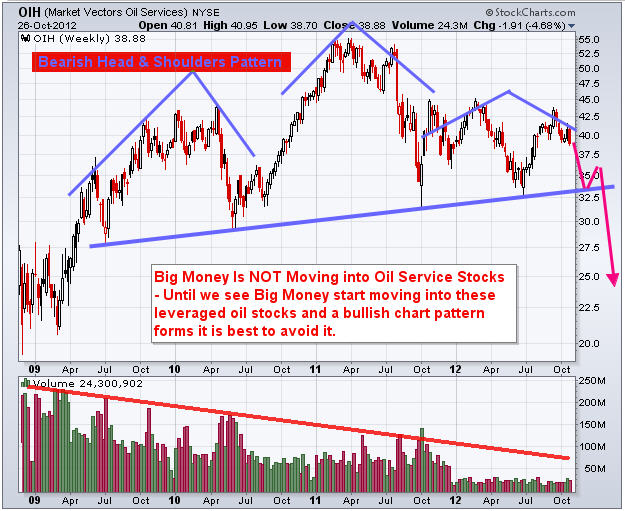
Oil Services Stocks – Weekly Chart:
If you follow oil closely then you know likely know already that oil related stocks can lead the price of oil by a couple weeks. What this means is that if big money is flowing into oil stocks (bullish price patterns with strong volume), then you should expect the price of crude oil to rise in the coming days. That said, if money is flowing OUT of oils stocks then lower or sideways oil price should be expected.
The weekly chart oil stocks show a very large bearish head & shoulders pattern. While I do not think the neckline will be broken it is very possible.
One of the most important pieces of data on the chart is the VOLUME. Notice the lack of it… Volume tells us how much interest and power is behind chart patterns and declining volume clearly tells us these investments are out of favor currently and that big money is not moving into them.
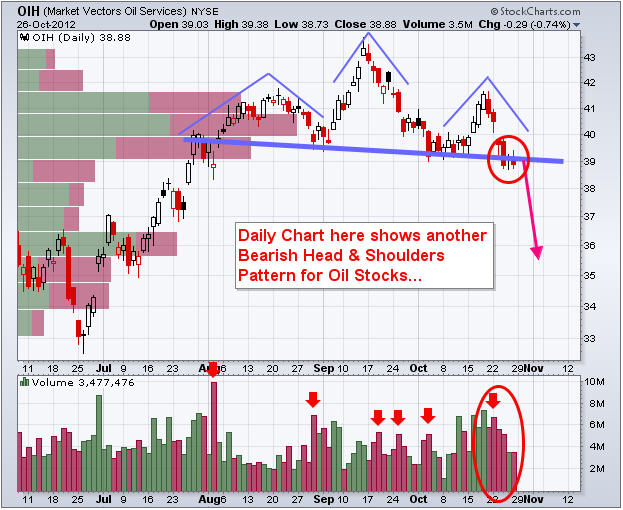
Oil Services Stocks – DAILY Chart:
Zooming into the daily chart of the oil service stocks we can see there is yet another bearish pattern unfolding. Another head & shoulders pattern which looks as though it is just starting to breakdown as of this writing. Next support level is $35-36.
WTI Crude Oil and Oil Service Stocks Trading Conclusion:
Looking forward 1-2 months (November – December) taking the seasonal price swings in oil, re-election cycle seasonality and price action of oil stocks I feel oil will trade sideways or down from here. With that being said, expect crude oil to rally during the last week of the year. I hope this provides some useful info for your trading!
Chris Vermeulen is Founder of the popular trading analysis website www.TheGoldAndOilGuy.com. There he shares his highly successful, low-risk trade ideas. Since 2001 Chris has been a leader in teaching others to skillfully trade Currencies, Stock Indices, Bonds, Metals, Energies, Commodities, and Exchange Traded Funds. Reach Chris at: Chris[at]TheTechnicalTraders.com
Disclaimer:
This material should not be considered investment advice. Technical Traders Ltd. and its staff are not a registered investment advisors. Under no circumstances should any content from this website, articles, videos, seminars or emails from Technical Traders Ltd. or its affiliates be used or interpreted as a recommendation to buy or sell any type of security or commodity contract. Our advice is not tailored to the needs of any subscriber so go talk with your investment advisor before making trading decisions This information is for educational purposes only.
Crude oil prices hit a four-month high this week on the back of rising tensions in the Middle East and North Africa and the unfortunate murder of the U.S. ambassador to Libya. Added impetus on the upside was given to oil by the announcement of more money printing (QE3) by the Federal Reserve which said it would launch an open-ended commitment to purchase $40 billion of mortgage-backed securities monthly.
The global benchmark for oil, Brent crude oil, jumped to about $117 a barrel. It maintained its roughly $18 premium to U.S.-based WTI crude oil which was trading at $100 a barrel on a couple days ago. Non-futures investors can easily participate in the oil market through the use of exchange traded funds. The ETF which tracks Brent crude oil futures is the United States Brent Oil Fund (NYSE: BNO) and the ETF which tracks WTI crude oil futures is the United States Oil Fund (NYSE: USO).
The real story behind the story in the oil market, however, is the ongoing Arab Spring which is sweeping throughout the Middle East and North Africa, pushing aside some regimes and threatening others. The countries whose governments, such as Saudi Arabia and the other Gulf states, feel threatened by popular uprisings are where investors should put their focus.
Saudi Arabia in particular is key because it accounts for more three-quarters of the world’s spare oil production capacity. So it is very important to note that the kingdom is no longer a price ‘dove’ in OPEC as it has been for decades. It has joined Iran, Venezuela and others in being a price ‘hawk’.
The reason behind the change in attitude is simple…Arab Spring.
Like its neighbors in the Gulf region, Saudi Arabia has gone on a public spending spree to appease its restless citizens. It has sharply increased outlays on subsidies for items like food, fuel and housing in an attempt to appease its citizens. In 2011, the kingdom raised its domestic spending by $129 billion – the equivalent of more than half its oil revenues.
Much of this increased spending will go toward upgrading the country’s infrastructure. Take electricity, for example. Saudi Arabia has revealed plans to spend more than $100 billion dollars on power plants and distribution networks by 2020. The kingdom has also set a goal to electrify 500,000 new homes that are being built in an attempt to mollify political unrest among its population of 27 million people.
This spending spree led the International Monetary Fund and other analysts to estimate that the kingdom and other Gulf countries need oil to be selling between $80 and $85 a barrel in order for the governments to balance their budgets. This is up, in Saudi Arabia’s case, from a mere $25 a barrel a few short years ago!
Unfortunately for oil consumers, this trend looks set to continue in years ahead. According to the Institute of International Finance, by 2015 the Saudi government will only be able to balance its budget if oil prices are at $115 a barrel if current spending trends remain in place.
So in effect, with the Arab Spring forcing governments to spend more on their citizens, it has put a floor under the price of oil. OPEC will do everything in its power to keep the price above the budget breakeven points for governments in the Gulf region.
Keep up to speed on the oil and precious metals markets with my free newsletter: www.GoldAndOilGuy.com
Chris Vermeulen
http://www.thegoldandoilguy.com/wp-content/uploads/2014/11/tgaoglogo.png00adminhttp://www.thegoldandoilguy.com/wp-content/uploads/2014/11/tgaoglogo.pngadmin2012-09-18 09:43:322012-09-18 09:43:32Arab Spring and Oil Prices
The past two months we have seen all the focus from traders and investors be on the equities market. And rightly so and stocks run higher and higher. But there are two commodities that look ready to explode being gold and oil (actually three if you count silver).
Below are the charts of gold futures and crude oil 4 hour charts. Each candle stick is 4 hours allows us to look back 1-2 months while still being able to see all the intraday price action (pivot highs, pivot lows, strong volume spikes and if they were buyers or sellers…).
The 4 hour chart is one time frame most traders overlook but from my experience I find it to be the best one for spotting day trades, momentum trades and swing trades which pack a powerful yes quick punch.
As you can see below with the annotated charts both gold and silver are setting up for higher prices in the next 1-2 weeks from a technical point of view. That being said we may see a couple days of weakness first before they start moving up again.
The last week of the year volume tends to be light due to the fact that big money traders are busy enjoying the holidays and waiting for their yearend bonuses.
I was not planning on doing much this week because of the low volume but after reviewing some charts and risk levels on my top 5 trading vehicles I could not help but share my findings with everyone last Friday.
This Wednesday turned out to be an exciting session with all 5 of my trade ideas moving in our favour right on queue.
Charts of the 5 investments moving in the directions we anticipated …
– Dollar bounced off support
– Stocks are topping and selling off today
– Oil looks to have topped and is selling off
– Gold and Silver are moving lower
– VIX (Volatility Index) just bounced
Many of my readers took full advantage of my recent analysis and trade ideas which is great to hear. All the different ways individuals used to make money from Friday’s analysis is mind blowing…
The most common trade is the oil one with most traders adding more to Tuesday when the price reached its key resistance level on the chart. Also many traders took partial profits Wednesday locking in 3% or more in two days using the SCO ETF.
It’s amazing how many people like to trade the vix using ETFs. The best trade from followers thus far was an 8% gain in TVIX which was bought 4 days ago anticipating the pop in volatility which I had been talking about last week. Keep in mind ETFs for trading the vix are not very good in general. I stay away from them, but TVIX is the best I found so far.
Currently stocks are oversold falling sharply from the pre-market highs. Meaning stocks have fallen too far too fast and a bounce is likely to take place Thursday.
Also we saw some panic selling hit the market today with 14 sellers to 1 buyer. That level tells me that the market needs some time to recover and build up strength for another selloff later this week or next. We will see this pause unfold when the SP500 drifts higher for a session or two with light buying volume. This will confirm sellers are in control and give us another short setup.
In my Wednesday morning video I explained how/where to set stops when using leveraged ETFs because I know 90% of traders using them do not have a clue as to how to do this and they get shaken out of their trades just before a top or bottom. So if you want to learn more about it watch this morning’s video please: http://www.youtube.com/watch?v=lDagN5Vpvys
I hope this helps you understand things more… Over time you will pickup on a lot of new trading tips, tools and techniques with this free newsletter so just give it time and keep trades small until you are comfortable with my analysis.
http://www.thegoldandoilguy.com/wp-content/uploads/2014/11/tgaoglogo.png00adminhttp://www.thegoldandoilguy.com/wp-content/uploads/2014/11/tgaoglogo.pngadmin2011-12-28 21:50:562014-03-06 12:40:09Five Best Trade Ideas for the Next Two Weeks
Typically, the week before Christmas, stocks and commodities drift higher due to the lack of participants. Light volume favours higher prices, which is why stocks want to rise going into the holiday season.
The big money players, like hedge fund managers, are finished for the year. They’re sitting on the sidelines enjoying the holiday season while waiting for their year-end bonus checks.
Let’s take a quick look at how the week finished…
Friday was an interesting session as stocks and oil reached some key resistance levels. Below are my thoughts, charts, and a possible trade idea for next week.
Gold & Silver Thoughts:
Looking at the long term charts of gold and silver, I feel they could head much lower in the first quarter of 2012. The inverse relationship between the dollar index and gold makes me think this is a high probability scenario.
The weekly dollar index chart remains strong at this point and could start another very strong rally any day. Once the dollar starts heading higher, expect precious metals to move down along with equities.
SP500, Dollar and Volatility Index
Below are three charts stacked on top of each other. They are marked with my analysis and thoughts for next week. Personally, I don’t feel shorting stocks is a safe play. The last week of the year, we can see the volatility index (VIX), and the dollar, rise without putting pressure on stocks. So be aware of that.
TRADE IDEA – View Chart:
Crude oil looks like a great low risk opportunity (a real “Christmas” present!) from Mr. Market. SCO would be the ETF for US based traders. HOD, which is listed on the TSX, is good for Canadians. I favour this setup because I don’t feel that oil will be as affected from the holiday bulge as will American equities.
Pre-Holiday Trading Conclusion:
I was planning on avoiding the market Friday, but the charts were calling my name… The session ended with what looked to be a short squeeze. The remaining short positions didn’t get their expected drop in price. Consequently, when the traders all started to cover their shorts (buy) just before the close, it caused a strong surge higher.
I do not recommend shorting stocks next week because of the light volume. However, oil looks good to me.
Just thought I would share my end of the week thoughts, and wish you a Merry Christmas!
http://www.thegoldandoilguy.com/wp-content/uploads/2014/11/tgaoglogo.png00adminhttp://www.thegoldandoilguy.com/wp-content/uploads/2014/11/tgaoglogo.pngadmin2011-12-23 19:27:172014-03-06 12:40:33Holiday Short Squeeze & Oil Trade Idea
Yet another major market correction has begun to unfold over the past couple of weeks.
I have a much different outlook on the markets than most everyone else. This likely includes you as well. However, before you stop reading what I have to say, hear me out. My outlook and opinions are based strictly on price, volume, inter-market analysis, and crowd behavior. I hope you will consider my ideas and how they might affect your current positions.
My fundamental thinking is contrarian in nature. I feel that gold and silver have risen because of obvious reasons, those mainly being the printing of money. Also, fears that fiat currencies will become obsolete in the next 5 years continue to push the metals higher.
The flaw with that thinking is that most or all of the bad news has come out with European crisis. We know there are still major issues to resolve, however, the end of the world did not happen. Looking forward 5 years, countries will likely have stopped acting like teenagers who spend more money than they have on their credit cards. Hopefully they start creating budgets which they can and will abide by.
Should this happen, it would mean that the global economy as a whole will be stronger than ever before. We may have a few bumps along the way, but I feel countries and individuals will be better positioned than ever a scant 5 years from now.
Since my warning we have seen the financial markets fall: SP500 down 2.6% Crude Oil down 4.4% Gold down 9.6% and Silver down 12.2%
If you had invested in any of the leveraged exchange traded funds of these items, you could have doubled or tripled your returns. The numbers of those who have been cashing in on my advice about these recent pullbacks, have been very gratifying to hear about. The exciting part about trading is the fact that moves like this happen all the time. So if you missed this one, don’t worry because there is another opportunity just around the corner.
While my negative views on stocks and precious metals may rub the gold and silver bugs the wrong way, I just want to point out what is unfolding in an objective way in order for everyone to see both sides of the trade. I also would like to mention that this analysis can, and likely will change on a weekly basis as the financial markets and global economies evolve over time. The point I am trying to get across is that I am not a “Gloom and Doom” kind of guy. I don’t always favor the down side. Rather, I am a technical trader simply providing my analysis and giving odds for what to expect next.
Let’s take a look at some charts and dig right in…
In short, stocks and commodities are under pressure from the rising dollar. We have already seen a sizable pullback but there may be more to come in the next few trading sessions.
Overall, the charts are starting to look very negative which the majority of traders/investors around the world are starting to notice. With any luck they will fuel the market with more selling pressure pushing positions that my subscribers and I are holding deeper into the money.
Now that the masses are starting to get nervous and are beginning to sell out of their positions, I am on high alert for a panic washout selling day. This occurs when everyone around the world panics at the same time and bails out of their long positions. Prices drop sharply, volume shoots through the roof, and my custom indicators for spotting extreme sentiment levels sends me an alert to start covering my shorts and tightening our stops.
Hold on tight as this could be a crazy few trading sessions….
Get these Free Weekly Reports EVERY WEEK
http://www.thegoldandoilguy.com/wp-content/uploads/2014/11/tgaoglogo.png00adminhttp://www.thegoldandoilguy.com/wp-content/uploads/2014/11/tgaoglogo.pngadmin2011-12-14 13:35:392014-03-06 12:41:15Precious Metals, Equities & Oil Long Term Outlook Part II
Crude oil was THE commodity to trade back in 2007-2008 when prices rocketed above $145 per barrel then dropped like a rock all the way back down to $35 per barrel leaving many investors and traders either greatly rewarded or dead broke.
Since then the focus of the world has moved to gold and silver as currencies spiral out of control with more and more reasons why individuals and entire countries should focus on owning physical metals rather than eroding currencies.
Just because a commodity is not under the direct spot light does not mean you can’t trade it or make money from it. With that said here is my analysis on how to trade oil if $100 per barrel is reached in the coming trading days.
Let’s take a look at the charts…
Long Term Weekly Oil Futures Chart
Here you can see how oil is trading round the $100 level. When the price is trading below it then $100 will act as resistance and when oil is above then it becomes support.
How To Trade Oil ETF
Intermediate Term Daily Oil Trading Chart:
This is more of a close up look at oil and the $100 price point. Notice how oil has moved higher for an entire month without any real pullbacks and that it has a clean support trend line underneath. If oil sees some big sellers step in here at the $100 – $104 level then I expect the green support trend line to be broken. If that takes place oil could quickly and easily drop back down to the $90-$92 area.
How To Trade Crude Oil
How to Trade Oil Using an Oil ETF
This chart shows a long (bullish) oil ETF along with its price by volume levels. I like to review the price by volume analysis from time to time when nearing a major support or resistance level on a chart. For those who have difficulty finding support and resistance levels then this indicator/volume analysis tool will take most of your guess work out of the equation.
To make a long story short, the longer the volume bars on the left side of the chart are then the more people either bought or sold crude oil at that price. Keep in mind that it does not matter if they bought or sold here… the key to remember is that there are a lot of new positions here and that is where people exit their positions at breakeven because they held such a large draw down over the past few months and just want their money back.
Most traders and investors who trade off pure emotions (fear/greed) would have held a losing position through the August – October selloff and are now going to be more than happy to exit the trade at breakeven and move on to the next emotional roller coaster. It’s this type of trading which allows the non-emotional traders who thrive off of price action and mass psychology to catch price swings in the oil market.
The chart below clearly shows that oil is entering into resistance level and a pullback is becoming more likely each day. Those looking for an etf how to trade oil should look at buying SCO ETF. This oil ETF goes up in value when oil loses value.
How To Trade Oil ETFs
How to Trade Oil and Oil ETFs Conclusion:
In short, oil is becoming overbought meaning it has moved up to far too fast and should have some profit taking shortly. The fact the oil is reaching a century number ($100) I feel there will be a couple days of selling starting soon. Traders looking to play this support trendline breakdown should look at trading SCO oil etf.
If you would like to receive my Free Weekly Trading AnalysisJoin Now: www.GoldAndOilGuy.com
Chris Vermeulen
http://www.thegoldandoilguy.com/wp-content/uploads/2014/11/tgaoglogo.png00adminhttp://www.thegoldandoilguy.com/wp-content/uploads/2014/11/tgaoglogo.pngadmin2011-11-13 22:51:252014-03-06 12:48:52How to Trade Oil ETFs when $100p/b is Reached