Today’s gap higher in stocks has many investors feeling really good about but will this rally last?

My to the point answer is “Yes” but there will be some bumps and navigating positions along the way.

Looking at the charts below you will notice how stocks are trading up over 4% in two trading sessions and several indicators and technical resistance levels are now being tested. Naturally when several resistance levels across multiple time frames, cycles and indicators we must be open to the idea that stocks could pause or pullback for a few days before continuing higher.

Here is a quick snapshot of charts I follow closely to help determine short term overbought and oversold market conditions.
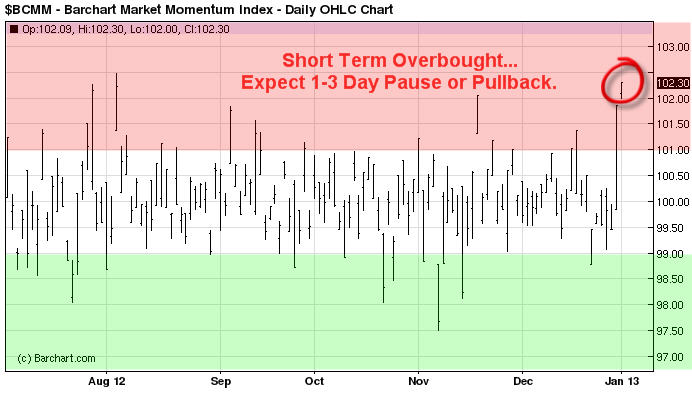
Momentum Extremes:

This chart helps me know when stocks are overbought or oversold. This trend can be follows using the 30 or 60 minute charts helping you spot short term tops and bottoms.

BroadMarketMomentum1

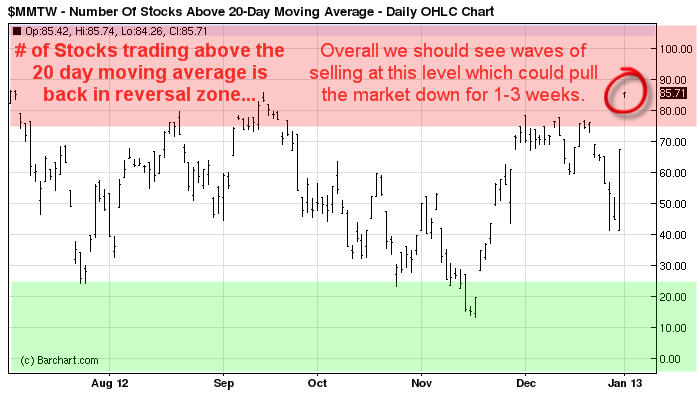
Stocks Trading Above 20 Day Moving Average:

This chart helps me time swing trades which last for 1-3 weeks in length and I use the daily chart to spot these reversals and trends.

SwingTradeOverbought2


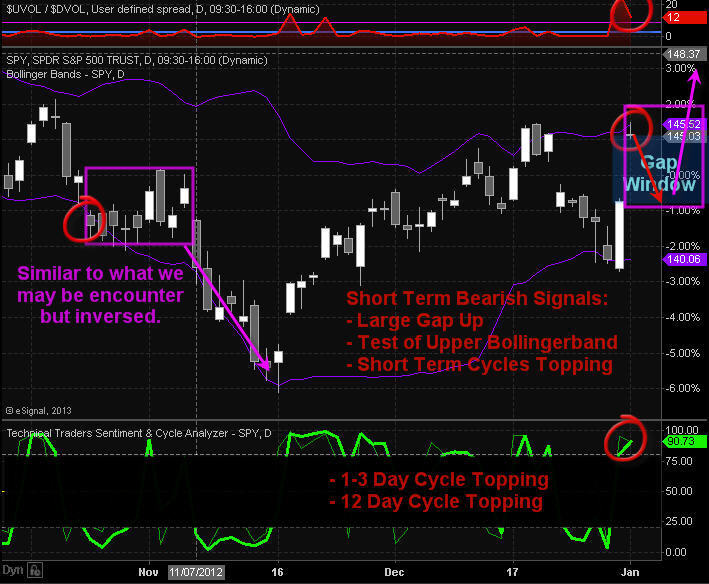
Daily SP500 Index Chart:

This chart shows the big gap in price, test of upper bollingerband, momentum and swing trading cycles topping and 12 buyers to ever one seller on the NYSE which tells me everyone is running to buy everything they can today and that is a contrarian signal.

IndexChart3


Trading Conclusion:

This strong bounce which started on Monday from a very oversold market condition does look as though it has some power behind it. And over the next 1-3 days we could see prices grind higher until this momentum stalls out. Once that happens we should see most of the gap filled. This will provide us with a lower entry price and reduce our downside risk for index, sector and commodity ETFs.

If you are a stock trader then be sure to checkout my partners stock trading website www.ActiveTradingPartners.com where his last two trades Dec 31 pocketed 12.3% with gold stocks ETF NUGT, and took more profits with PRLB Jan 2nd for a 9.2% gain.

This type of bounce and momentum can lead to a running correction which makes it impossible for traders to by on a dip. A running correction is when prices slow chop higher in a narrow range for some time then explode higher continuing its rally. This is when you just need to jump in trades and chase prices higher but we will not do that until I see signs of a running correction.

Today many of the major market moving stocks are testing resistance which means if they start to get sold the broad market will pullback with them.

Follow All My Trades for 2013 – Start Today and Get 12 Months for only 6 Months: http://www.thegoldandoilguy.com/signup-newyear.php

Chris Vermeulen

The stock market is at a very critical pivot point which I feel will generate opportunities in December and for the first quarter of 2013.

Trading with the trend is not always an easy task. It is human nature to predict and jump to conclusions and usually it’s better to trade with the trend no matter what your emotions are telling you. The current trend is down and I stick with that until we are proven wrong.

If you carefully analyze the charts below you will understand where we are trading in the market and what the risks are at this point. The question is are in the middle of a trend reversal back up, or is this just a bounce within a down trend? Either way, any pullback this week should be aggressively managed to lock in gains and tighten stops because it could go either way and you do not want to be on the wrong side of the table.

The chart below shows the US dollar index 4 hour chart. It looks as though we should start to see a bounce this week and that should put pressure on stocks and commodities.

The SP500 (SPY etf) below that shows my analysis and key price levels. I took a short position on the SPY Friday afternoon as I feel a pullback is imminent. That being said, all I need is one big down day and I will be pulling money off the table to lock in gains and tighten my stop.

If a detailed educational lesson on stock market cycles read my mini course here: http://www.thegoldandoilguy.com/downloads/COAAROTB.pdf

Dollar Index and SPY ETF Trading

My trading charts make reading the market simple, quick and precise so if you want this type of analysis and trade ideas delivered to your inbox every day including my Pre-Market video analysis then join my newsletter here: www.TheGoldAndOilGuy.com

Chris Vermeulen

As mentioned last Friday just before things took a dive on the weekend, a look at the major market indices did not look promising.  If we take an even longer term look and examine the monthly charts we can see that The S&P 500 as well as the Dow Jones have been approaching multi-decade rising channel resistance lines.  Further, they also appear to be forming bearish rising wedge patterns.


Monthly Long Term Chart Analysis & Thoughts:

Monthly SPX Index Trading

As many of my longer term subscribers can attest to, I always preach that technical analysis is one part  art and one part science:  you can never be completely certain on what the outcome of a pattern is going to be.  However, we can use historical analysis to make better investments. The great American Novelist Mark Twain probably said it best in that “history does not repeat itself, but it rhymes”.  Regarding a rising wedge pattern, we know that roughly two-thirds of the time they will break to the downside.  This also means that one-third of the time they break to the upside.

In accomplishing our goal of capital growth we must do a number of things.  We must make returns on our investments, we must protect our investments, and we must limit our losses.  While all three aspects work in tandem with each other, there are times when focus must be allocated to one specific approach.

Regarding the current technical setup, I’m not so focused on the 67% chance that these wedges will break to the downside, but more so the impact of each outcome on the average Joe’s portfolio and mom and pop businesses.  The S&P 500 and the Dow are approaching long term resistance lines that have been in place for decades.  If we do break to the downside, which I suspect we will, there could be a very significant sell off with consequences that no one can predict at this point though I mention some things in the chart above.  Alternatively, there is significant overhead resistance in the various indices, and I don’t believe an upside break would be too monumental.

That being said, I always like to keep an open outlook and wait for the right opportunity.  I’m trying to think of scenarios that would prelude further upside action and I really am not coming up with much.  As evidenced by the completion of the recent 5 wave uptrend on the S&P that coincided nicely with the various quantitative easing policies, Ben Bernanke and the fed have had less and less impact.  I truly can’t see many fiscal developments that would prompt any significant bullish action.

The only scenario I really think that could pump up equities is a series of positive earnings announcements.  A lot of expectations, earnings numbers, guidance, etc… have been revised downwards over the last couple of quarters, so there is the opportunity for some positive surprises that could lead to some bullish price action.  In absence of such a scenario, I really can’t think of much else that would prompt a run up.

Look at these charts of positive and negative earnings surprises… and the dates and remember what happened following this negative data….


Positive Earnings Surprise

Earnings Positive SurprisesEarnings Positive Surprises


Negative Earnings Surprise

Earning Negative Surprises

That being said, I am recommending two courses of action.  For those steadfast bulls, lock in some profits and/or buy some protection.  Missing out on some of the upside is a lot better than losing some of the gains you have fought so hard for over the past couple of years.  For the more aggressive traders and investors, start following my updates a little more regularly as I foresee many shorting opportunities coming up in the future.  As many of you know, sell-offs are often quick and abrupt, and timing is extremely important when playing the downside.

Further, trading could get very volatile in the near future.  Historically, and even more so looking forward as August and September have been very costly for the average investor.  Our focus will be in taking the highest probability trades that offer the best risk to reward scenarios.  There will be times when we miss trades, and times when they’re not timed perfectly.  But, as those who have been with me for a while can attest to, patience pays off in the long run…

Join my Free Market Analysis & Trade Idea Newsletter Now: www.GoldAndOilGuy.com

Chris Vermeulen

I have put together a very detailed video this morning coving bother some long term, short term and market cycles. The video is a little longer than normal but I want you to understand fully where the market is trading and what to look for in the coming days.

Pre-Market Analysis Points:

–          Dollar is trading higher this morning which is putting pressure on stocks & commodities.

–          Fed Chairman Bernanke Testifies at 10am ET which will cause all investments to move wild.

–          Oil is trading slightly lower and oil inventory numbers come out at 10:30am ET.

–          Natural gas is flat and continues to build a base at resistance for a possible future breakout.

–          Gold, Sold Miners and Silver continue to consolidate within a multi month pattern. A major move is brewing but has not been triggered as of yet.

–          Bonds are trading up from yesterday’s close after pulling back from reaching our double top price target on Monday.

–          SP500 is nearing a couple resistance levels (previous pivot high, down trend line) Momentum, short term and intermediate cycles are starting to top and that means we should be prepared for a pullback/down trend which could last 4-6 weeks.


Watch Video For Clarity


Get This Video Analysis EVERY MORNING here: www.GoldAndOilGuy.com

Chris Vermeulen

Gold and stock market forecaster have been using cycles in price that repeat every certain amount of trading days to help them spot key reversal areas in the financial market. Almost everything in life seems to go in cycles and commodity prices and the stock market are no different.

As we all know the market is very difficult to forecast when using only one set of analysis like cycles. Analyzing price action, volume, market sentiment, market breadth, trends and inter-market analysis are the other key areas which one must understand before they can be in the zone (ZEN) with the financial market and properly forecast future prices.

This report will show you just how well cycles work if applied and traded properly.

How to Buy Dips and Sell Rips in Gold Using Cycle Analysis

The chart below is of gold and shows its short term trading cycles. I will admit this chart is hard on the eyes and as ugly as they get to bear with me.

Three different cycles have been applied to the chart using a short, intermediate and long term cycle wave length. The general idea here is that you want to trade with the underlying trend, then use these short term cycles to profit from weekly price swings.

Gold has been in a down trend for a year so the focus should be on shorting the bounces. Focusing on selling short gold during a time with 2 or more cycles are topping as you stand a great chance of the price moving in your favor within 1-3 days.

Once the price starts to move in your favor you want to scalp to profits once the short term (green) cycle drops near a reversal level. Once this takes place I always tighten my stops to breakeven, lock in some profits and continue to wait for another cycle to reach the bottom at which point I take more profit off the table and tighten my protective stop once again.

As you can see this is not the perfect system but it makes money, and if you apply more analysis to the market you can lock in more of these moves using intraday charts, volume, and sentiment levels.


Gold Market Cycles

Gold Market Cycles


How to Find Market Cycles

You must have an analysis tool that can read the market and find cycles within it. Once you know how many days the most frequent cycles are occurring you can then use a custom cycle indicator to overlay them on the charts as seen in the gold chart above. The visual overlay is the key to spotting market reversals and areas to add to a position or trim profits. Look at the chart below for a visual of how I find my cycles.


Market Forecast Cycles

Market Forecast Cycles


Gold Cycle Forecast Conclusion:

In short, gold overall remains in a down trend. But from looking at the gold chart and its short term cycles I have a feeling we will be seeing price trade sideways this week and a bounce next week.

The next week will be very interesting as these cycles will actually give us an early warning if the overall gold market is about to bounce or sell off. The question is what the cycles do in the next few days while gold flirts with support…

It does take some time/experience to read the cycles and get a feel for how they move so don’t worry about it if you don’t fully grasp the idea from this short article. Find out more on cycles and trading at www.GoldAndOilGuy.com

Chris Vermeulen